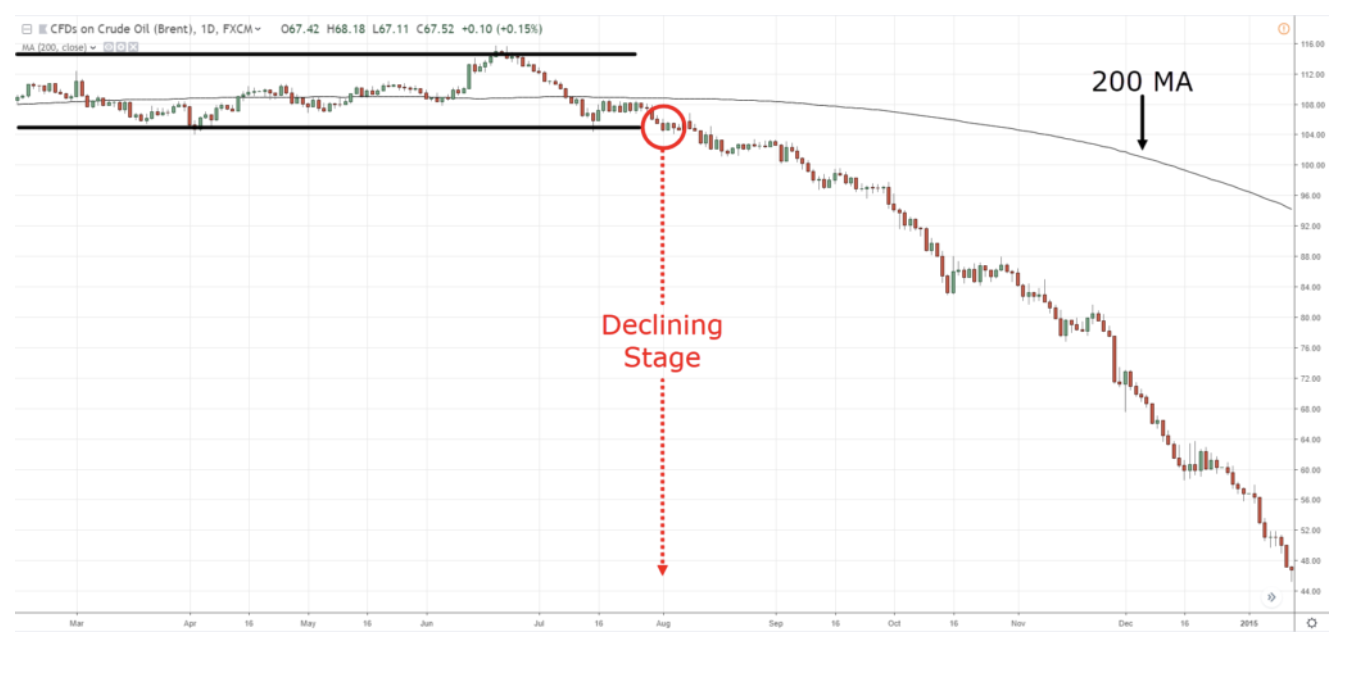
“Nothing good ever happens under the 200-day moving average,” said my old friend, hedge fund legend Paul Tudor Jones.
“Nothing good ever happens under the 200-day moving average,” said my old friend, hedge fund legend Paul Tudor Jones.
Global Market Comments
April 2, 2026
Fiat Lux
Featured Trade:
(THE LAZY MAN’S GUIDE TO TRADING),
(ROM), (UXI), (BIB), (UYG)

I like to start out my day by calling readers on the US East Coast and Europe, asking how they like the service, are there any ways I can improve the service, and what topics would they like me to write about.
After all, at 5:00 AM Pacific time, they are the only ones around.
You’d be amazed at how many great ideas I pick up this way, especially when I speak to industry specialists or other hedge fund managers.
Even the 25-year-old day trader operating out of his mother’s garage has been known to educate me about something.
So when I talked with a gentleman from Tennessee in the morning, I heard a common complaint.
Naturally, I was reminded of my former girlfriend, Cybil, who owns a mansion on top of the levee in nearby Memphis overlooking the great Mississippi River.
As much as he loved the service, he didn’t have the time or the inclination to execute my market-beating Trade Alerts.
I said, “Don’t worry. There is an easier way to do this.”
Only about a quarter of my followers actually execute my Trade Alerts, and a lot of them are professionals. The rest rely on my research to correctly guide them in the management of the IRA’s 401(k)’s, pension funds, or other retirement assets.
There is also another, easier way to use the Trade Alert service. Think of it as “Trade Alert light.” Do the following.
1) Only focus on the four best of the S&P 500’s 101 sectors. I have listed the ticker symbols below.
2) Wait for the chart technicals to line up. Bullish long-term “Golden crosses” will set up for several sectors, as with precious metals now.
3) Use a macroeconomic tailwind.
4) Shoot for a microeconomic sweet spot, companies and sectors that enjoy special attention.
5) Increase risk when the calendar is in your favor, such as from November to May.
6) Use a modest amount of leverage in the lowest risk bets, but not much. 2:1 will do.
7) Scale in, buying a few shares every day on down days. Don’t hold out for an absolute bottom. You will never get it.
The goal of this exercise is to focus your exposure on a small part of the market with the greatest probability of earning a profit at the best time of the year. This is what grown-up hedge funds do all day long.
Sounds like a plan. Now, what do we buy?
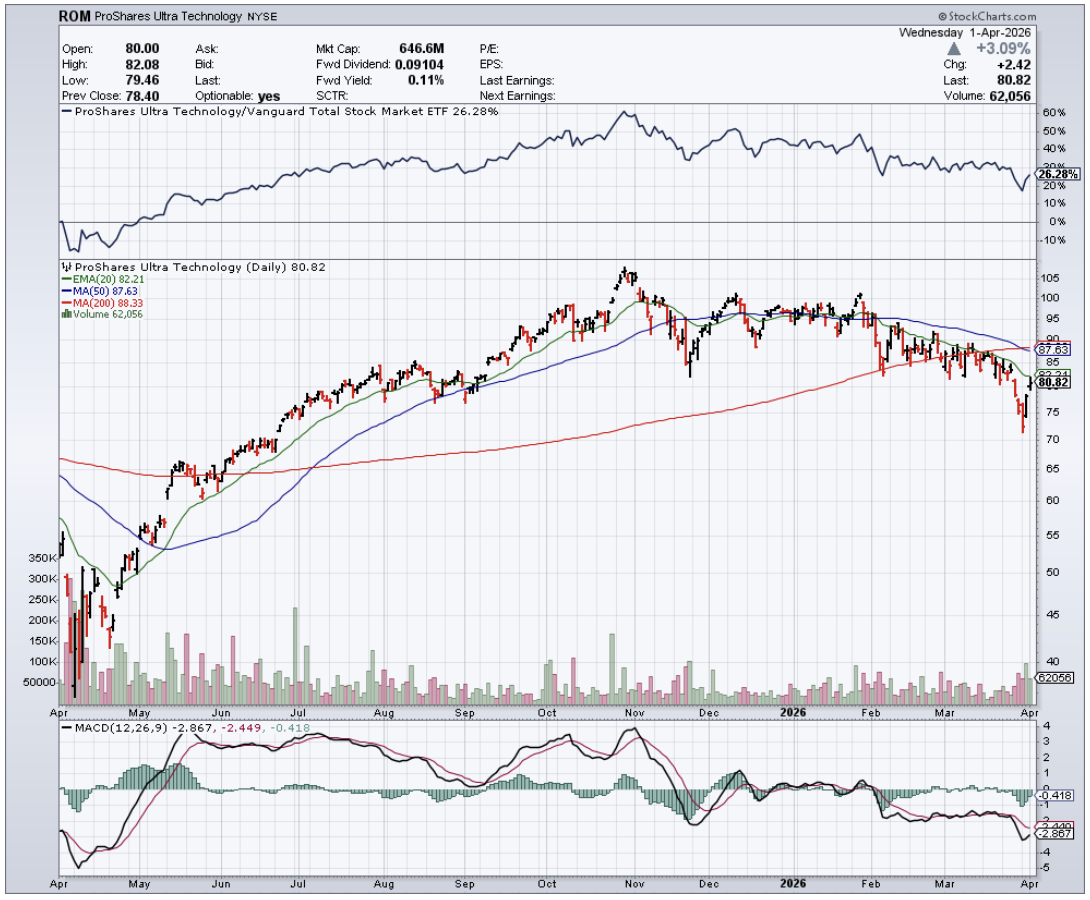
(ROM) – ProShares Ultra Technology 2X Fund – Gives you a double exposure to what will be the top-performing sector of the market for the next six months, and probably the rest of your life. Click here for details and the largest holdings.
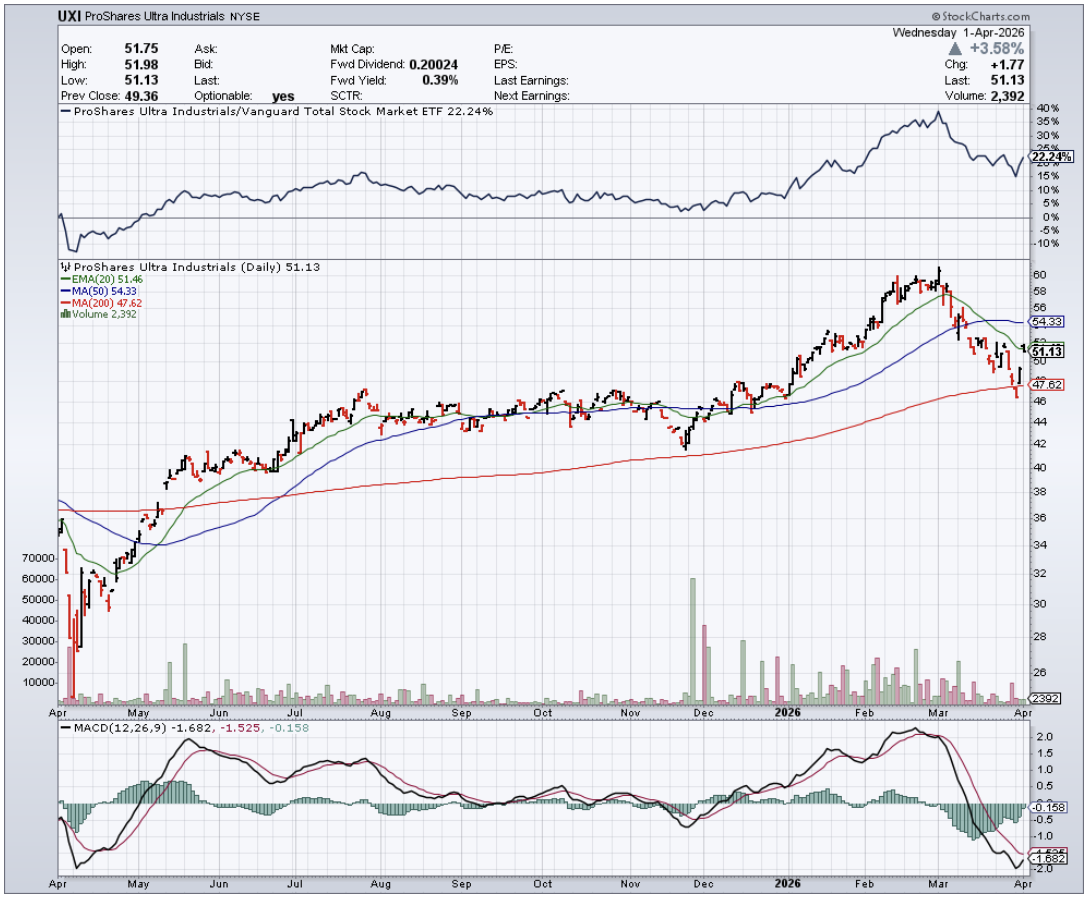
(UXI) – ProShares Ultra Industrial Fund 2X – Is finally rebounding off the back of a dollar that will slow down its ascent once the first interest rate hike is behind us. Onshoring and incredibly cheap valuations are other big tailwinds here. For details and the largest holdings, click here.
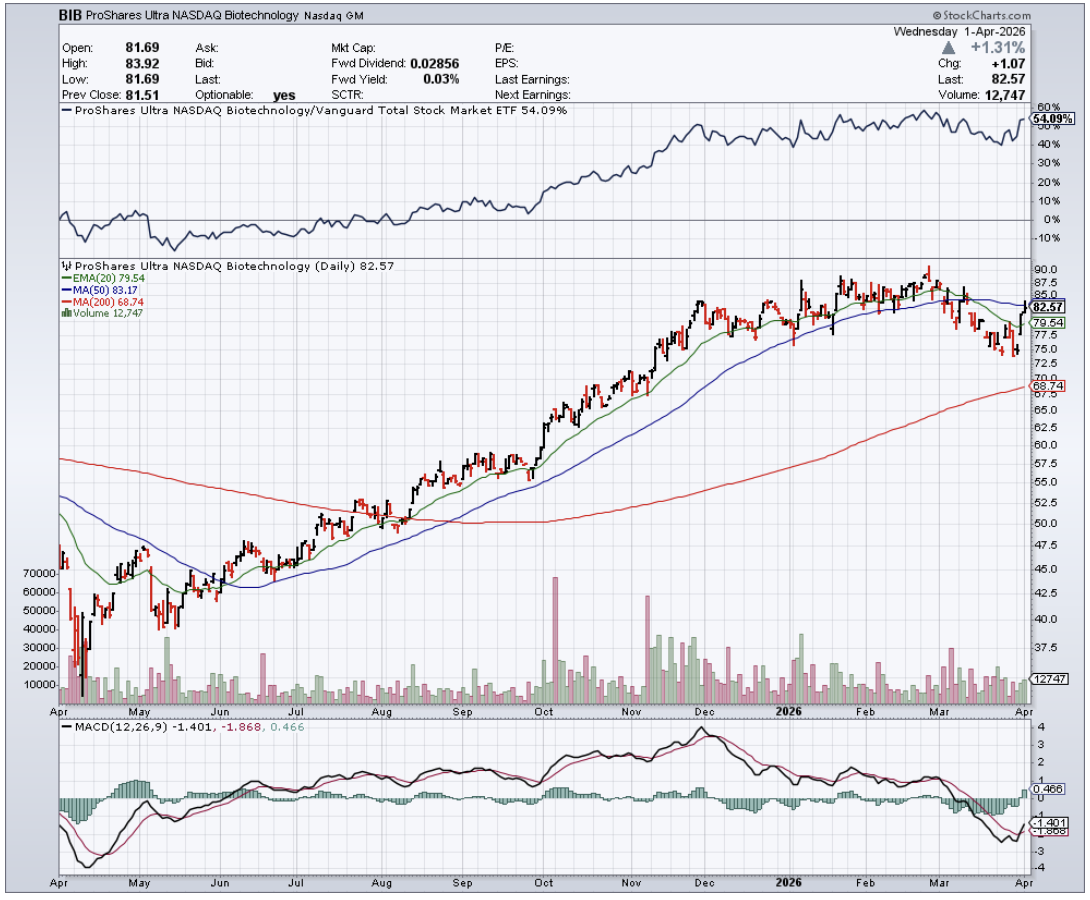
(BIB) – ProShares Ultra NASDAQ Biotechnology 2X Fund – With technology, this will be the other hyper-growth sector in the stock market for the next 20 years. How much is a cancer cure worth to stock valuations? Oh, about $2 trillion. A basket approach favors this notoriously volatile sector by rotating in new winners to replace losers.
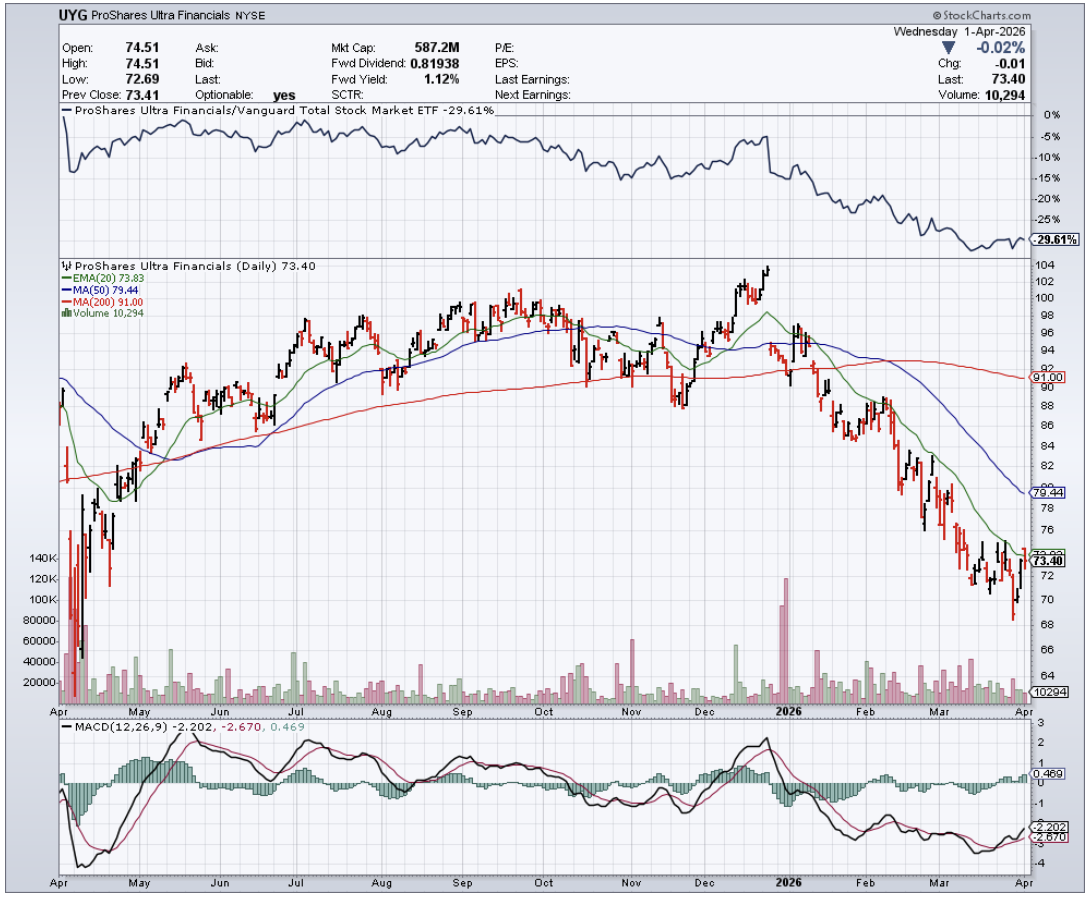
(UYG) – ProShares Ultra Financials 2X Fund – Yes, after six years of false starts, interest rates are finally going up, with a December rate hike by the Fed a certainty. My friend, Janet, is handing out her Christmas presents early this year. This instantly feeds into wider profit margins for financials of every stripe. For details and the largest holdings, click here.
Of course, you’ll need to keep reading my letter to confirm that the financial markets are proceeding according to the script. We all know that sectors can rotate rapidly, as they have just done.
You will also have to read the Trade Alerts, as we include a ton of deep research in the Updates.
You can then unload your quasi-trading book with hefty profits in the spring, just when markets are peaking out. “Sell in May and Go Away?” I bet it works better than ever in 2024.

“Half the world’s job will be wiped out over the next 30 years, and the middle class will be completely wiped out,” said technology guru Mosh Varde.

In 1720, during the South Sea Bubble, the British Parliament passed the Bubble Act - a law designed to suppress competing speculative schemes so that money would keep flowing into the Crown's favorite vehicle.
It worked brilliantly, right up until the South Sea Company itself collapsed and wiped out half of England's investor class.
The lesson wasn't that speculation is dangerous. The lesson was that the most interesting trade is almost never the one everyone is talking about.
Which brings me to Strategy Inc's (MSTR) capital structure, where the common stock and its STRC preferred are getting all the headlines, and a little-noticed convertible preferred called STRK is quietly offering over 10% tax-deferred yield with a free equity kicker attached, trading at a 25% discount to par.
History has a type.
Let me explain how Strategy's capital stack actually works, because most coverage glosses over the architecture.
MSTR sits at the top for upside and the bottom for risk. It absorbs all dilution and all volatility.
Below it, Strategy has issued a ladder of preferred instruments: STRF at the senior end paying 10% fixed, STRC in the middle paying a variable 11.50%, STRD at the junior end paying 10% but non-cumulative with no conversion feature, and then there's STRK, the 8% Series A convertible perpetual preferred currently trading around $75 against its $100 stated value.
STRK carries a fixed $8 annual dividend on that $100 stated amount. At today's price, that's a current yield north of 10.5%.
More usefully, because Strategy has negative taxable earnings, all preferred distributions are treated as a return of capital rather than ordinary income, meaning you defer the tax until you sell. That's not a minor footnote.
For most US holders, over 10% in tax-deferred cash flow is the kind of thing that usually requires a much longer flight and a considerably more exotic prospectus to find.
The conversion feature adds another dimension entirely. Each STRK share can be converted at the holder's option into 0.1 shares of MSTR common.
With MSTR around $138, the current intrinsic conversion value is roughly $13.82 per STRK share, which means about 18% of what you're buying today is pure equity optionality, and you're getting it at a steep discount because the market has been too busy chasing STRC to notice.
STRC is the instrument Strategy wants to scale, and the recent March filing makes that obvious. Strategy terminated its prior $20.3 billion STRK ATM program, capped the replacement at $2.1 billion, and slashed authorized STRK shares from 269.8 million to 40.27 million.
Simultaneously, it launched a new $21 billion ATM for STRC and dramatically expanded authorized STRC shares.
The issuance overhang that was legitimately suppressing STRK's price has been mostly removed. The market hasn't repriced this yet.
STRC, for all its momentum, is designed to do exactly one thing: trade around $100. The dividend resets monthly to enforce price stability around par.
There's no appreciation potential by design. You accept credit risk with no upside, which is an asymmetric proposition I don't love for a long position.
STRF is cleaner and more senior, but the market has already recognized that; it trades near par with a 10% yield.
STRD yields more on paper but carries no conversion right and sits at the most junior position in the stack.
STRK occupies the only spot in this structure where a credit repricing, a BTC rally, and a steady income stream can all work in your favor simultaneously.
The obvious risk deserves a plain statement. Every instrument in this stack, STRK included, is ultimately downstream from one variable: Bitcoin (BTC).
Strategy's business model is to raise capital and buy BTC, which means BTC needs to outperform the 10%+ cost of that capital, or common shareholders fund the difference.
A prolonged BTC bear market reprices the entire stack.
STRK holders carry a specific additional exposure. Because roughly a fifth of STRK's value derives from MSTR common, a deteriorating common stock erodes STRK more than it does STRF or STRC. Eyes open.
But for those who are constructive on Bitcoin, STRK is a fixed-income preferred trading at a 25% discount to par, yielding over 10.5% on a tax-deferred basis, with the only conversion right in the entire preferred stack. The crowd is in the penthouse bidding up STRC. The mezzanine floor is still on sale.
Parliament would have passed a law against it by now.