The stock markets are on the verge of a small correction, perhaps less than 5%, which should unfold over the next six weeks.
There is just not enough juice in a mini crisis triggered by one lousy Portuguese bank, the Banco Espiritu Santo, to take us any further. Bonds globally should put in their highs for the year during this period.
After that, it will be off to the races with a major year-end rally that could take us up another 10%. Both old tech and new tech, plus biotech and social media will be the front runners in this next leg of the bull market. Fixed income products will suffer across the board.
These were the results of the exhaustive research Jim undertakes every quarter using his proprietary analytical system. His goal is to define the best long and short opportunities across all asset classes.
Ignore him at your peril. Last year Jim?s system delivered a gob smacking trading return of over 300%.
Jim, a 40-year veteran of the trading pits in Chicago, would tell you all this himself. But as he is a product of the Windy City?s lamentable school district, the task of translating his pivot points, swing counts, and support and resistance levels into simple ?BUYS? and ?SELLS? falls to me.
What else can I say?
By the way, a pivot point is a number Jim?s system serves up once a quarter dictating the tone of the market for individual securities. Trade above the pivot, and we are in ?RISK ON? mode. Trade below it, and we need to take a decidedly ?RISK OFF? posture.
Swing counts then project the distance a security should travel once the directional call has been determined. Think of it as your own private inertial navigation system for your trading approach.
Equities
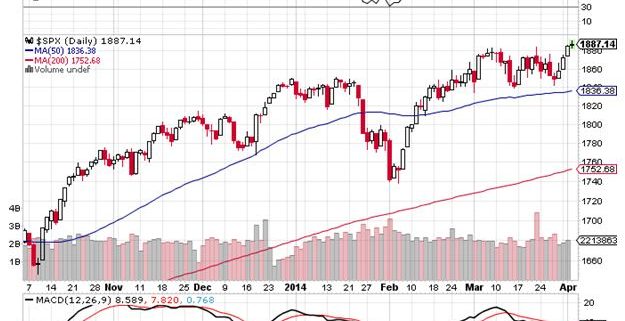
With that said, Jim?s pivot for the S&P 500 for Q3 is 1,970. As we are well below that now, you can expect some further work to be done on the downside, possibly as low at the 1,875-1,895 range over the next six weeks.?That would then be a sweet spot to initiate new longs.
The NASDAQ 100 has a pivot of 3,811 for Q3, a few percent above here. Jump back into the technology arena with a tight stop in the 3,700-3,725 neighborhood, or down some 5%, which works out to around $90 for ETF (QQQ) players.
Among foreign markets, Jim likes Japan?s Nikkei (DXJ), is wary of the German DAX, and is neutral on Australia (EWA).
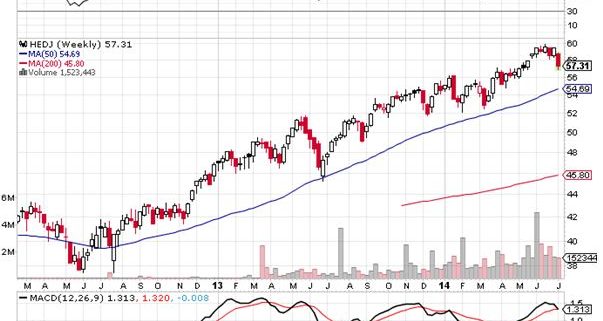
Point a gun to his head, and Jim will opt for the Wisdom Tree Europe Hedged Equity Fund (HEDJ), a customized long European equity/short Euro ETF that effectively prices these stocks in US dollars. Think of it as a (DXJ) with a French accent.
?Bonds
Jim sees a rare, generational opportunity, to sell bonds setting up for August. They could grind up until then off the back of today?s news from Europe, but not by much. Use $137.00 as the pivot point for the 30-year bonds futures.
The market?s Focus will remain on the SPX/Bond spread, as it has all year. When the Equity Indices go into profit taking mode, bonds are the only place to park money, taking prices northward.
Long term, he favors the short side of the bond market, when conditions allow.?His game plan remains to sell bonds at these levels, with tight stops, until proven wrong.
My own strategy of buying out of the money (TLT) put spreads on a monthly basis also works perfectly in this scenario. Use every three-point rally as an opportunity to get in.
We are on the threshold of a more normalized interest rate environment, with a long awaited reversion to the mean in rates imminent. Jim says that the entire bond world is about to roll over.
Foreign Currencies
Jim isn?t getting too excited about foreign currencies these days, which appear to have fallen into a bottomless volatility trap. He doesn?t see any big moves unless a serious risk off trend develops in the equity markets, which is unlikely.
Use the Australian dollar (FXA) as your lead currency with which to make directional calls for the entire asset class. The pivot there is $94.60 in the cash market. As we are now at $93.68, stand aside.
The Japanese yen (FXY) has done its best impression of a Kansas horizon this year of any financial asset. It will continue to flat line as long as the jury is out on Prime Minister Shinzo Abe?s ?third arrow? economic and reform strategy. The yen will eventually weaken against the greenback, but it could be a long wait. Until then, use 101.33 as a pivot.
If you have to hate a currency in 2014, make it the Euro (FXE), with a pivot of $139.50. Sell every rally against this figure until the cows come home. The fundamentals for a weaker continental currency are building by the day. But we won?t see real fireworks until we close below $135.50. Then we?ll be targeting $127.50.
Commodities
Jim likes the precious metals (GLD), (SLV) and thinks the recent bottom will last for some time. This is further confirmed by the miners (GDX), which appear to have staged a major turnaround.
Bond market rallies have been highly correlated to metals rallies this year, at least for over the short term. So follow the sparkly stuff along with a bond rally into August. Lower rates will be price positive the metals. Use $1,265-$1,275 as your pivot for gold going forward. For silver use $19.70.
Copper (CU) is a bit of a conundrum, as it is stuck, in the middle of one-year range, so don?t chase recent rally. Use $2.95 as the pivot there. It?s not going anywhere until China decides what to do with its economy.
Don?t buy into the upside breakout school of thought for oil (USO) until we close over 104.70-105.30 (last qtr's high). That?s where you can count on the buy stops to kick in. At the current $102, we are firmly in bear territory. Talk to Jim when oil breaks this quarter?s resistance and upside momentum level at 107.50.
Infrastructures plays are still the best way to participate in any move in the natural gas (UNG) market. At the top of the list is Mad Hedge Fund Trader long time favorite, Cheniere Energy (LNG), up from $6 to $74.??(LNG) should be on your shopping list on any big equity index sell-off.?This week may see a low, and then a substantial rally when July futures expire.
The Ags
Agricultural commodities (CORN), (SOYB), (WEAT), (DBA) have been the major disaster area of 2014, thanks to the best growing conditions in history. Not only has the weather been perfect, the US Department of Agriculture keeps ?finding? new stockpiles. Conditions have been improving in major export markets abroad, as well.
Farmers may get a break this week when multiple futures contracts expire. At the very least, we should get a dead cat bounce. After that, it?s up to Mother Nature.
By the way, Jim Parker?s Mad Day Trader service has attracted a substantial following over the past year. If you are not already getting Jim?s dynamite short term ?BUY? and ?SELL? calls, please get yourself the unfair advantage you deserve.
Just email Nancy in customer support at support@madhedgefundtrader.com and ask for the $1,500 a year upgrade from your existing Global Trading Dispatch service to Mad Hedge Fund Trader PRO. The service includes Jim?s timely Trade Alerts, a running daily market commentary, and the daily morning webinar, The Opening Bell with Jim Parker.