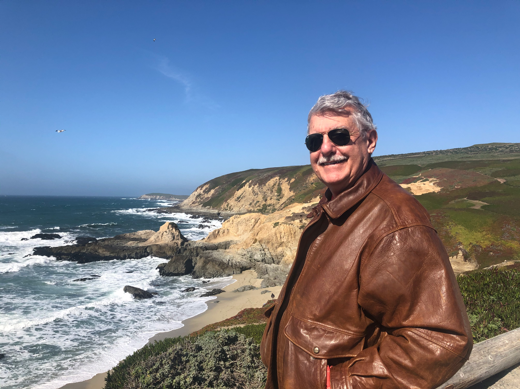
I just drove from Carmel, California to San Francisco on scenic Highway 1. I was virtually the only one on the road.
The parking lot at Sam’s Chowder House was empty for the first time in its history. The Pie Ranch had a big sign in front saying “Shut”. The Roadhouse saw lights out. It was like the end of the world.
The panic is on.
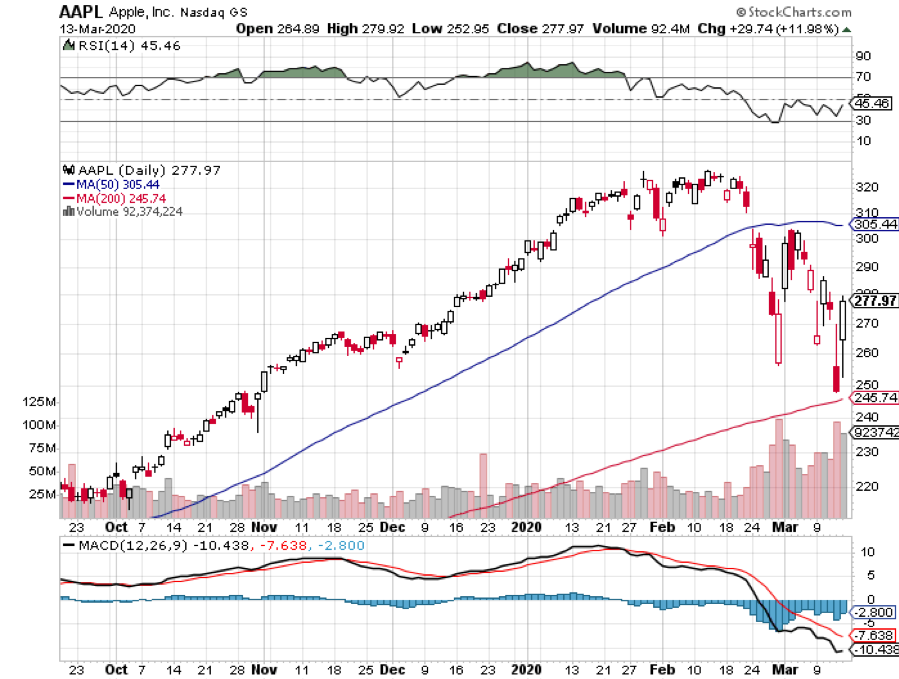
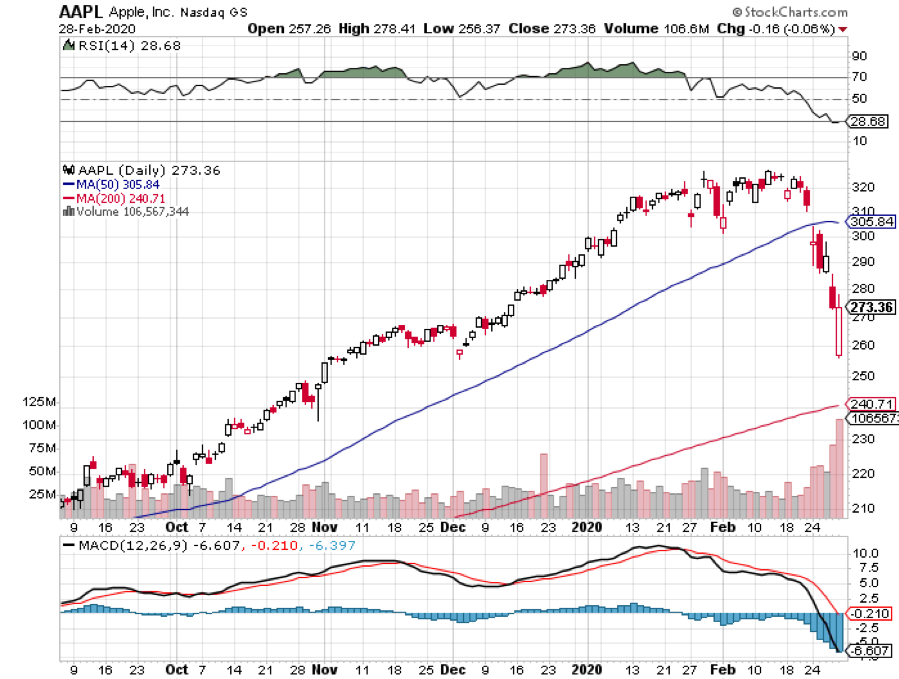
The economy has ground to a juddering halt. Most US schools are closed, sports activities banned, and travel of any kind cancelled. All ski resorts in the US are shut down as are all restaurants, bars, and clubs in California. Virtually all public events of any kind have been barred for the next two months. Apple (AAPL) and Nike (NIKE) have closed all their US stores.
The moment I returned from my trip, I learned that the Federal Reserve has cut interest rates by a mind-boggling 1.00% on the heels of last week’s 0.50% haircut. This is unprecedented in history. S&P Futures responded immediately by going limit down for the third time in a week.
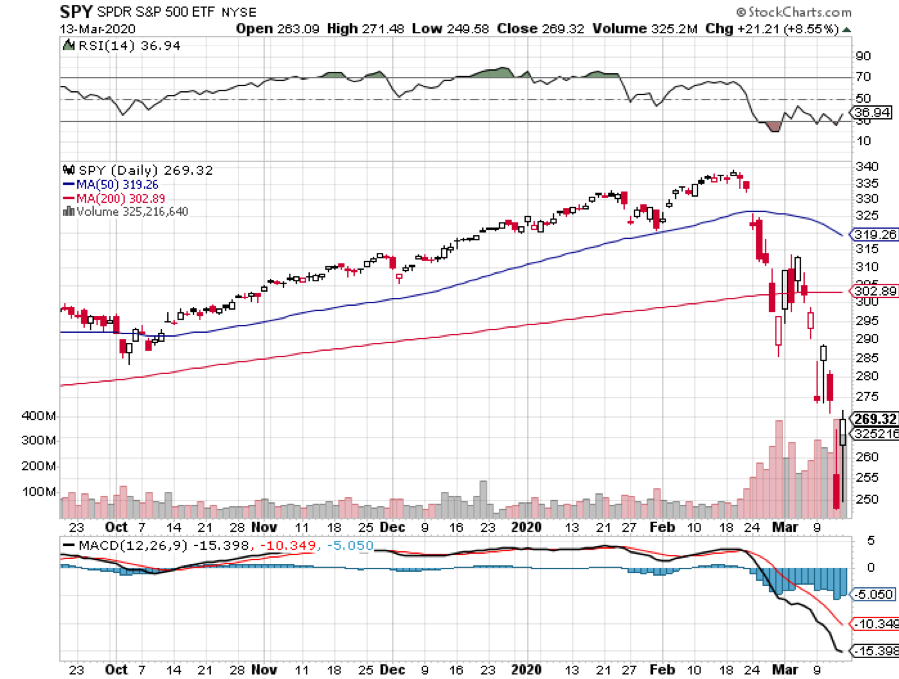
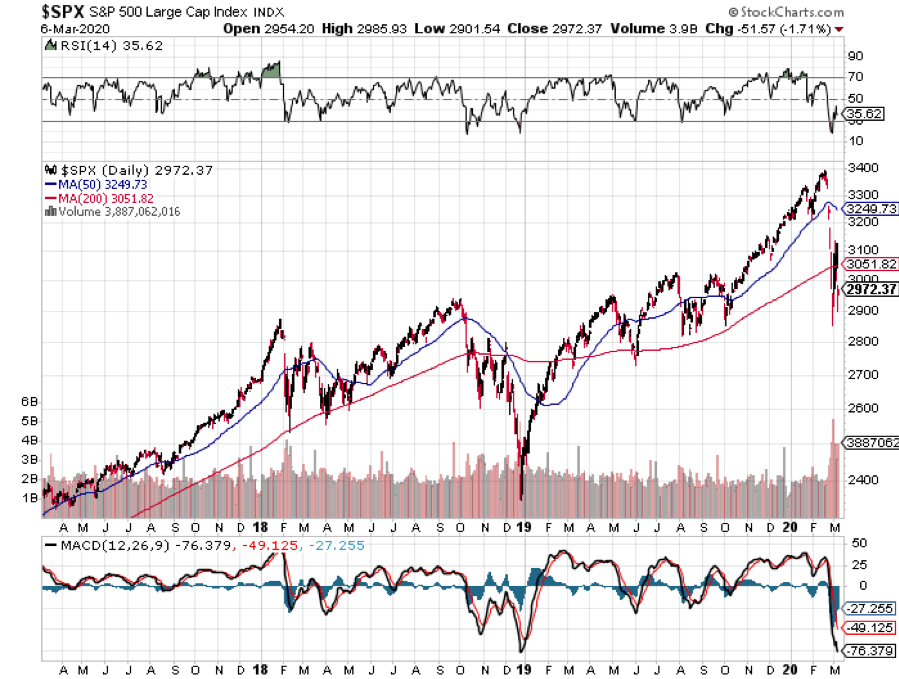
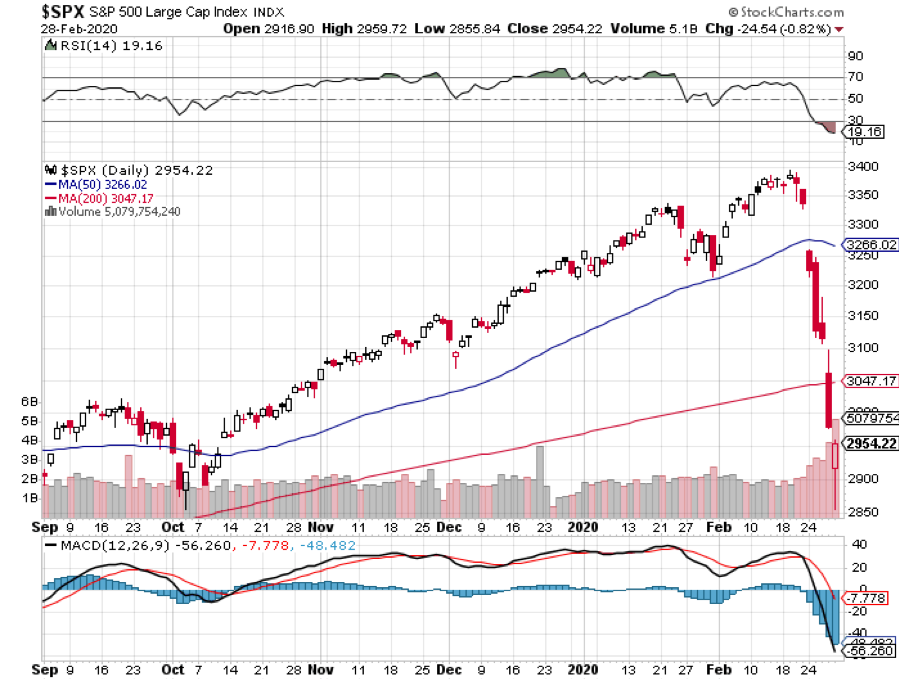
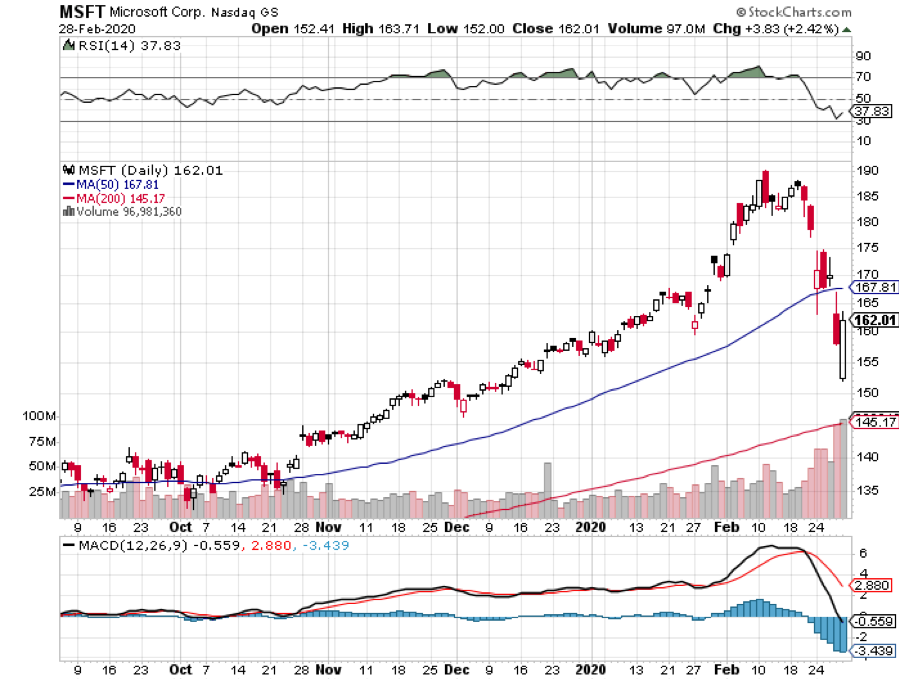
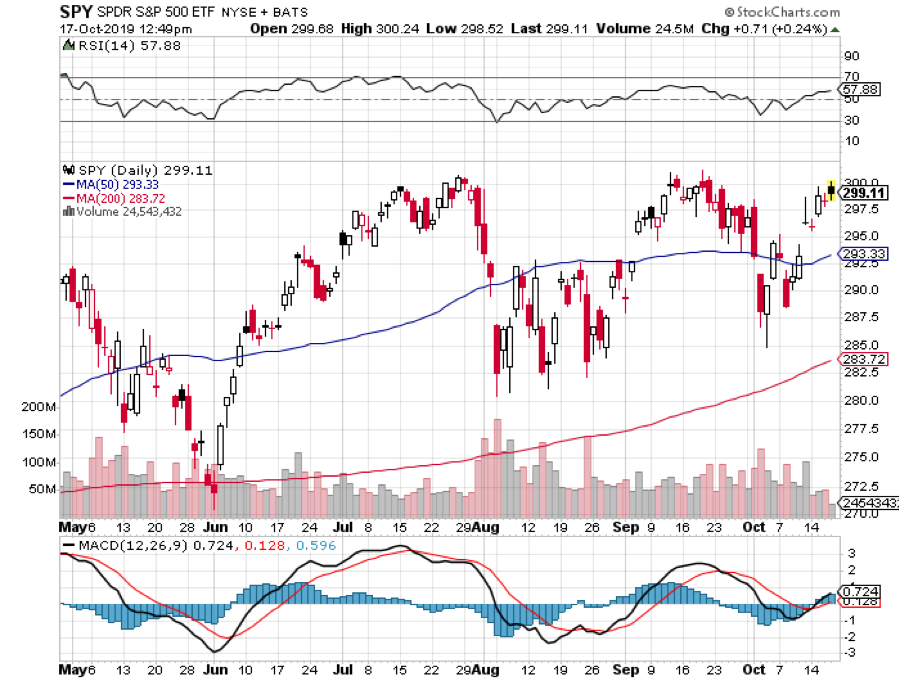
The most pessimistic worst-case scenario I outlined a week ago came true in days. The (SPX) is now trading at 2,500. Goldman Sachs just put out a downside target at 2,000, off 41% in three weeks.
That takes the market multiple down from 20X three weeks ago to 14X, and the 2020 earnings forecast to crater from $165 to $143. These are numbers considered unimaginable only a week ago.
You can blame it all on the Coronavirus. Global cases shot above 160,000 yesterday, while deaths exceeded 5,800. In the US, we are above 3,000 cases with 60 deaths. The pandemic is growing by at least 10% a day. All international borders are effectively closed.
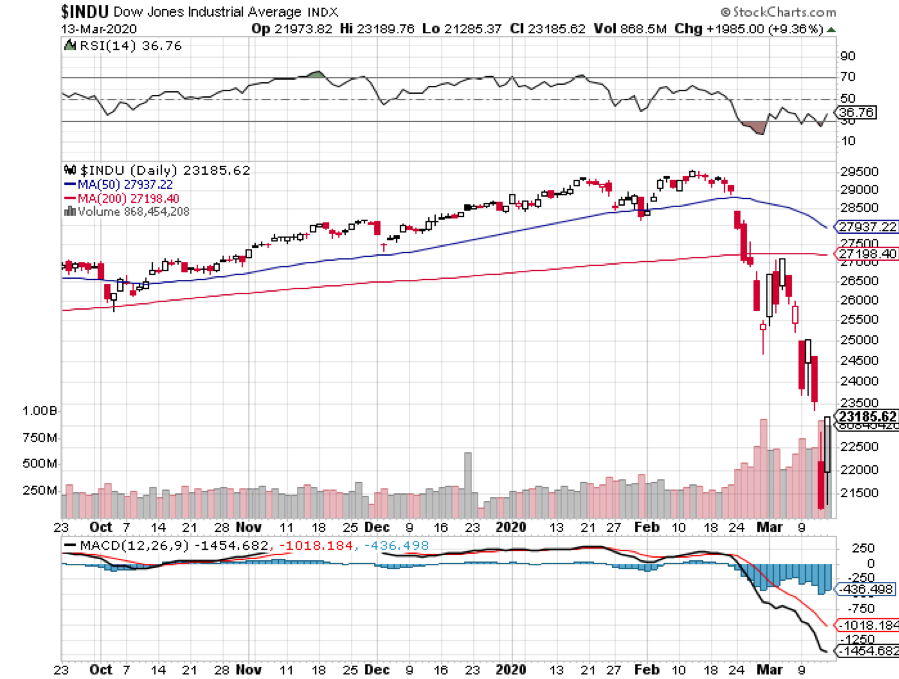
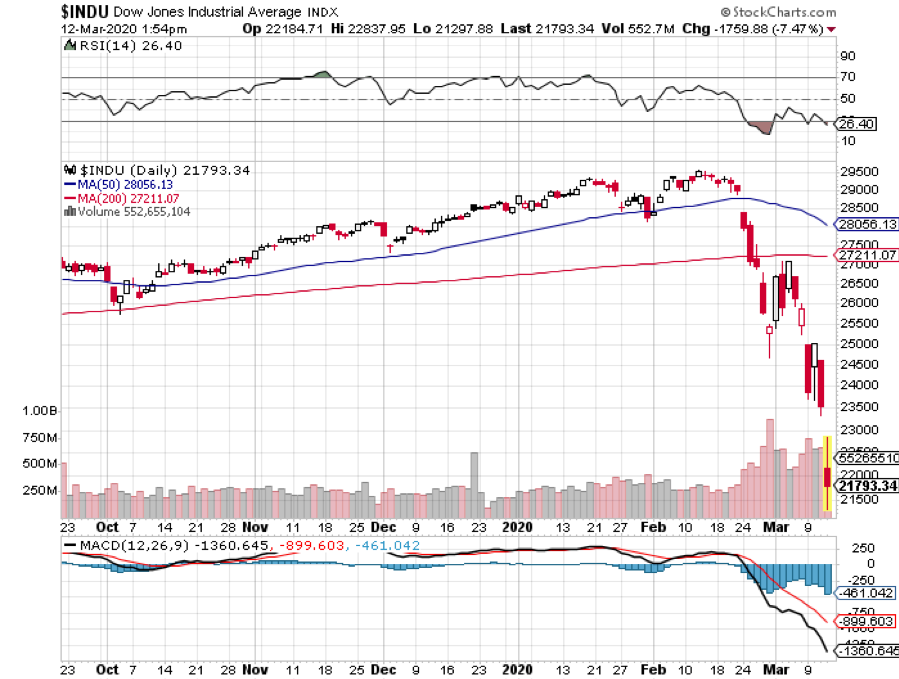
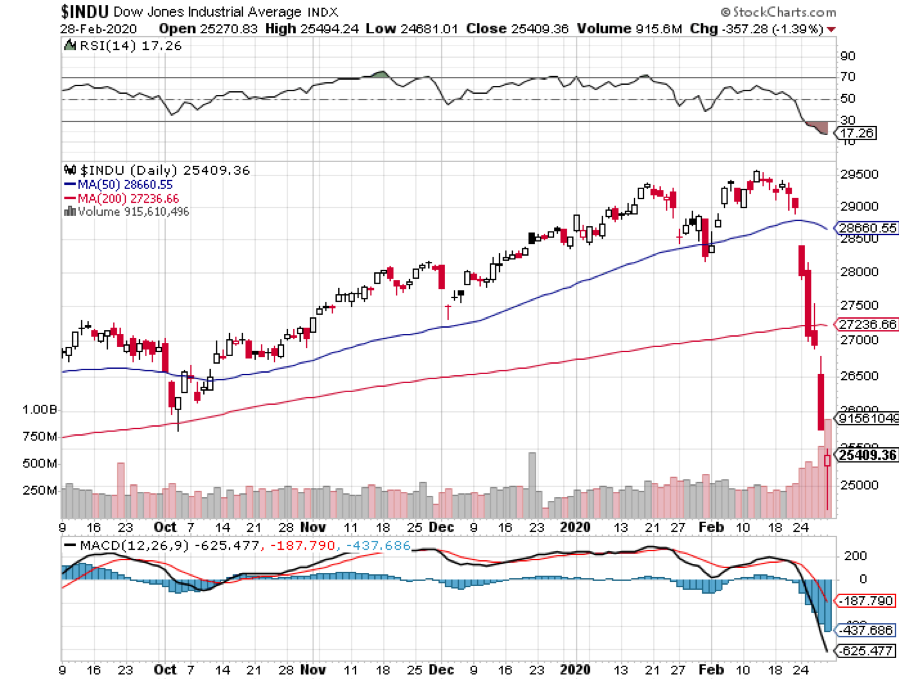
The stock market has effectively impeached Donald Trump, unwinding all stock market gains since his election. At the Thursday lows, the Dow Average ticked below 20,000, less than when he was elected. Economic growth may be about to do the same, wiping out the 7% in economic growth that has taken place during the same time.
Leadership from the top has gone missing in action. The president has told us that the pandemic “amounts to nothing”, is “no big deal”, and a Democratic “hoax.” There is no Fed effort to build a website to operate as a central clearing house for Corona information. In the meantime, the number of American deaths has been doubling every three days.
There have only been 13,500 tests completed in the US so far and they are completely unavailable in my area. The bold action to stem the virus has come from governors of the states of all political parties.
The good news is that all this extreme action will work. If you shut down the economy growth, the virus will do the same. In two weeks, all carriers will become obvious. Then you simply quarantine them. Any dilution of the self-quarantine strategy simply stitches out the process and the market decline.
The hope now is that the recession, which we certainly are now in, will be sharp but short. “An ounce of prevention is worth a pound of cure” is certainly in control now.
When we come out the other side of this, we will be perfectly poised to launch into my new American Golden Age, or the next Roaring Twenties. With interest rates at zero, oil at $25 a barrel, and many stocks down by half, there will be no reason not to.
Oil (USO) crashed, taking Texas tea down an incredible $22 overnight. OPEC collapsed as Saudi Arabia took on Russia in a price war, flooding the market. All American fracking companies with substantial debt have just been rendered worthless. I told you to stay away from MLPs! It’s amazing to see how the effect of one million new electric cars can have on the oil market. Blame it all on Elon Musk.
The oil crash is all about the US. American fracking has added 4 million barrels a day of supply over the last five years and 8 million b/d during the last ten. Saudi Arabia and Russia would love to wipe out the entire US industry.
Even if they do, the private equity boys are lining up to buy assets at ten cents on the dollar and bring in a new generation of equity investors. The wells may not even stop pumping. How do you say “Creative Destruction” in Arabic and Russian? We do it better than anyone else.
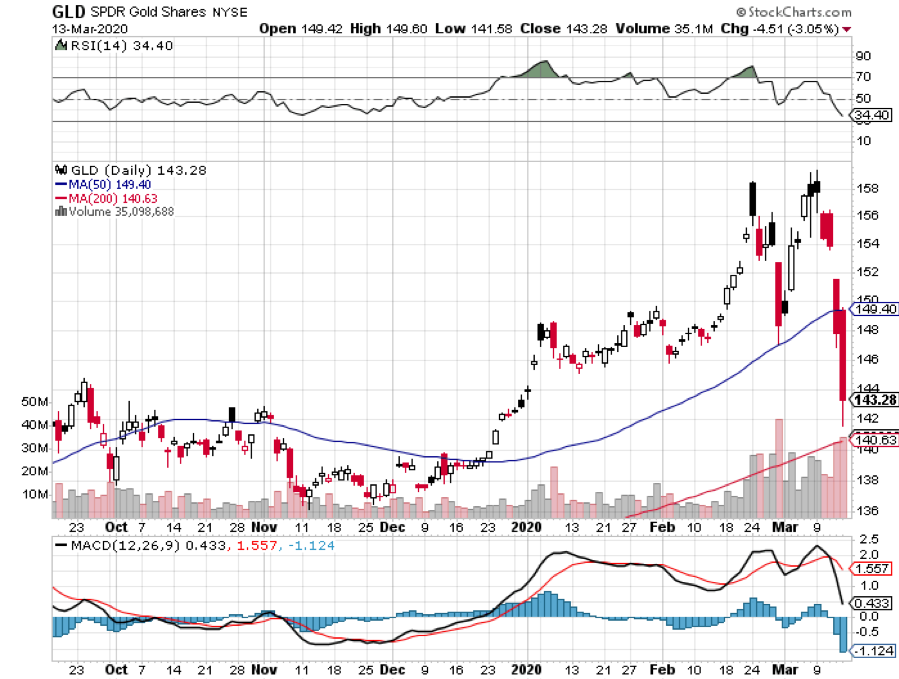
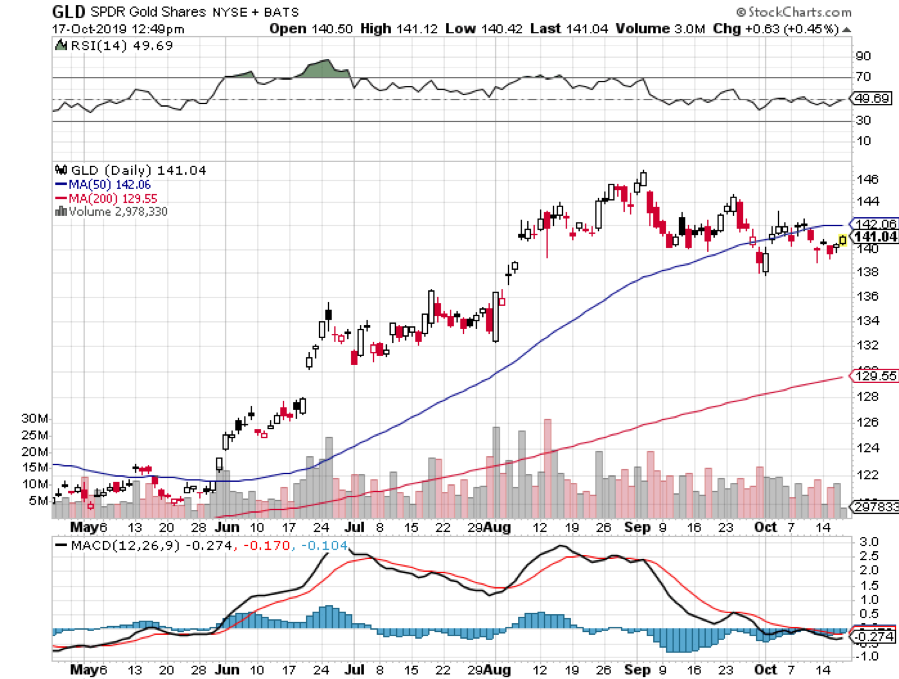
Gold (GLD) soared above $1,700, on a massive flight to safety bid bringing the old $1,927 high within easy reach.
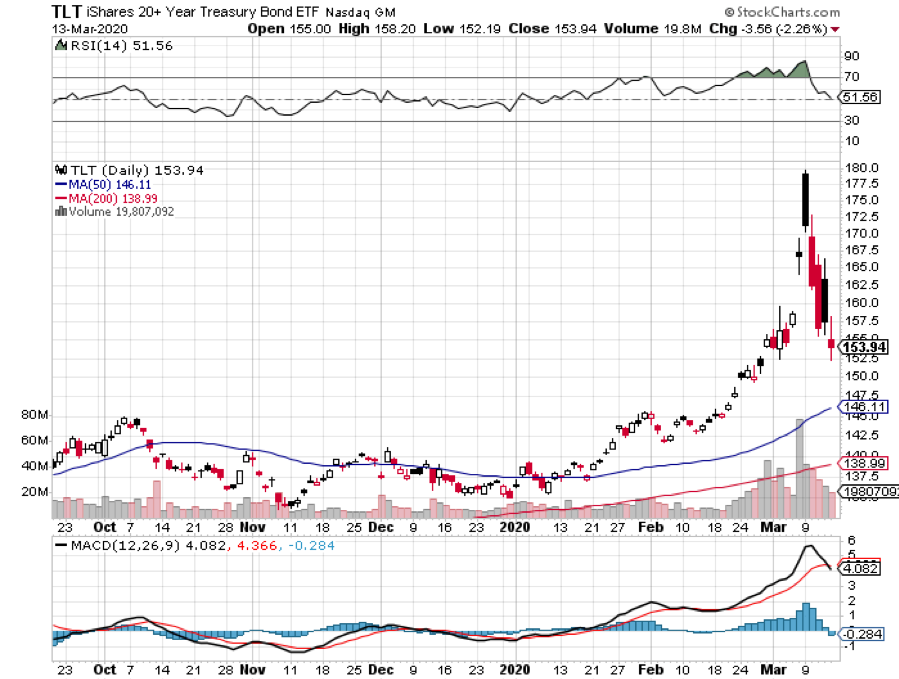
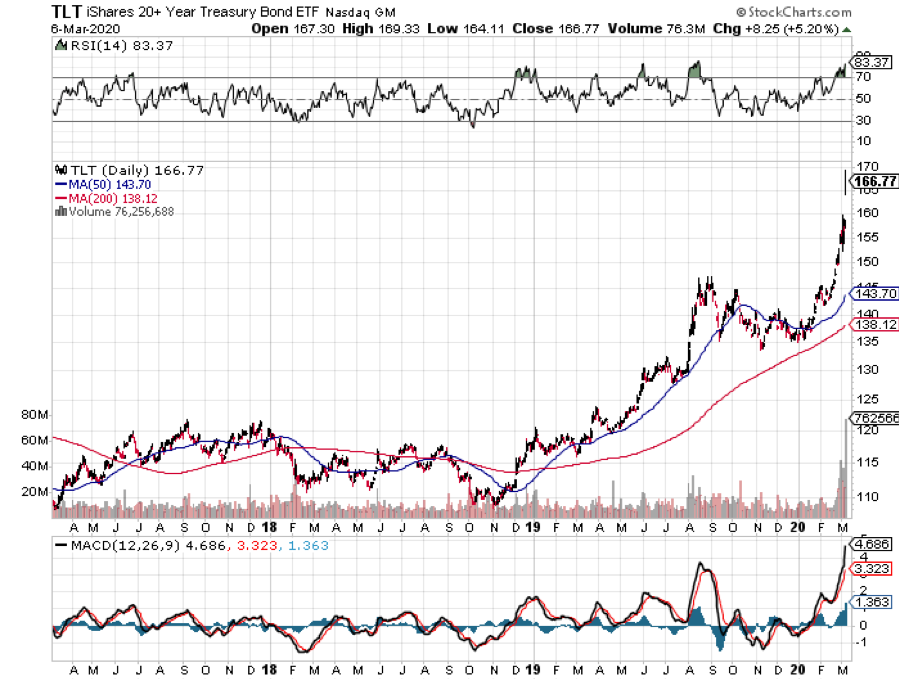
Bond yields (TLT) plunged to 0.31% as recession fears exploded. Looks like we are headed to 0% interest rates in this cycle. Corona cases top 4,000 in the US and fatalities are rising sharply. Malls, parking lots, and restaurants are all empty.
Trump triggered a market crash, with a totally nonsensical Corona plan. Banning foreigners from the US will NOT stop the epidemic but WILL cause an instant recession, which the stock market is now hurriedly discounting. This is an American virus now, not a foreign one or a Chinese one. The market has totally lost faith in the president, who did everything he could to duck responsibility. The US is short 100,000 ICU beds to deal with the coming surge in cases. No one has any test kits at the local level. We could already have 1 million cases and not know it.
The US could lose two million people, according to forecasts by some scientists. At 100 million cases with a 5% fatality rate, get you there in three months. That could cause this bear market to take a 50% hit. The US is now following the Italian model, doing too little too late, where bodies are piling up at hospitals faster than they can be buried.
Stocks are back to their January 2017 lows, down 1,000 (SPX) points and 9,500 Dow points (INDU) in three weeks. Yikes! Unfortunately, I lived long enough to see this. We’ve seen 14 consecutive days of 1,000-point moves. The speed of the decline is unprecedented in financial history.
The Recession is on. Look for a short, sharp recession of only two quarters. JP Morgan is calling for a 2% GDP loss in Q2 and a 3% hit in Q3. The good news is that the stock market has already almost fully discounted this. The only way to beat Corona is to close down the economy for weeks.
A two-week national holiday is being discussed, or the grounding of all US commercial aircraft. Warren Buffet has cancelled Berkshire Hathaway’s legendary annual meeting. All San Francisco schools are closed, events and meetings cancelled. The acceleration to the new online-only economy is happening at light speed.
Municipal bonds crashed, down ten points in three days to a one-year low. If you thought that you parked your money in a safe place, think again. Municipalities are seeing tax and fee incomes collapse in the face of the Coronavirus. Brokers are in panic dumping inventories to meet margin calls. There is truly no place to hide in this crisis but cash, which is ALWAYS the best hedge. I would start buying (MUB) around here.
Bitcoin collapsed 50% in two days, to an eye-popping $4,000. So much for the protective value of crypto currencies. I told you to stay away. No Fed help here.
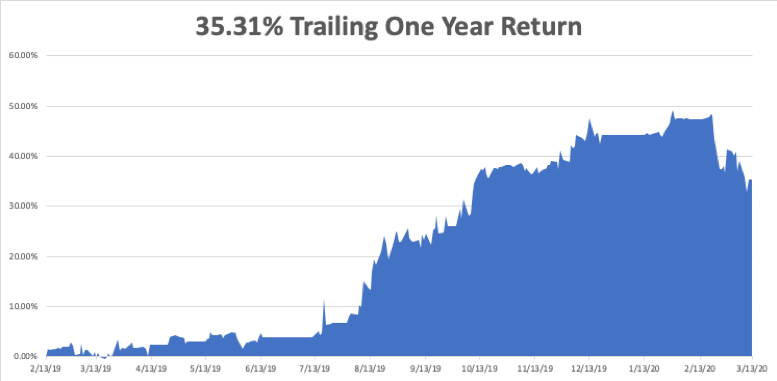
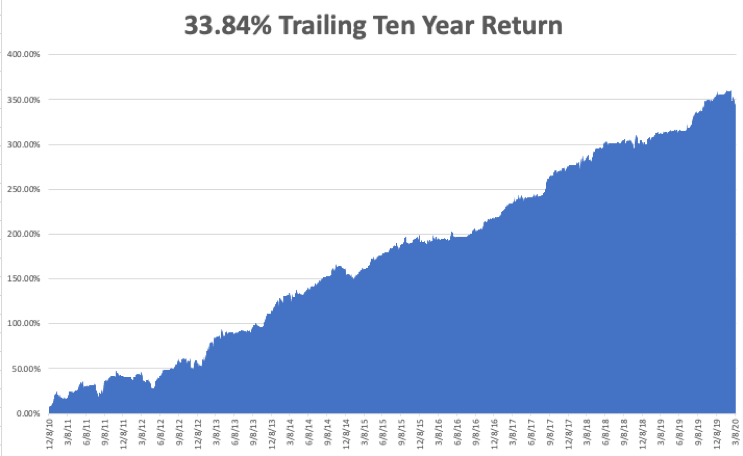
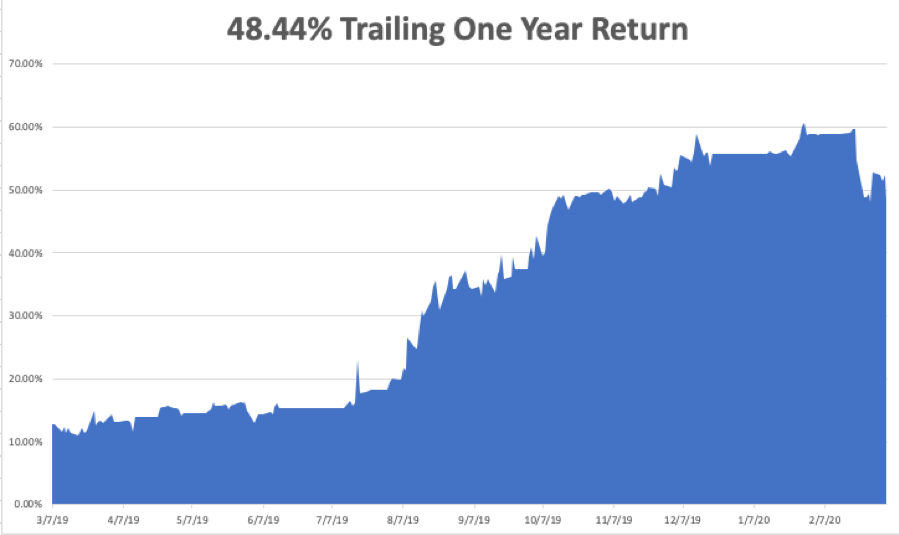
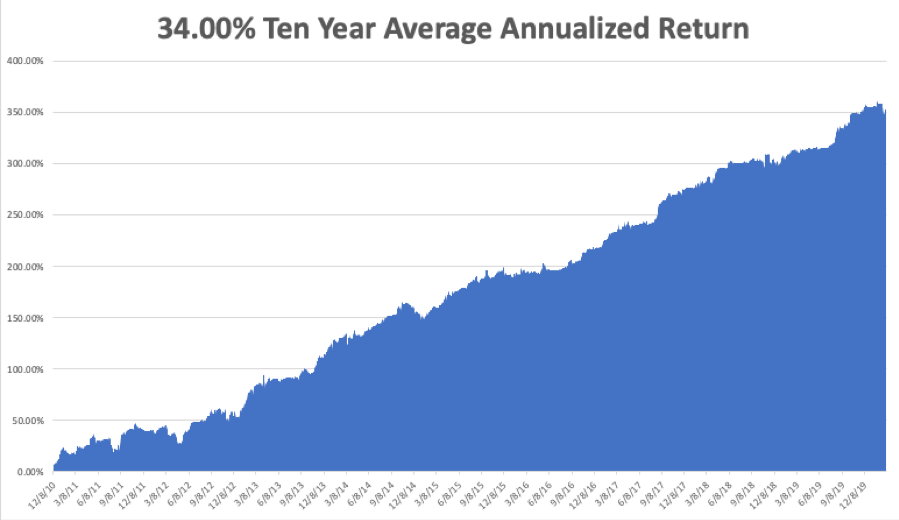
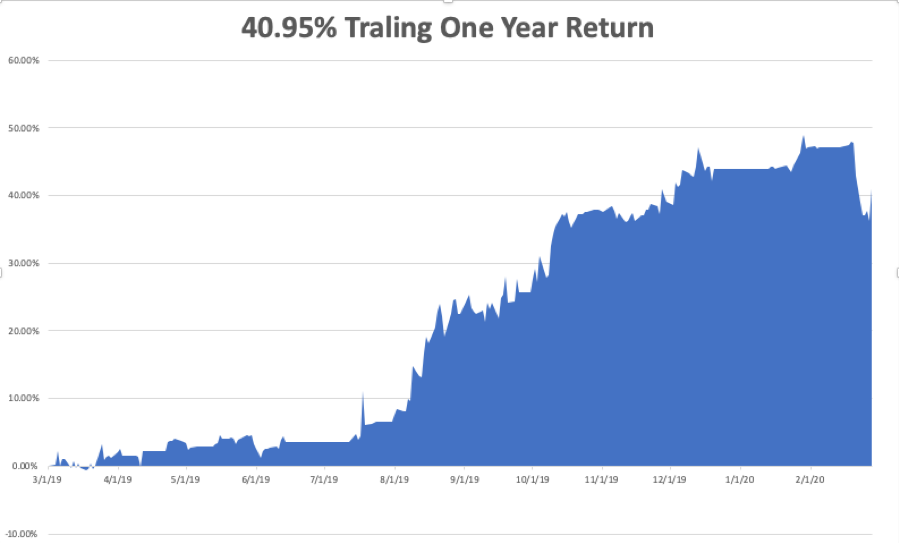
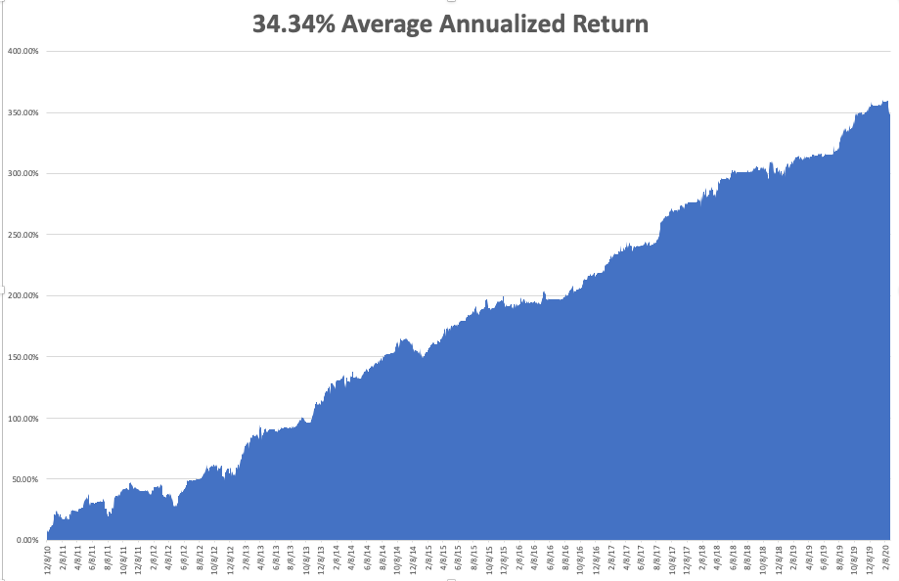
My Global Trading Dispatch performance has gone through a meat grinder, pulling back by -10.36% in March, taking my 2020 YTD return down to -13.28%. That compares to an incredible loss for the Dow Average of -32% at the Friday low. My trailing one-year return was pared back to 35.31%. My ten-year average annualized profit shrank to +33.84%.
I have been fighting a battle for the ages on a daily basis to limit my losses. My goal here is to make it back big time when the market comes roaring back in the second half.
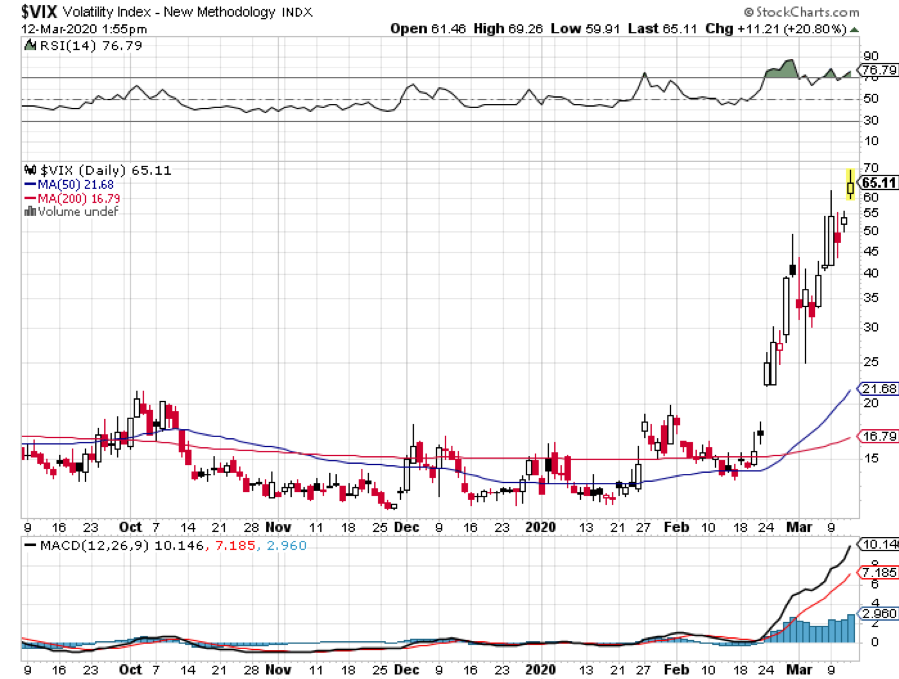
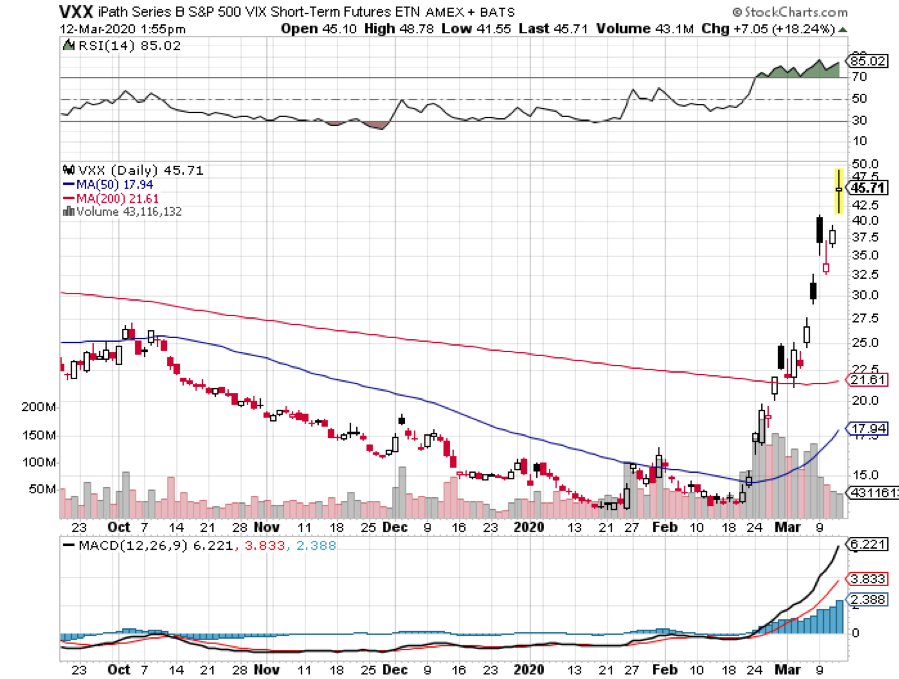
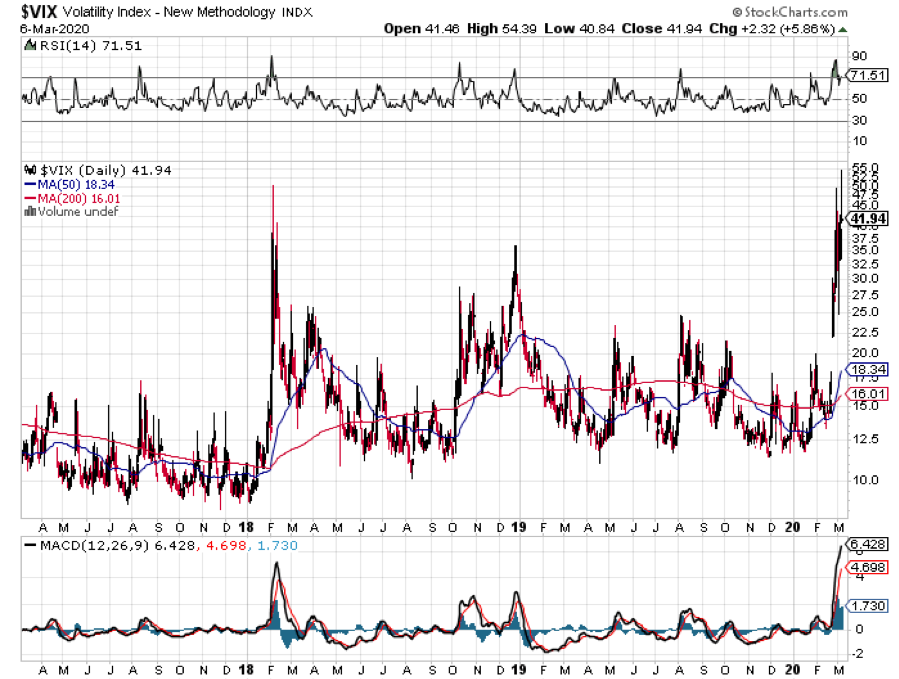
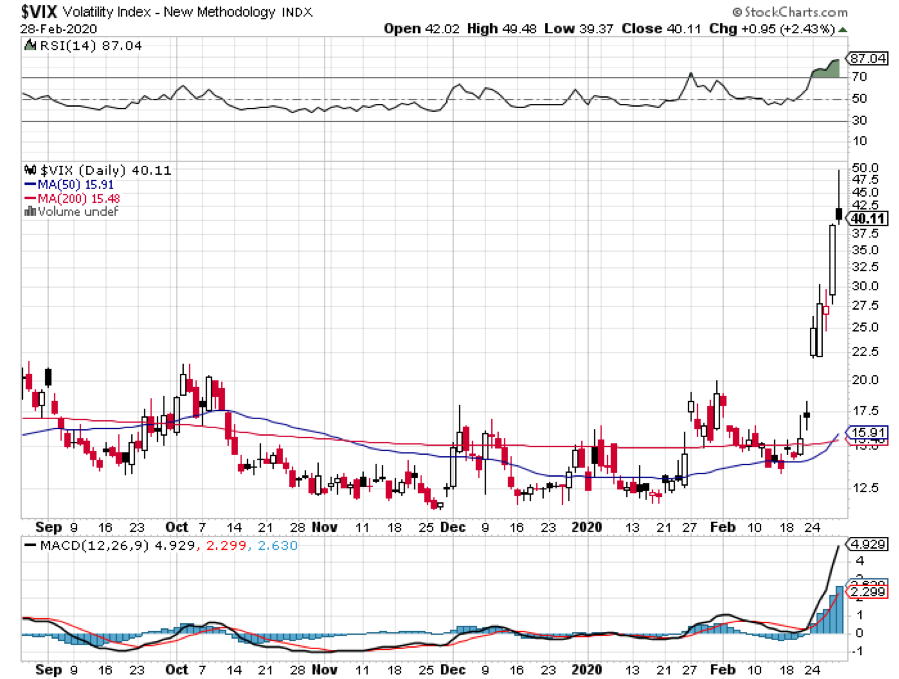
My short volatility positions have been hammering me. I shorted the (VXX) when the Volatility Index (VIX) was at $35. It then went to an unbelievable $76. I was saved by only trading in very long maturity, very deep out-of-the-money (VXX) put options where time value will maintain a lot of their value. These will all come good well before their one-year expiration.
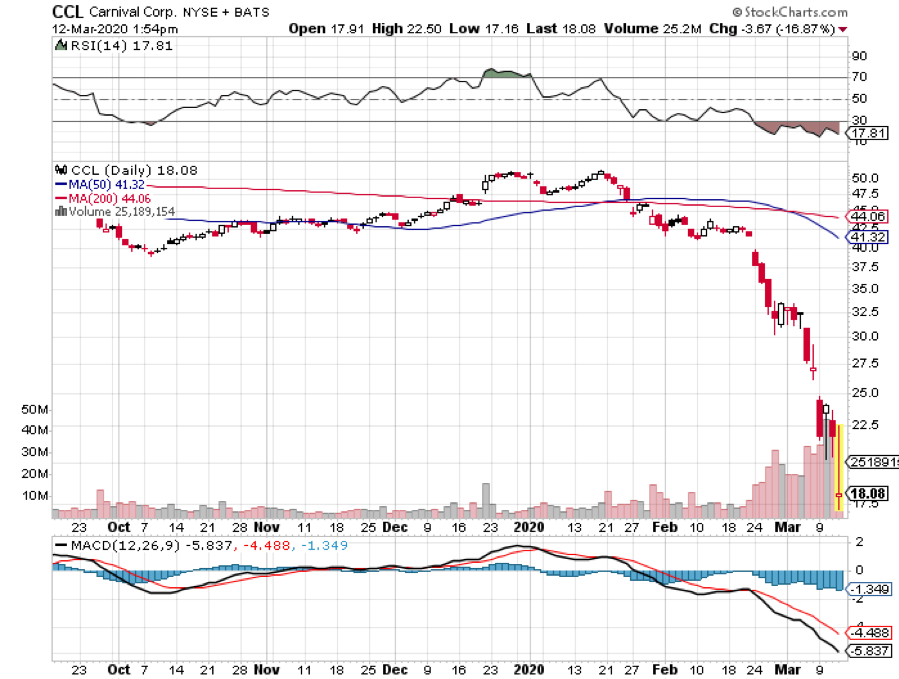
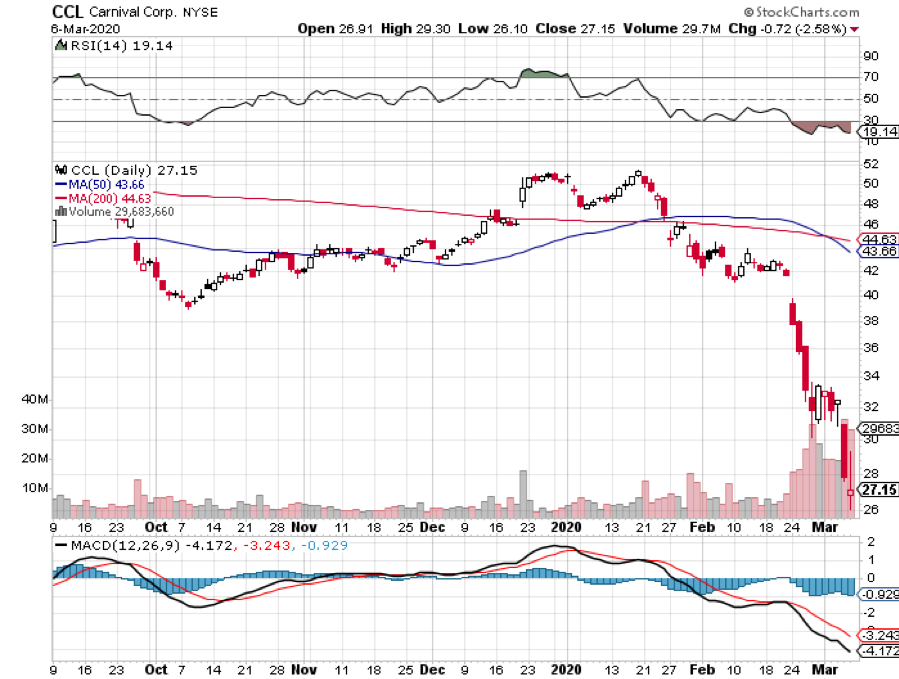
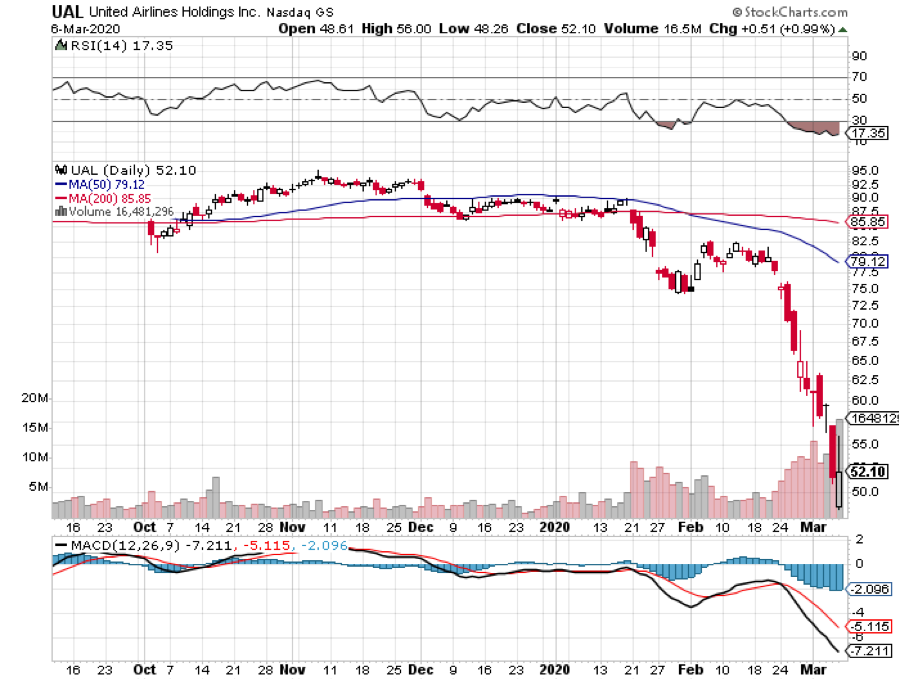
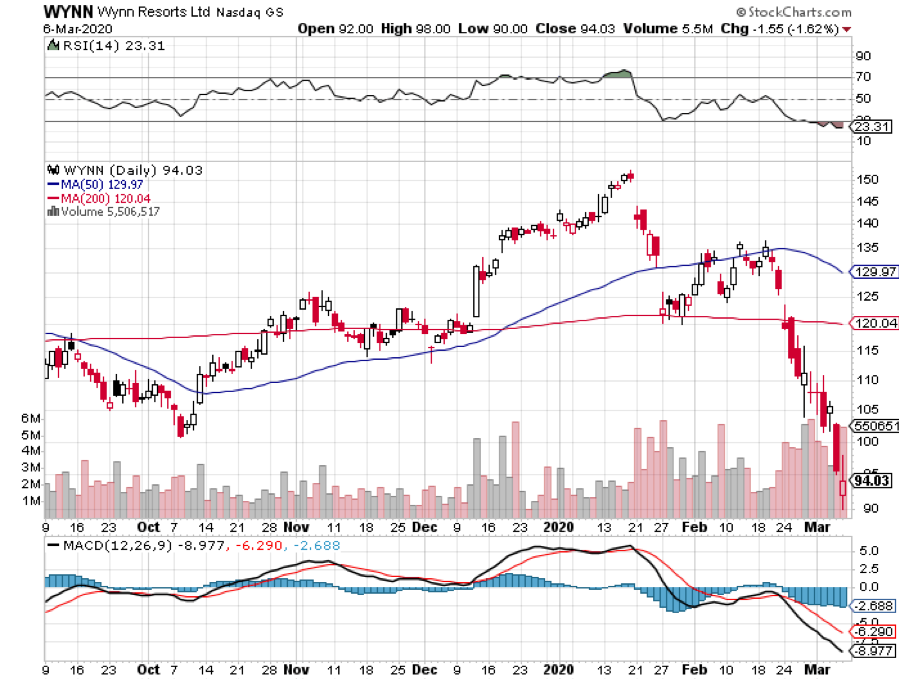
I also took profits in four short position at the market lows in Apple (AAPL) and the three short positions in Corona-related stocks, (CCL), (WYNN), and (UAL), which cratered, picking up an 8% profit there.
At the slightest sign of a break in the pandemic, the economy and shares should come roaring back. As things stand, I can handle a 3,000 point in the Dow Average from here and still have all of my existing positions expire at their maximum profit point with the Friday options expiration.
On Monday, March 16 at 7:30 AM, the New York Empire State Manufacturing Index is out.
On Tuesday, March 17 at 5:00 AM, the Retail Sales for February is released.
On Wednesday, March 18, at 7:30 AM, the Housing Starts for February is printed.
On Thursday, March 19 at 8:30 AM, Weekly Jobless Claims are announced.
On Friday, March 20 at 9:00 AM, the February Existing Home Sales is published. The Baker Hughes Rig Count follows at 2:00 PM.
As for me, I went down to Carmel, California to hole up in a hotel near the most perfect beach in the state and do some serious writing. This is the city where beachfront homes go for $10 million and up, mostly owned by foreign investors and tech billionaires from San Francisco. Locals decamped from here ages ago because it became too expensive to live in.
This is also where my parents honeymooned in 1949, borrowing my grandfather’s 1947 Ford.
John Thomas
CEO & Publisher
The Diary of a Mad Hedge Fund Trader