• support@madhedgefundtrader.com
  • Member Login
Mad Hedge Fund Trader
  • Home
  • About
  • Store
  • Luncheons
  • Testimonials
  • Contact Us
  • Click to open the search input field Click to open the search input field Search
  • Menu Menu

Tag Archive for: (TLT)

MHFTF

The Market Outlook for the Week Ahead, or Mass Evacuation

Diary, Newsletter

I will be evacuating the City of San Francisco upon the completion of this newsletter.

The smoke from the wildfires has rendered the air here so thick that it has become unbreathable. It reminds me of the smog in Los Angeles I endured during the 1960s before all the environmental regulation kicked in. All Bay Area schools are now closed and anyone who gets out of town will do so.

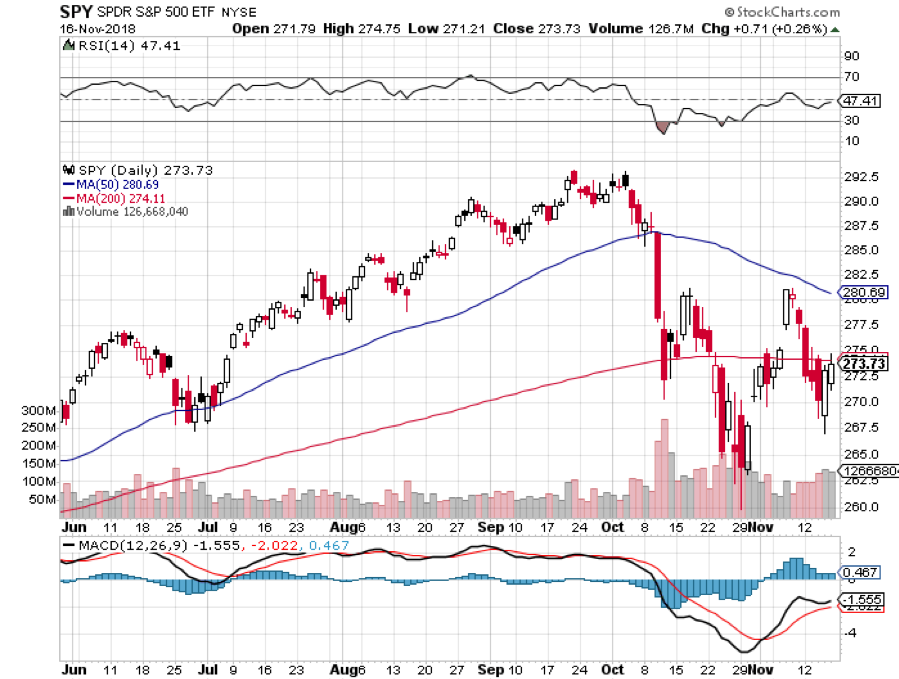
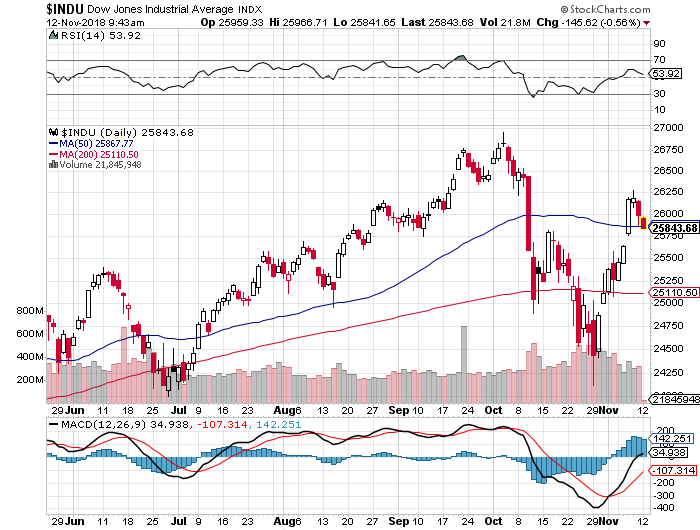
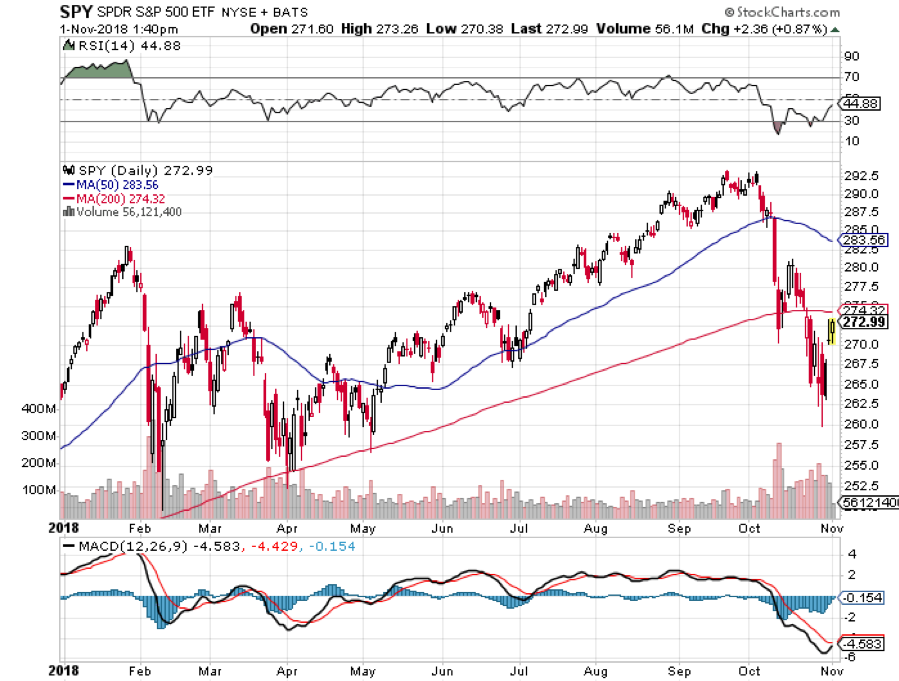
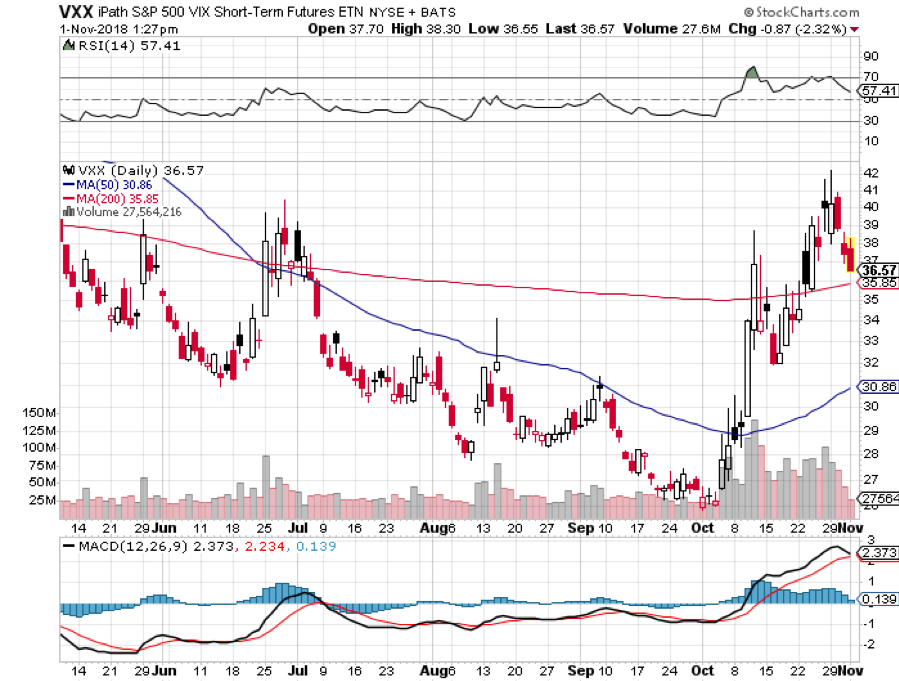
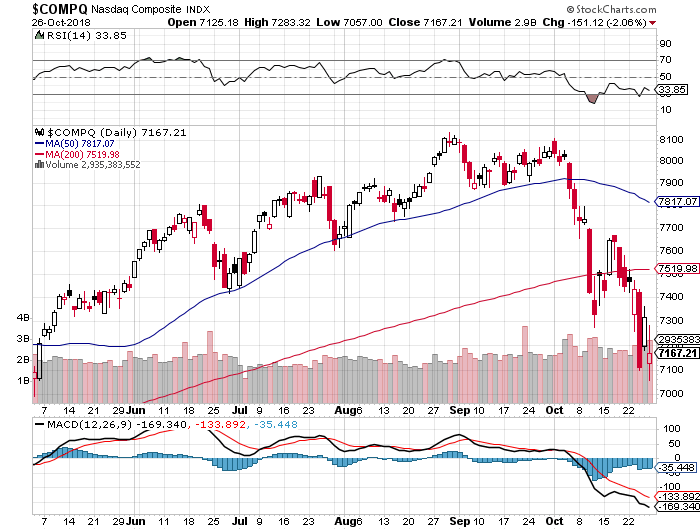
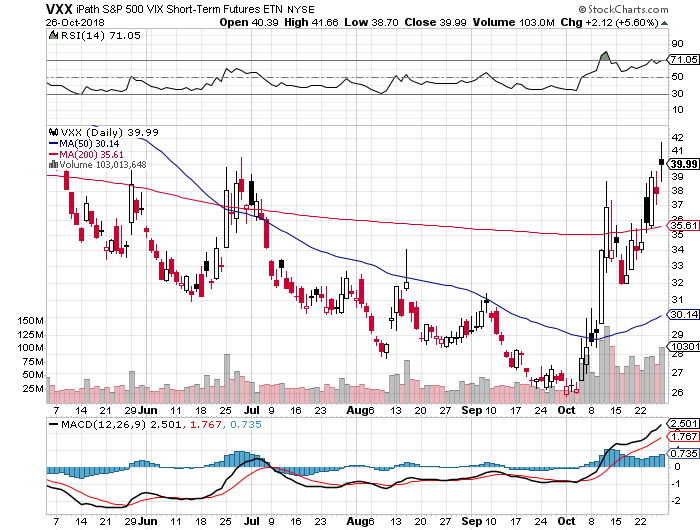
There has been a mass evacuation going on of a different sort and that has been investors fleeing the stock market. Twice last week we saw major swoons, one for 900 points and another for 600. Look at your daily bar chart for the year and the bars are tiny until October when they suddenly become huge. It’s really quite impressive.

Concerns for stocks are mounting everywhere. Big chunks of the economy are already in recession, including autos, real estate, semiconductors, agricultural, and banking. The FANGs provided the sole support in the market….until they didn’t. Most are down 30% from their tops, or more.

In fact, the charts show that we may have forged an inverse head and shoulders for the (SPY) last week, presaging greater gains in the weeks ahead.

The timeframe for the post-midterm election yearend rally is getting shorter by the day. What’s the worst case scenario? That we get a sideways range trade instead which, by the way, we are perfectly positioned to capture with our model trading portfolio.

There are a lot of hopes hanging on the November 29 G-20 Summit which could hatch a surprise China trade deal when the leaders of the two great countries meet. Daily leaks are hitting the markets that something might be in the works. In the old days, I used to attend every one of these until they got boring.

You’ll know when a deal is about to get done with China when hardline trade advisor Peter Navarro suddenly and out of the blue gets fired. That would be worth 1,000 Dow points alone.

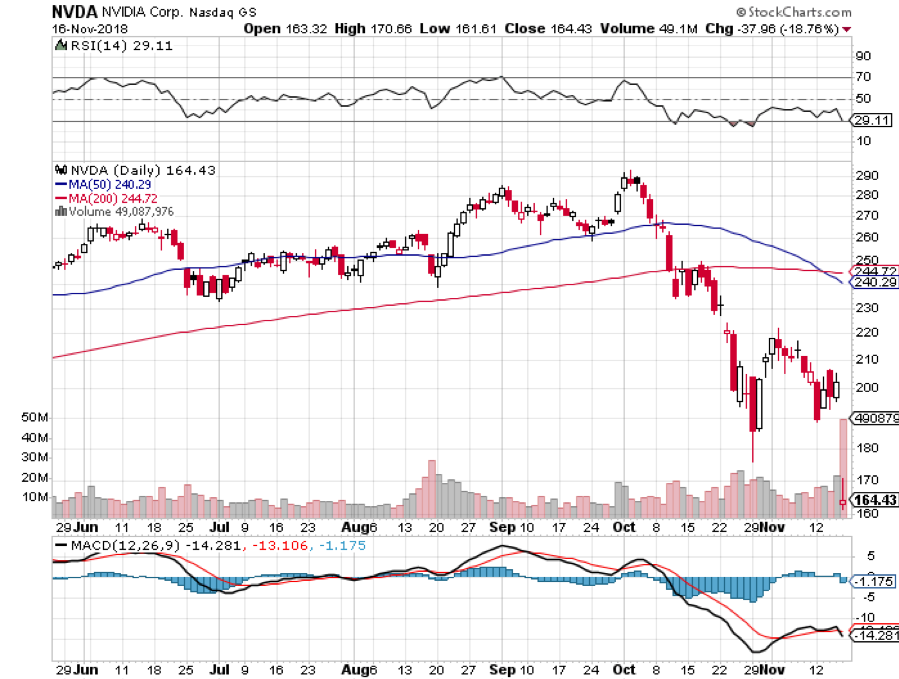
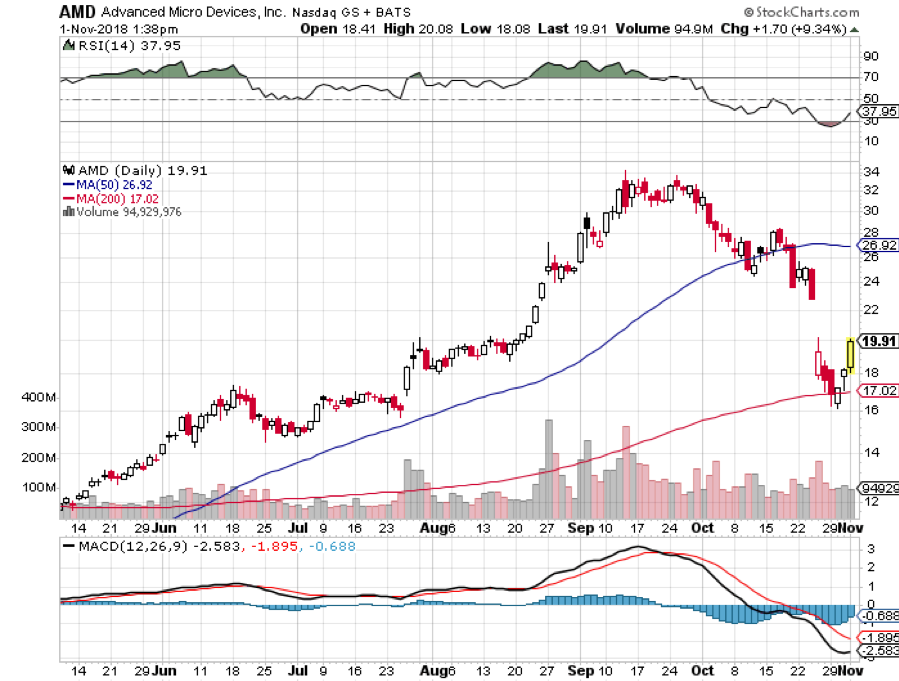
It was a week when the good were punished and the bad were taken out and shot. Wal-Mart (WMT) saw a 4% hickey after a fabulous earnings report. NVIDIA (NVDA) was drawn and quartered with a 20% plunge after they disappointed only slightly because their crypto mining business fell off, thanks to the Bitcoin crash.

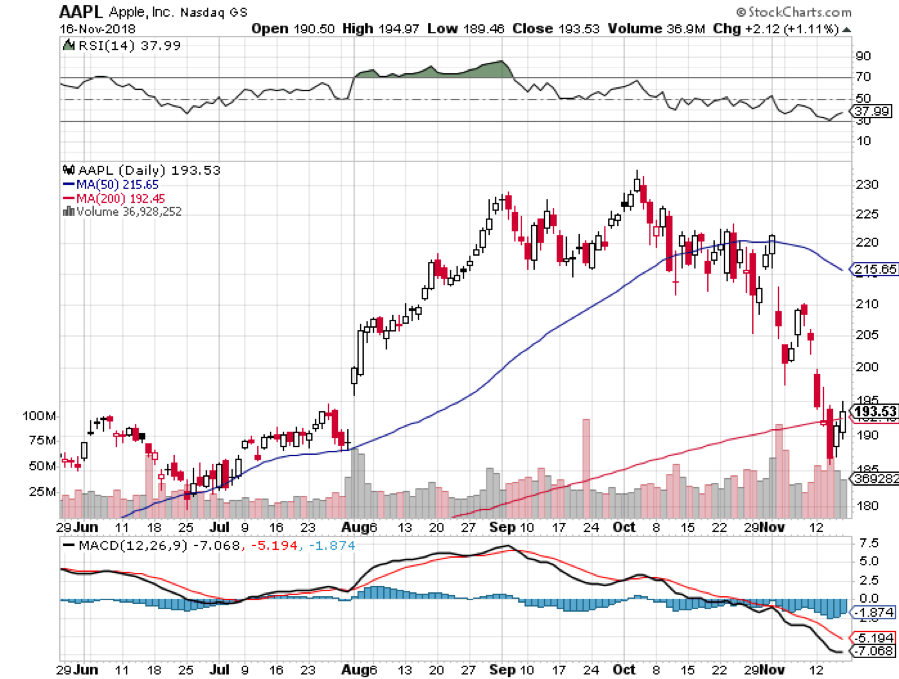
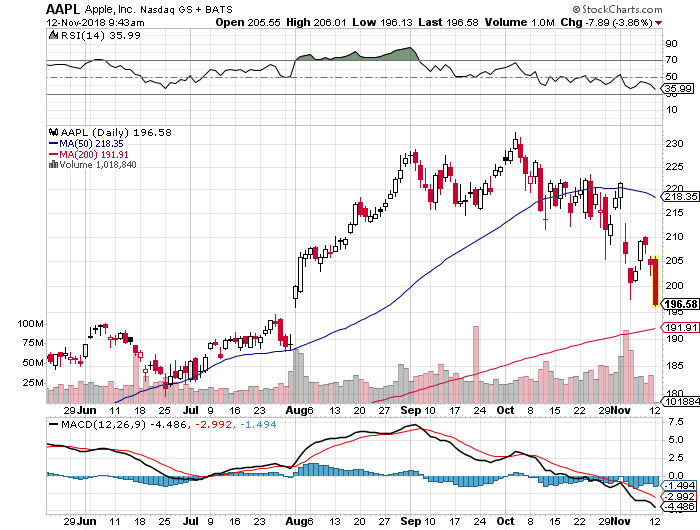
Apple (AAPL) fell $39 from its October highs, on a report that demand for facial recognition chips is fading, evaporating $170 billion in market capitalization. Some technology stocks have fallen so much they already have the next recession baked in the price. That makes them a steal at present levels for long term players.

The US dollar surged to an 18-month high. Look for more gains with interest rates hikes continuing unabated. Avoid emerging markets (EEM) and commodities (FCX) like the plague.

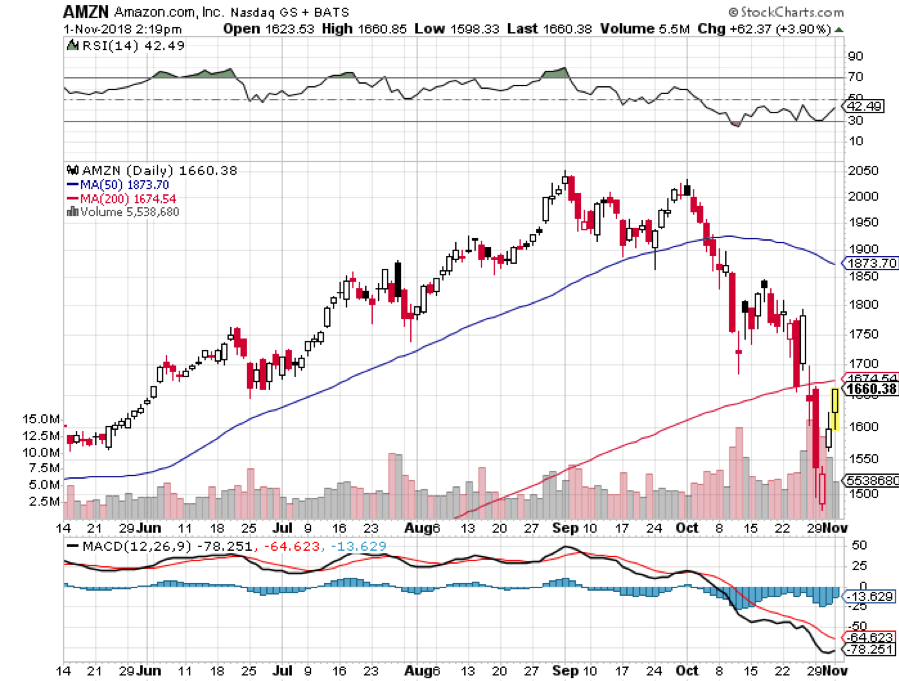
After a two-year search, Amazon (AMZN) picked New York and Virginia for HQ 2 and 3 in a prelude to the breakup of the once trillion-dollar company. The stock held up well in the wake of another administration antitrust attack. 

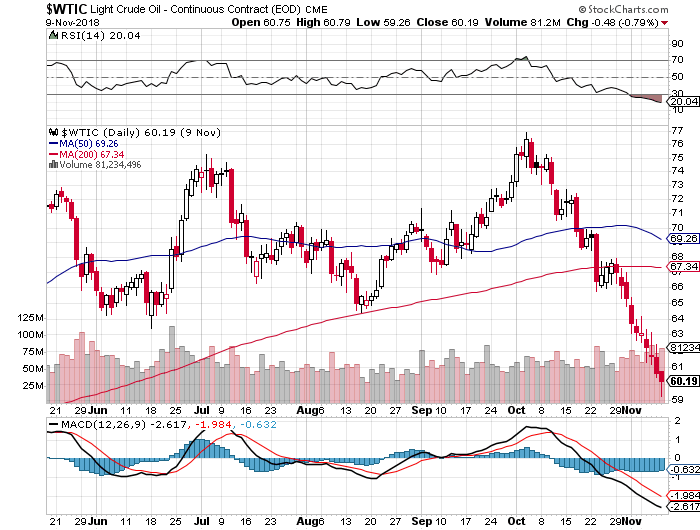
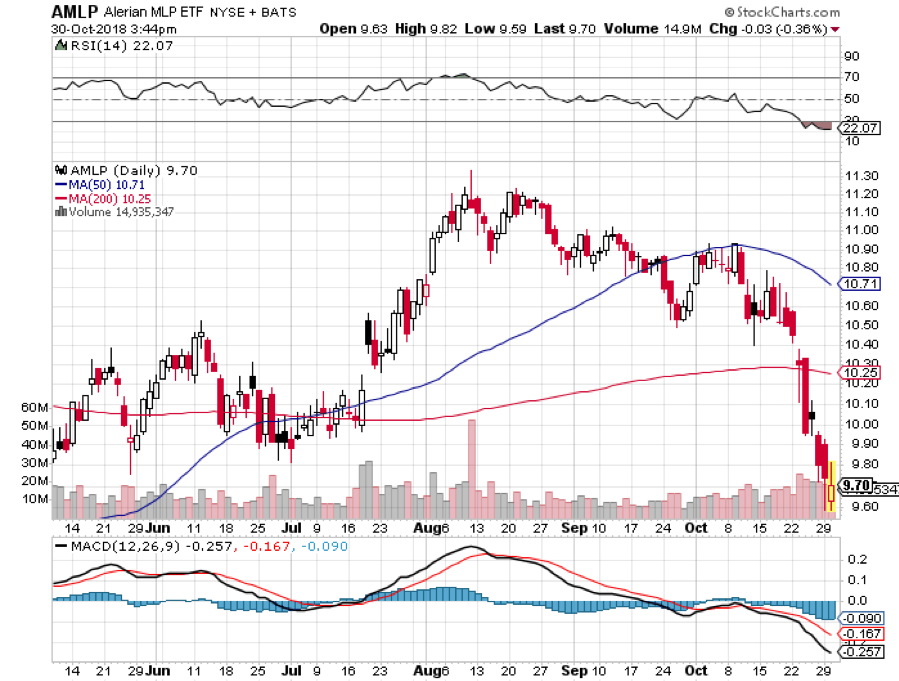
Oil crashed too, hitting a lowly $55 a barrel, on oversupply concerns. What else would you expect with China slowing down, the world’s largest marginal new buyer of Texas tea? Are all these crashes telling us we are already in a recession or is it just the Fed’s shrinkage of the money supply?

The British government seemed on the verge of collapse over a Brexit battle taking the stuffing out of the pound. A new election could be imminent. I never thought Brexit would happen. It would mean Britain committing economic suicide.

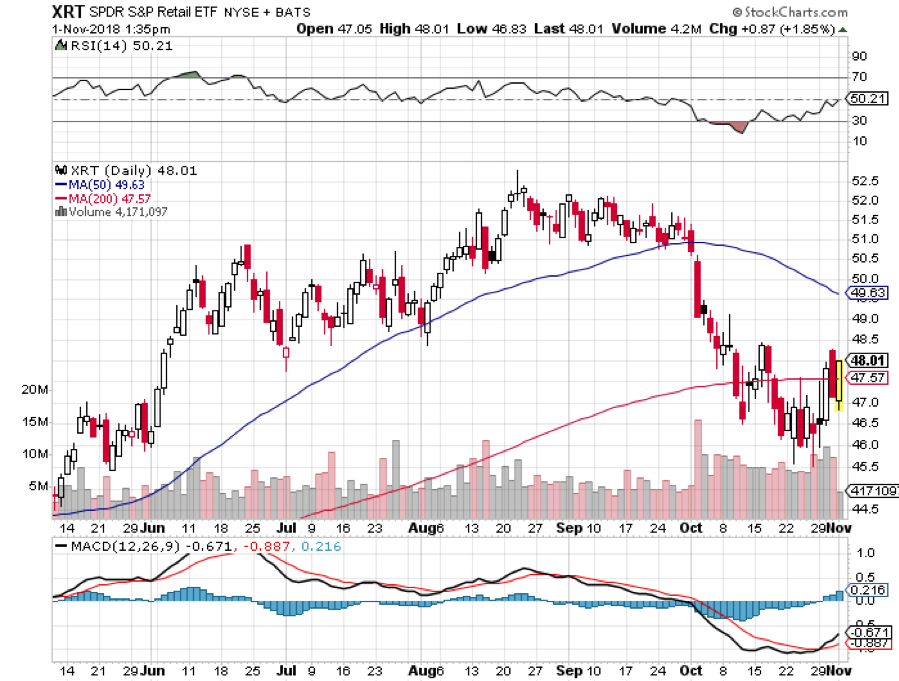
US Retails Sales soared in October, up a red hot 0.8% versus 0.5% expected, proving that the main economy remains strong. Don’t tell the stock market or oil which think we are already in recession.

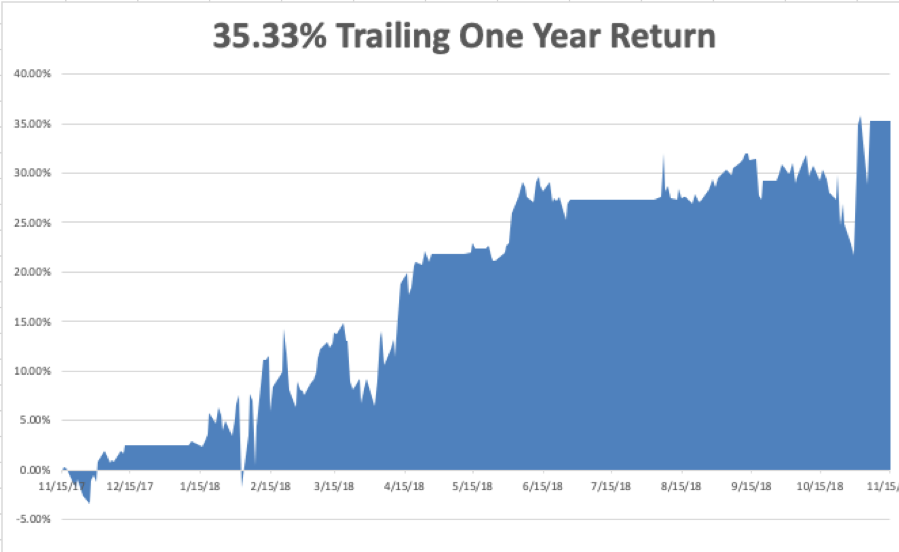
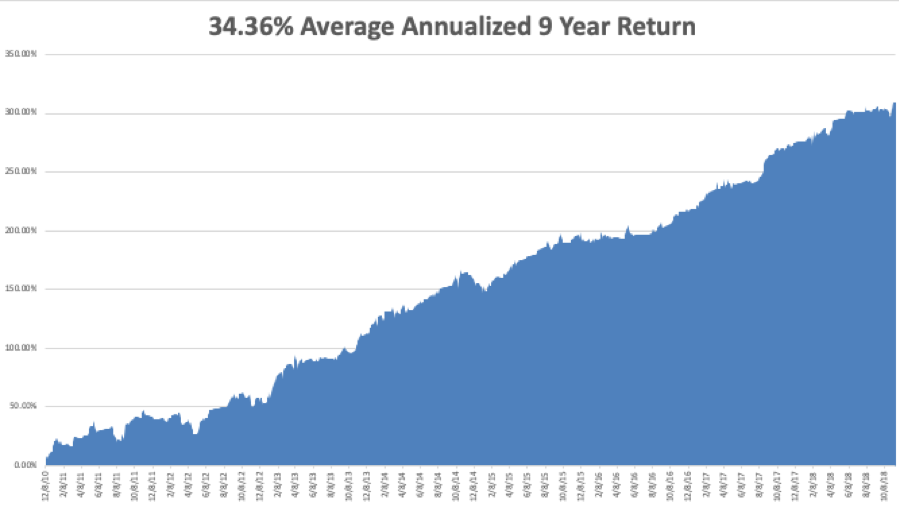
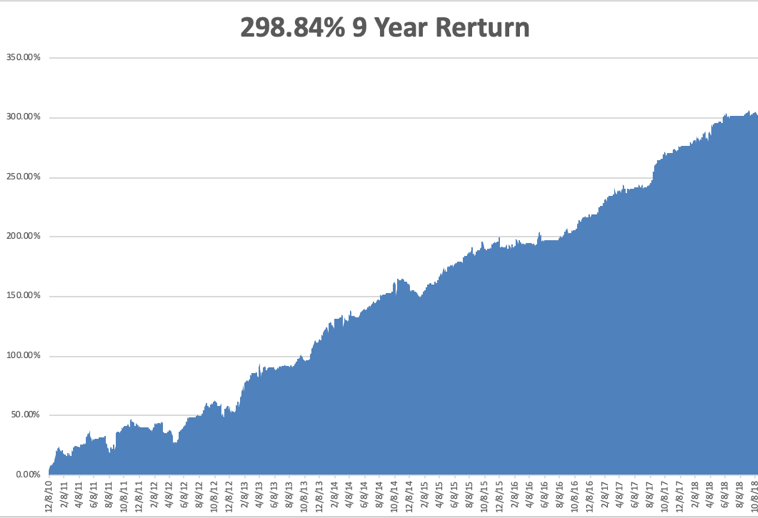
My year-to-date performance rocketed to a new all-time high of +33.71%, and my trailing one-year return stands at 35.89%. November so far stands at +4.08%. And this is against a Dow Average that is up a miniscule 2.41% so far in 2018.

My nine-year return ballooned to 310.18%. The average annualized return stands at 34.46%. 2018 is turning into a perfect trading year for me, as I’m sure it is for you.

I used every stock market meltdown to add aggressively to my December long positions, betting that share prices go up, sideways, or down small by then.

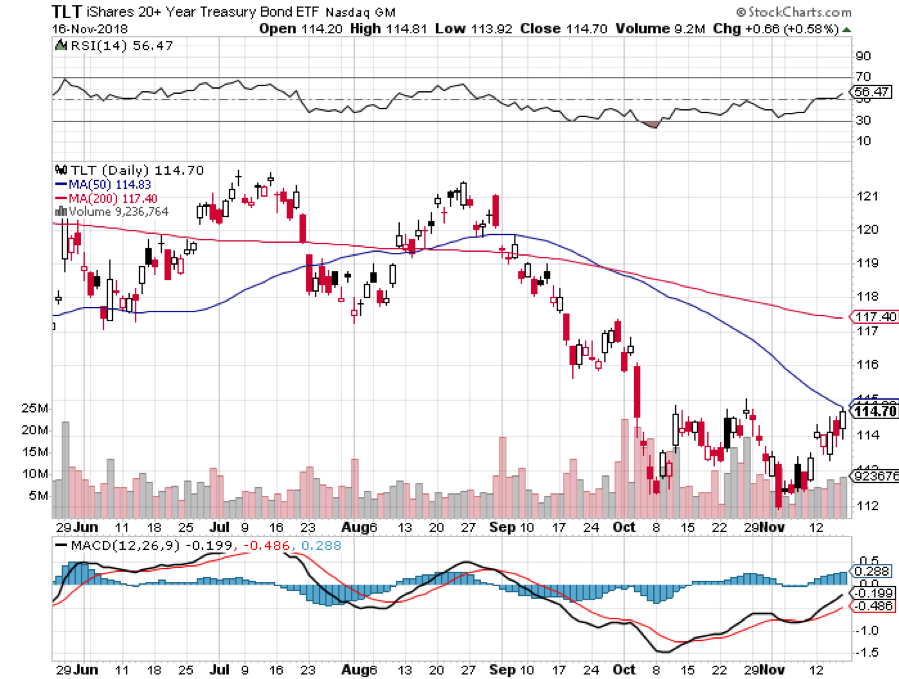
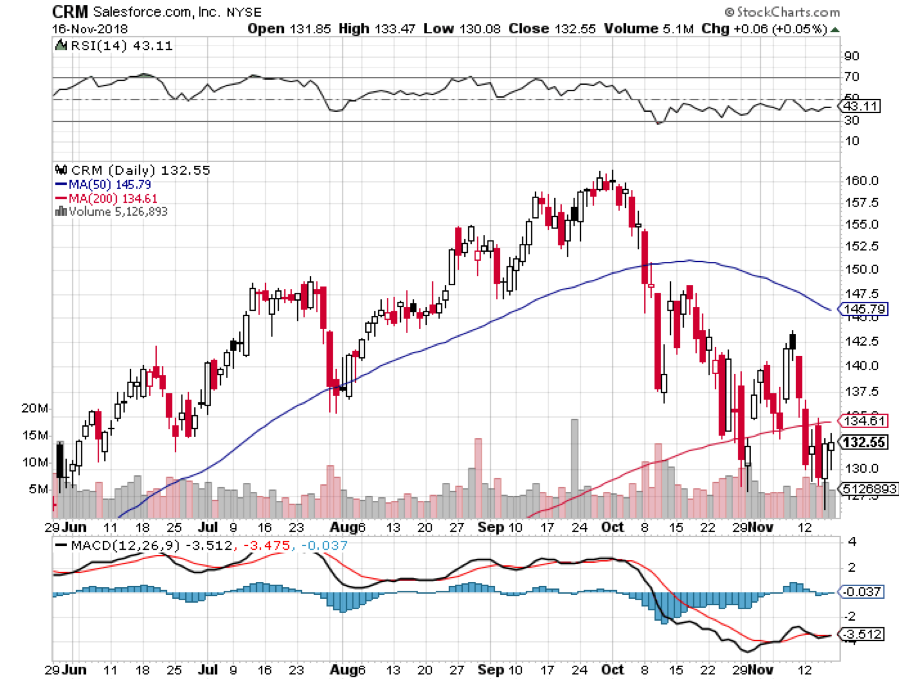
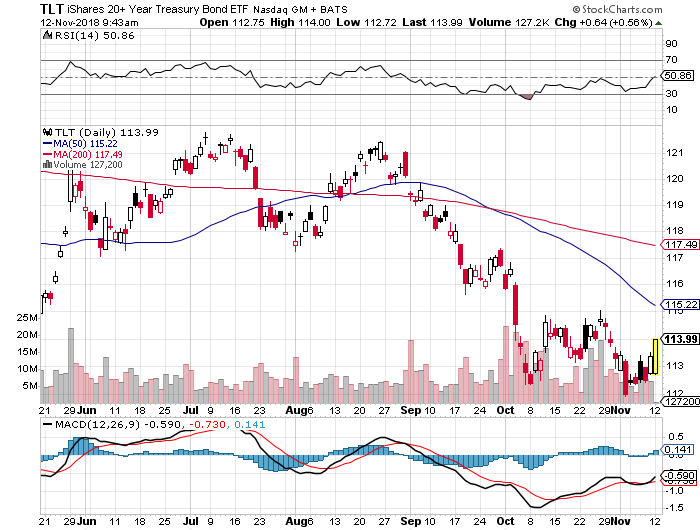
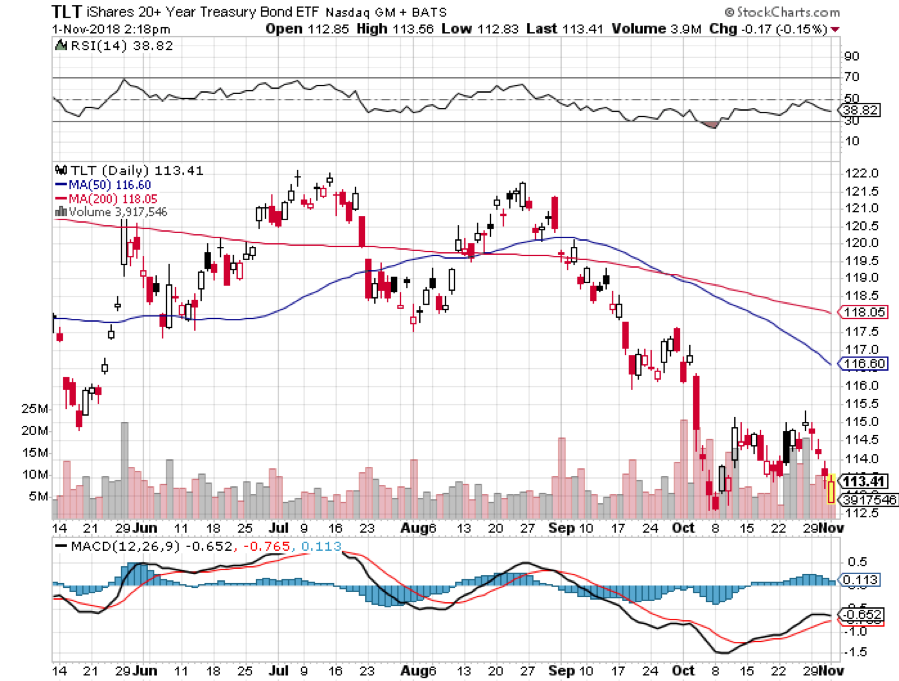
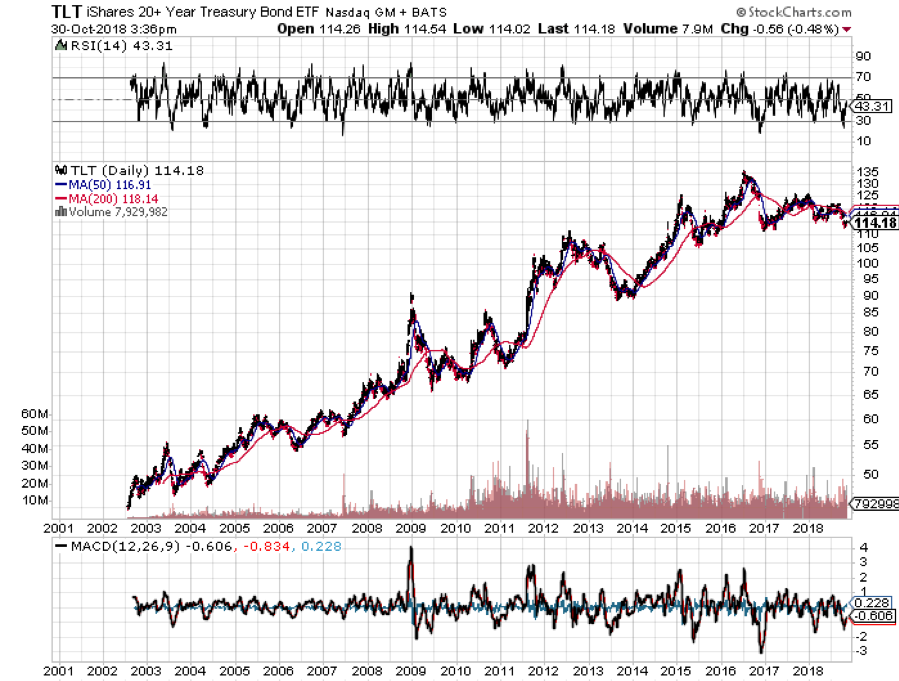
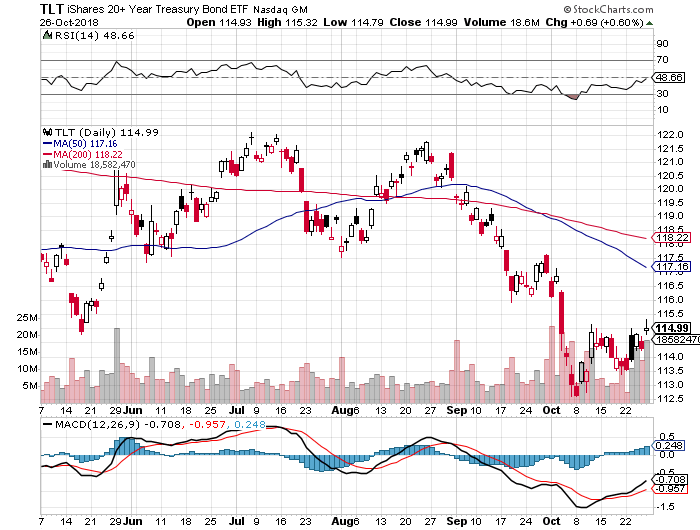
The new names I picked up this week include Amazon (AMZN), Apple (AAPL), Salesforce (CRM), NVIDIA (NVDA), Square (SQ), and a short position in Tesla (TSLA). I also doubled up my short position in the United States US Treasury Bond Fund (TLT).

I caught the absolute bottom after the October meltdown. Will lightning strike twice in the same place? One can only hope. One hedge fund friend said I was up so much this year it would be stupid NOT to bet big now.

The Mad Hedge Technology Letter is really shooting the lights out the month, up 8.63%. It picked up Salesforce (CRM), NVIDIA (NVDA), Square (SQ), and Apple (AAPL) last week, all right at market bottoms.

The coming week will be all about October housing data which everyone is expecting to be weak.

Monday, November 19 at 10:00 EST, the Home Builders Index will be out. Will the rot continue? I’ll be condo shopping in Reno this weekend to see how much of the next recession is already priced in.

On Tuesday, November 20 at 8:30 AM, October Housing Starts and Building Permits are released.

On Wednesday, November 21 at 10:00 AM, October Existing Home Sales are published.

At 10:30 AM, the Energy Information Administration announces oil inventory figures with its Petroleum Status Report.

Thursday, November 22, all market will be closed for Thanksgiving Day.

On Friday, November 23, the stock market will be open only for a half day, closing at 1:00 PM EST. Second string trading will be desultory, and low volume.

The Baker-Hughes Rig Count follows at 1:00 PM.

As for me, I'd be roaming the High Sierras along the Eastern shore of Lake Tahoe looking for a couple of good Christmas trees to chop down. I have two US Forest Service permits in hand at $10 each, so everything will be legit.

Good luck and good trading.

John Thomas
CEO & Publisher
The Diary of a Mad Hedge Fund Trader


https://www.madhedgefundtrader.com/wp-content/uploads/2018/11/John-Thomas-Ax.png 375 522 MHFTF https://madhedgefundtrader.com/wp-content/uploads/2019/05/cropped-mad-hedge-logo-transparent-192x192_f9578834168ba24df3eb53916a12c882.png MHFTF2018-11-19 03:06:042018-11-19 02:57:54The Market Outlook for the Week Ahead, or Mass Evacuation
MHFTF

November 16, 2018

Diary, Newsletter, Summary

Global Market Comments
November 16, 2018
Fiat Lux

Featured Trade:

(RISK CONTROL FOR DUMMIES),
(SPY), (AMZN), (TLT), (CRM), (VXX)

https://madhedgefundtrader.com/wp-content/uploads/2019/05/cropped-mad-hedge-logo-transparent-192x192_f9578834168ba24df3eb53916a12c882.png 0 0 MHFTF https://madhedgefundtrader.com/wp-content/uploads/2019/05/cropped-mad-hedge-logo-transparent-192x192_f9578834168ba24df3eb53916a12c882.png MHFTF2018-11-16 09:13:092018-11-16 09:14:31November 16, 2018
MHFTF

November 12, 2018

Diary, Newsletter, Summary

Global Market Comments
November 12, 2018
Fiat Lux

Featured Trade:


(THE MARKET OUTLOOK FOR THE WEEK AHEAD, or IT’S FINALLY OVER),
(SPY), (TLT), (AAPL), (ROKU), (USO)

https://madhedgefundtrader.com/wp-content/uploads/2019/05/cropped-mad-hedge-logo-transparent-192x192_f9578834168ba24df3eb53916a12c882.png 0 0 MHFTF https://madhedgefundtrader.com/wp-content/uploads/2019/05/cropped-mad-hedge-logo-transparent-192x192_f9578834168ba24df3eb53916a12c882.png MHFTF2018-11-12 10:17:552018-11-12 10:16:06November 12, 2018
MHFTF

The Market Outlook for the Week Ahead, or It’s Finally Over

Diary, Newsletter

Could it have been the election all along?

Did the massive uncertainty created by the midterm elections hold back investors for all of ten months?

That’s what it looks like now. In a mere three days, shares made back half of what they lost in October, one of the worst trading months in stock market history.

All the market did was trade in a giant range until the day before we trudged out to our local ballot boxes. After that, it was off to the races. Who was the big winner? The people who want to make Donald Trump’s life miserable who now have countless means with which to do so.

Now that the wraps are off, the way is clear for markets to forge on to new all-time highs which they will do by yearend, or early 2019 at the latest.

The Mad Hedge Market Timing Index saw the sharpest rally in 30 years, from 4 to 29 in a week. I told you the market was cheap!

Oil prices (USO) are telling us we are already in recession. Prices are in free fall hitting $60 a barrel, a nine-month low. China certainly is hurting and they are the largest marginal new buyer of Texas tea.

What we are really seeing is a massive unwind of wrong-footed hedge fund oil longs who expected oil prices to soar with the implementation of new sanctions on Iran. They didn’t.

US Exports plunged 26% in September while tariffs paid by US companies soared by an eye-popping 54%. The destruction of American international trade is well underway. When will it end? Who’s benefiting?

Asians are boycotting US Treasury sales and the US needs to sell to staggering $1.3 trillion in new debt in 2019. Keep hammering the (TLT) with those short positions, your new rich uncle trade.

The Producer Price Index Soared in October, up 0.6% versus 0.2% expected. Yikes, and double yikes! Inflation is here. Keep selling short those bonds (TLT)!

Trump threatened anti-trust action against all of big tech. Market yawned, with Amazon down only $50 after an enormous run-up. A 1% market share against falling prices and enormous customer satisfaction never triggered an anti-trust action before. Jeff Bezos is not the robber baron John D. Rockefeller. Could it be political?

The Number of Job Openings exceeded workers by 1 million in August, with 7.01 million openings versus 5.96 million unemployed. It’s the first time since the Dotcom Bubble top. Are we headed for a 3% Headline Unemployment Rate?

The Golden Age of Gridlock began with the Dems taking the House by flipping 40 seats and the Republicans holding the Senate. Now you can turn off your TV and focus on trading for the next two years. Buy stocks on dips, sell bonds on rallies. Oh, and the 2020 presidential election starts tomorrow.

Housing Sentiment hit a one year low, down a humongous five points, the second fastest drop in history. Rising interest rates have driven a stake through the heart of this once rip-roaring market, but it’s no 2008 replay.

November Share Buy Backs are poised to be the largest in history. Of course, you knew this was going to happen a month ago if you read Mad Hedge Fund Trader. Gotta love that tax reform!

My year-to-date performance rocketed to a new all-time high of +32.94%, and my trailing one-year return stands at 35.33%. November so far stands at +3.31%. And this is against a Dow Average that is up a pitiful 4.43% so far in 2018.

My nine-year return ballooned to 309.41%. The average annualized return stands at 34.72%. 2018 is turning into a perfect trading year for me, as I’m sure it is for you.

In the week before the election, I strapped on the most aggressive long portfolio of this year. It worked like a charm. I then went almost entirely in cash before election day, locking a 12% gain for the model trading portfolio.

I lasted in cash on two days. On the first down 300 point Dow day, I started adding positions in the old familiar names, including Apple (AAPL), Roku (ROKU) for the Mad Hedge Technology Letter, and a short in the (TLT). Bonds could really get crushed going into yearend targeting a 3.50% yield.

Q3 earnings have finished with a whimper and the blackout periods for share buybacks are now over. Let the buying begin! Some $200 billion has to hit the market by yearend, mostly in technology stocks.

After all the recent fireworks, this will be a quiet week on the data front. The October CPI will be the big one, out on Wednesday.

Monday, November 12 is Veterans Day. Stock markets are open but bonds are closed.

On Tuesday, November 13 at 6:00 AM EST, the NFIB Small Business Optimism Index is released.

On Wednesday, November 14 at 8:30 EST, we have the all-important Consumer Price Index announced. How hot will it be?

At 10:30 AM the Energy Information Administration announces oil inventory figures with its Petroleum Status Report.

Thursday, November 15 at 8:30, we get Weekly Jobless Claims. At the same time, October Retail Sales are put out.

On Friday, November 16, at 9:15 AM, the October Industrial Production is published.

The Baker-Hughes Rig Count follows at 1:00 PM.

As for me, I am on standby to volunteer as a pilot and serve as spotter for Calfire for the latest Northern California wildfires. I put my name on the waiting list last year, and they only just got around to calling me. There were 2,000 other volunteer pilots on the waiting list ahead of me.

You gotta love America.

Good luck and good trading.

Captain John Thomas
CEO & Publisher
The Diary of a Mad Hedge Fund Trader


https://www.madhedgefundtrader.com/wp-content/uploads/2018/11/John-Thomas-plane.png 529 666 MHFTF https://madhedgefundtrader.com/wp-content/uploads/2019/05/cropped-mad-hedge-logo-transparent-192x192_f9578834168ba24df3eb53916a12c882.png MHFTF2018-11-12 10:16:522018-11-12 10:15:37The Market Outlook for the Week Ahead, or It’s Finally Over
MHFTF

November 9, 2018

Diary, Newsletter, Summary

Global Market Comments
November 9, 2018
Fiat Lux

Featured Trade:
(PLAYING THE SHORT SIDE WITH VERTICAL BEAR PUT SPREADS), (TLT)
(WHY TECHNICAL ANALYSIS DOESN’T WORK)
(FB), (AAPL), (AMZN), (GOOG), (MSFT), (VIX)

https://madhedgefundtrader.com/wp-content/uploads/2019/05/cropped-mad-hedge-logo-transparent-192x192_f9578834168ba24df3eb53916a12c882.png 0 0 MHFTF https://madhedgefundtrader.com/wp-content/uploads/2019/05/cropped-mad-hedge-logo-transparent-192x192_f9578834168ba24df3eb53916a12c882.png MHFTF2018-11-09 01:08:132018-11-08 16:43:46November 9, 2018
MHFTF

November 2, 2018

Diary, Newsletter, Summary

Global Market Comments
November 2, 2018
Fiat Lux

Featured Trade:

(OCTOBER 31 BIWEEKLY STRATEGY WEBINAR Q&A),
(EDIT), (TMO), (OVAS), (GE), (GLD), (AMZN), (SQ), (VIX), (VXX), (GS), (MSFT), (PIN), (UUP), (XRT), (AMD), (TLT)

https://madhedgefundtrader.com/wp-content/uploads/2019/05/cropped-mad-hedge-logo-transparent-192x192_f9578834168ba24df3eb53916a12c882.png 0 0 MHFTF https://madhedgefundtrader.com/wp-content/uploads/2019/05/cropped-mad-hedge-logo-transparent-192x192_f9578834168ba24df3eb53916a12c882.png MHFTF2018-11-02 01:07:252018-11-01 15:52:11November 2, 2018
MHFTF

October 31 Biweekly Strategy Webinar Q&A

Diary, Newsletter

Below please find subscribers’ Q&A for the Mad Hedge Fund Trader October 31 Global Strategy Webinar with my guest and co-host Bill Davis of the Mad Day Trader.

As usual, every asset class long and short was covered. You are certainly an inquisitive lot, and keep those questions coming!

Q: I would like to keep CRISPR stocks as a one or two-year-old, or even longer if it is prudent. What do you think?

A: Yes, there is a CRISPR revolution going on in biotech—I’m extremely bullish on all these stocks, like Editas Medicine (EDIT), Thermo Fisher Scientific (TMO), and Ovascience Inc. (OVAS). If any of these individual companies don’t move forward with their own technology, they will get taken over. The principal asset of these companies is not the patents or the products, it’s the staff, and there is an extreme shortage in CRISPR specialists (and anybody who knows anything about monoclonal antibodies).

Q: Could you explain how to manage LEAPs? For example, the Gold (GLD) and the General Electric (GE) LEAPs. Sit and leave them or trade them short term?

A: You make a lot of money trading long-term LEAPs. Just because you own a year and a half LEAP doesn’t mean that you keep it for a year and a half. You sell it on the first big profit, and I happen to know that on both the Gold (GLD) and the (GE) LEAPs we sent out, people made a 50% profit in the first week. So, I told them: sell it, take the profit. The market always gives you another chance to get in and buy them cheap. You make the money on the turnover, on the volume—not hanging out trying to hit a home run.

Q: Why did you only close the Amazon (AMZN) November $1,550-$1,600 vertical bull call spread and not roll the strike prices down and out?

A: Well I actually did do the down and out strike roll out first, which is the super aggressive approach. By adding the November $1,350-$1,400 vertical bull call spread position on Monday at the market lows and doubling the size—we took a huge 30% position in Amazon and that position alone should bring in about $3600 in profits in two weeks, at expiration. And when I put on that second position I told myself that on the next big rally I would get out of the high-risk trouble making position, which was the November $1,550-$1,600 vertical bull call spread. So that’s how you trade your way out of a 30% drop in three weeks in one of the best tech stocks in the market.

Q: Is AT&T (T) no longer a good buy at these prices?

A: All of the telephone companies have legacy technology, meaning they are all dying. Basically, AT&T is about owning a bunch of rusting copper wire spread around the country. They haven’t been able to innovate new technologies fast enough to keep up with others who have. The only reason to own this is for the very high 6.56% dividend. That said, dividends can be cut. Look at General Electric which cut its dividend earlier this year. Whatever you make of the dividend can get lost in the principal.

Q: Do you think Square (SQ) is a good buy at this level?

A: Absolutely, it’s a screaming buy. It’s one of the favorite companies of the Mad Hedge Technology Letter and one of the preeminent disruptors of the banks. We think there’s another 400% gain in Square from here. It’s dominating FinTech now.

Q: When do you expect to close the short position in the iPath S&P 500 VIX Short-Term Futures ETN (VXX)?

A: If we can get the Volatility Index (VIX) down to $15, the (VXX) should crater. We’ll take a hit on the time decay and that’s why I say we may be able to sell it for 20 cents in the future when this happens. We’ll still take a 50% hit on the position, but half is better than none.

Q: What happened to Microsoft (MSFT) last week?

A: People sold their winners. They had a great earnings report and great long-term earnings prospects, but everyone in the world owned it. Buy the long-term LEAP on this one.

Q: If we want to double up on the iPath S&P 500 VIX Short-Term Futures ETN (VXX), how do you plan to do it?

A: Go out to further with your expiration date. When you go long the (VXX) you only buy the most distant expiration date. I would buy the February 15 expiration as soon as it becomes available.

Q: How do you see Goldman Sachs (GS) from here to the end of the year?

A: It may go up a little bit as we get some index money coming into play for year-end, but not much; I expect banks to continue to underperform. They are no longer a rising interest rate play. They are a destruction by FinTech play.

Q: Is it too soon for emerging markets in India (PIN)?

A: As long as the dollar (UUP) is strong, which is going to be at least another year, you want to avoid emerging markets like the plague. As long as the Federal Reserve keeps raising interest rates, increasing the yield differential with other currencies, the buck keeps going up.

Q: What are your thoughts on retail ETFs like the SPDR S&P Retail ETF (XRT)?

A: You may get lucky and catch a rally on that but the medium term move for retail anything is down. They are all getting Amazoned.

Q: Is it better to increase long exposure the day before the election?

A: No, what we saw starting on Tuesday was the pre-election move. That said, I expect it to continue after the election and into yearend.

Q: Any opinions on Advanced Micro Devices (AMD)?

A: Yes, this is a great level. It was extremely overbought two months ago but has now dropped 50%. It is a great long-term LEAP candidate.

Q: What about the W bottom in the stock market that everyone thinks will happen?

A: I’m one of those people. So far, the bottom for the move in the S&P 500 is looking pretty convincing, but we will test the faith sometime in the next week I’m sure. We got close enough to the February $252 low to make this a very convincing move. It sets up range trading for the market for the next year.

Q: How do you figure the inflation rate is 3.1%?

A: The year-on-year Consumer Price Index for September printed at 2.3%, and the most recent months have been running at an annualized 2.9% rate. Given that this data is months old we are probably seeing 3.1% on a monthly annualized basis now given all the anecdotal evidence of rising prices and wages that are out there. That is certainly what the bond market believes with its recent sharp selloff and why I will continue to be a fantastic short. Sell every United States US Treasury Bond Fund ETF (TLT) rally. Like hockey great Wayne Gretzky said, you have to aim not where the hockey puck is, but where it's going to be.

Q: Will rising interest rates kill the housing market?

A: It already has. A 5% 30-year mortgage rate shuts a lot of first time Millennial buyers out of the market. We are seeing real estate slowing all over the country. Los Angeles is getting the worst hit.

Q: How do you see the Christmas selling season going?

A: It’s going to be great, but this may be the last good one for a while. And Amazon is getting half the business.

Q: October was terrible. How do you see November playing out?

A: It could well be a mirror image of October to the upside. We are already $1,000 Dow points off the bottom. So far, so good. Throw fundamentals out the window and buy whatever has fallen the most….like Amazon.

Did I mention you should buy Amazon?

Good luck and good trading
John Thomas
CEO & Publisher
The Diary of a Mad Hedge Fund Trader


Ten Years of Consumer Price Index


https://madhedgefundtrader.com/wp-content/uploads/2019/05/cropped-mad-hedge-logo-transparent-192x192_f9578834168ba24df3eb53916a12c882.png 0 0 MHFTF https://madhedgefundtrader.com/wp-content/uploads/2019/05/cropped-mad-hedge-logo-transparent-192x192_f9578834168ba24df3eb53916a12c882.png MHFTF2018-11-02 01:06:292018-11-01 18:53:53October 31 Biweekly Strategy Webinar Q&A
MHFTF

What is America’s True National Debt?

Diary, Newsletter
What is America’s True National Debt? 
 

Not a day goes by without someone carping about the national debt to me which now stands at $21.6 trillion.

Since President Obama came into office on January 20, 2010, it skyrocketed.

Are we all going to hell in a handbasket? Eventually, yes.

While it is true that the national debt has increased by some $10 trillion over the past ten years, there is less than meets the eye.

Much less.

That includes the $4 trillion purchased by the Federal Reserve as part of its aggressive five-year monetary policy known as “quantitative easing”.

It also includes another $1 trillion of Treasury holdings by dozens of other federal agencies such as Fannie Mae, Freddie Mac, and Sallie Mae.

So, the net federal debt actually issued during Obama’s two terms is not $9 trillion, but $4 trillion.

That’s a big difference.

These numbers would make Obama one of the most fiscally conservative presidents in US history (see tables below).

And he pulled off this neat trick despite US tax revenues utterly collapsing in the aftermath of the Great Recession.

What the Treasury has in effect done is taken one dollar out of one pocket and put it in the other, 5 trillion times.

There has been no change in the nation’s true indebtedness or net worth as a result of these transactions.

In fact, these bonds were never even really issued. They only exist on a spreadsheet, on a server, on a mainframe, somewhere at 1500 Pennsylvania Avenue, NW, Washington DC.

And here is the real shocker.

The Treasury can cancel this debt at any time.

They can just decide to use one set of figures on the plus side of the balance sheet to offset an equal amount on the negative side, and poof, the debt is gone forever, and the national debt is suddenly only $16 trillion.

It wouldn’t even require an act of Congress. It could simply be carried out through a presidential order.

And we have seen a lot of those lately.

That would give America one of the lowest debt to GDP ratios in the industrialized world.

I actually recommended that the White House use this ploy to get around the last debt ceiling crisis.

All of this sounds nice in theory. But how would markets respond if this were the true state of affairs in the debt markets?

Ten-year US Treasury bond yields would stay stubbornly low around $3.10%.

Prices for marginal debt securities in emerging markets (ELD) would boom.

Am I ringing any bells here people? Do these sound like debt markets you know and love?

A half-century of trading has taught me to never argue with Mr. Market. He is always right.

By keeping its bonds, the Fed has a valuable tool to employ if it ever senses that real inflation is about to make a comeback without having to raise the overnight deposit rate.

It simply can raise bond market rates by selling some of its still considerable holdings.

“FED SELLS BOND HOARD.”

How do you think risk markets would take that headline? Not well, not well at all.

There are other reasons to keep the $5 trillion in phantom Treasury bonds around.

It assures that the secondary market maintains the breadth and depth to accommodate future large-scale borrowing demanded by another financial crisis, Great Recession, or war.

Yes, believe it or not, governments think like this.

I remember that these were the issues that were discussed the last time closing the bond market was considered.

That was at the end of the Clinton administration in 1999 when paying off the entire national debt was only a few years off.

But close down the bond market and fire the few hundred thousand people who work there, and it could take decades to restart.

This is what Japan learned in the 1960’s.

It took the Japanese nearly a half-century to build the bond infrastructure needed to accommodate their massive borrowings of today.

The Chinese are learning the same thing as they strive to construct modern debt markets from whole cloth. It is not an overnight job.

One of the most common questions I get from foreign governments, institutional investors, and wealthy individuals in my international travels is “What will come of America’s debt problem?”

The answer is easy. It will all go to debt heaven. It will disappear.

US government finances are now worsening at a pretty dramatic pace (see more charts and tables below).

The budget deficit has doubled from the Obama low of $450 billion to $900 billion in only two years. Debt has exceeded GDP for the first time since WWII. New government bond issuance is rocketing and will crush the market any day now.

However, there is a way out of the looming financial disaster.

A massive demographic tailwind kicks in during the 2020s as 85 million Millennials grow up to become big-time taxpayers.

In the meantime, the last of the benefit-hungry baby boomers finally die off, eliminating an enormous fiscal drag.

“Depends” and “Ensure” prices will crater.

The national debt should disappear by 2030, or 2035 at the latest. The same is true for the Social Security deficit. That’s when we next have to consider firing the entire bond market once more.

That is what happened to the gargantuan debt run up by the Great Depression, the Civil War, and the Revolutionary War.

Government debt always goes to debt Heaven either through repayment during the period of demographic expansion and economic strength, or via diminution of purchasing power caused by inflation.

That’s why we have governments to pull forward economic growth during the soft periods in order to even out economic growth and job creation over the very long term to accommodate population growth. Pulling forward growth during strong economies as the administration is now doing only ends in tears.

The French were the first to figure all this out in the 17th century. They were not the last.

History doesn’t repeat itself, but it certainly rhymes.


https://madhedgefundtrader.com/wp-content/uploads/2019/05/cropped-mad-hedge-logo-transparent-192x192_f9578834168ba24df3eb53916a12c882.png 0 0 MHFTF https://madhedgefundtrader.com/wp-content/uploads/2019/05/cropped-mad-hedge-logo-transparent-192x192_f9578834168ba24df3eb53916a12c882.png MHFTF2018-10-31 01:07:002018-10-30 19:21:26What is America’s True National Debt?
MHFTF

October 29, 2018

Diary, Newsletter, Summary

Global Market Comments
October 29, 2018
Fiat Lux

Featured Trade:

(THE MARKET OUTLOOK FOR THE WEEK AHEAD, or THE COMING 2018 REPLAY),
(TLT), (SPY), (VIX), (VXX), (AAPL),
(FB), (AMZN), (NFLX), (TESLA),
(A COW-BASED ECONOMICS LESSON)


https://madhedgefundtrader.com/wp-content/uploads/2019/05/cropped-mad-hedge-logo-transparent-192x192_f9578834168ba24df3eb53916a12c882.png 0 0 MHFTF https://madhedgefundtrader.com/wp-content/uploads/2019/05/cropped-mad-hedge-logo-transparent-192x192_f9578834168ba24df3eb53916a12c882.png MHFTF2018-10-29 01:08:132018-10-29 00:07:52October 29, 2018
MHFTF

The Market Outlook for the Week Ahead, or the Coming 2018 Replay

Diary, Newsletter

If you missed 2018, you get to do it all over again. That’s what the major indexes are offering us after giving up all of this year’s gains, and then some.

We go into the coming week with markets giving their most oversold readings since the popping of the 2000 Dotcom bubble and the 1987 crash. Markets are shouting imminent recession loud and clear.

Except that markets have discounted 13 out of the last six recessions and it is currently discounting one of those non-recessions.

Here is my calendar of upcoming potential market bottoms. Please note that all are within the next seven trading days.

October 29-reversal day of the Friday selloff.
October 31-rebalancing of funds will require a large amount of equity buying for month end. Facebook (FB) reports.
November 1-the Apple (AAPL) earnings are out.
November 7-the midterm elections.

There is no way that we are going into a recession and a bear market now. That is 2019 business. Bear markets don’t begin with real interest rates at zero which they are at now (3.1% ten-year Treasury yield – 3.1% inflation rate = zero). And they may well still be at zero in a year (4% ten-year Treasury yield – 4% inflation rate= zero).

Earnings are still great in the technology area, 50% of the national total. The Dotcom market top was characterized by the collection of vast numbers of eyeballs, not actual cash.

This means that you want to buy the big dips. This is the best entry point for blue-chip technology stocks since 2015. With a price earnings multiple now at 14.9 times 2019 earnings, stocks have given up half the valuation gains since the 2009 market bottom IN A MONTH!

Global trade is collapsing. There is no doubt that businesses massively pulled forward orders to beat the administration’s punitive import duties, thus artificially boosting the Q3 GDP numbers.

The chickens will come to roost in Q1 2019 which is what the stock market may be screaming at us right now with its nightmarish price action.

The big print of the week was the Q3 GDP at 3.5%, down substantially from the 4.2% figure for Q2. That may be the last hot number we see for many years as the tax cuts and spending burst wear off. Next year we return to the long-term average of 2.5%...I hope. If I’m wrong we’ll see zero growth in 2019.

Tesla (TSLA) announced a profit for the first time since 2016, sending the shares soaring. The stock is back up to the level that prevailed before Elon Musk’s last nervous breakdown. Tesla 3’s are flooding the streets of California.

In the meantime, the economic data remains hot with Weekly Jobless Claims still hugging an all-time low at 215,000. But it is all backward-looking data.

Of course, the highlight of the week was the Mad Hedge Lake Tahoe Conference which couldn’t have taken place in more ideal conditions. The food was outstanding, the bottles of Caymus cabernet were fast-flowing, and we even had the option of crashing the wedding in the ballroom next door (I saw some incredibly hot distant cousins).

While I lectured away on the prospects for markets and interest rates, children built sandcastles outside on the balmy Tahoe beach 20 feet away. We had a lot of doctors attend this year and I have to admit it was the first time I was offered a colonoscopy in exchange for a newsletter subscription.

Good cheer was had by all and there was a lot of exchanging of trading tips, email addresses, and phone numbers. It is clear the readers are making fortunes with my service. Most have already committed to coming back next year.
 
My year-to-date performance has faded to a still market-beating 22.37%, and my trailing one-year return stands at 30.68%. October is down -6.02%, despite a gut-punching, nearly instant NASDAQ swoon of 13.7%.  Most people will take that in these horrific conditions.

My single stock positions have been money makers, but my short volatility position (VXX), which I put on way too early, was a disaster eating up all of my profits. I bought puts with the (VXX) at $30. It hit an incredible $42 on Friday. That's why you only take on small 5% positions in outright volatility securities.

My nine-year return retreated to 298.84%. The average annualized return stands at 34.58%. Global Trading Dispatch is now only 44 basis points from an all-time high.

The Mad Hedge Technology Letter has done an outstanding job in October, giving back only -0.89% despite having an aggressively long portfolio. It still maintains an impressive annualized 20.31% profit. It almost completely missed the tech meltdown and then went aggressively long our favorite names right at the market bottom.

This coming week will be focused on the trifecta of jobs data and a few blockbuster technology earnings reports.

Monday, October 29 at 8:30 AM, the October Dallas Fed Manufacturing Survey is out.

On Tuesday, October 30 at 9:00 AM, the Corelogic S&P 500 Case-Shiller Home Price Index is released. Facebook (FB) and FireEye (FEYE) report. earnings.

On Wednesday, October 24 at 8:15 AM, the ADP Employment Report is published, a read on private hiring.

At 10:30 AM the Energy Information Administration announces oil inventory figures with its Petroleum Status Report.

Thursday, October 25 at 8:30, we get Weekly Jobless Claims. Apple (AAPL) reports.

On Friday, October 26, at 8:30 AM, the October Nonfarm Payroll Report is announced. The Baker-Hughes Rig Count follows at 1:00 PM.

Good luck and good trading.

John Thomas
CEO & Publisher
The Diary of a Mad Hedge Fund Trader


https://www.madhedgefundtrader.com/wp-content/uploads/2018/10/Tahoe-attendees-1.png 375 341 MHFTF https://madhedgefundtrader.com/wp-content/uploads/2019/05/cropped-mad-hedge-logo-transparent-192x192_f9578834168ba24df3eb53916a12c882.png MHFTF2018-10-29 01:07:592018-10-29 00:47:03The Market Outlook for the Week Ahead, or the Coming 2018 Replay
Page 87 of 103«‹8586878889›»

Legal Disclaimer

There is a very high degree of risk involved in trading. Past results are not indicative of future returns. MadHedgeFundTrader.com and all individuals affiliated with this site assume no responsibilities for your trading and investment results. The indicators, strategies, columns, articles and all other features are for educational purposes only and should not be construed as investment advice. Information for futures trading observations are obtained from sources believed to be reliable, but we do not warrant its completeness or accuracy, or warrant any results from the use of the information. Your use of the trading observations is entirely at your own risk and it is your sole responsibility to evaluate the accuracy, completeness and usefulness of the information. You must assess the risk of any trade with your broker and make your own independent decisions regarding any securities mentioned herein. Affiliates of MadHedgeFundTrader.com may have a position or effect transactions in the securities described herein (or options thereon) and/or otherwise employ trading strategies that may be consistent or inconsistent with the provided strategies.

Copyright © 2026. Mad Hedge Fund Trader. All Rights Reserved. support@madhedgefundtrader.com
Scroll to top