• support@madhedgefundtrader.com
  • Member Login
Mad Hedge Fund Trader
  • Home
  • About
  • Store
  • Luncheons
  • Testimonials
  • Contact Us
  • Click to open the search input field Click to open the search input field Search
  • Menu Menu

Tag Archive for: ($TNX)

Mad Hedge Fund Trader

Why I?m Hammering the Bond Market

Newsletter

Those lucky traders who have been following my Trade Alert service are well aware that I have been hamming the bond market for the past week. These new positions were a major factor in adding an impressive 5% to my model trading portfolio P&L during a week when there was very little happening in the real world.

There is a method to my madness.

This was supposed to be the year of the ?Great Reallocation,? whereby long-term investors bailed on their fixed income portfolios in favor of stocks. The only problem was that it just didn?t happen.

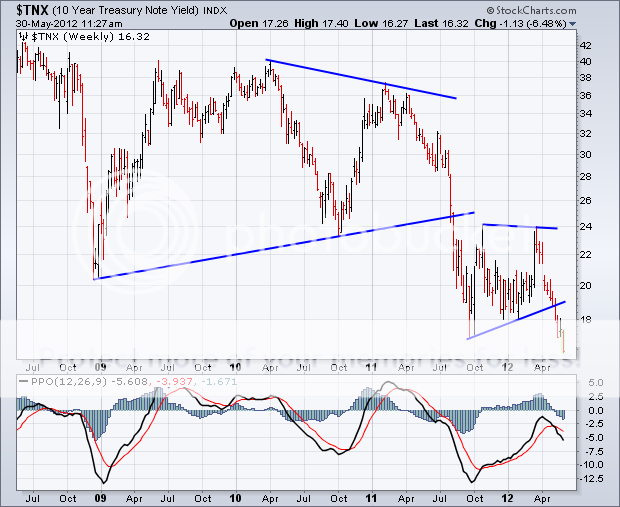
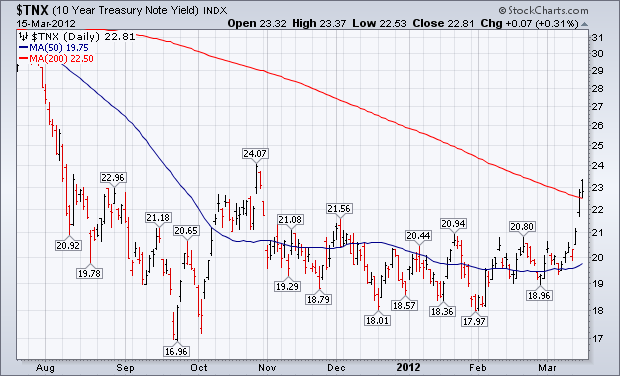
Bonds fell alright, taking the ten year Treasury yield up to 3.0% by August 20. But what selling did occur up until then saw the proceeds moved largely into cash instead of equities.

What happened next surprised many industry experts. Bonds rallied strongly going into a September meeting at the Federal Reserve where they were supposed to announce a taper of its $85 billion a month in bond buying. That was supposed to crash the bond market, and the street piled on massive shorts.

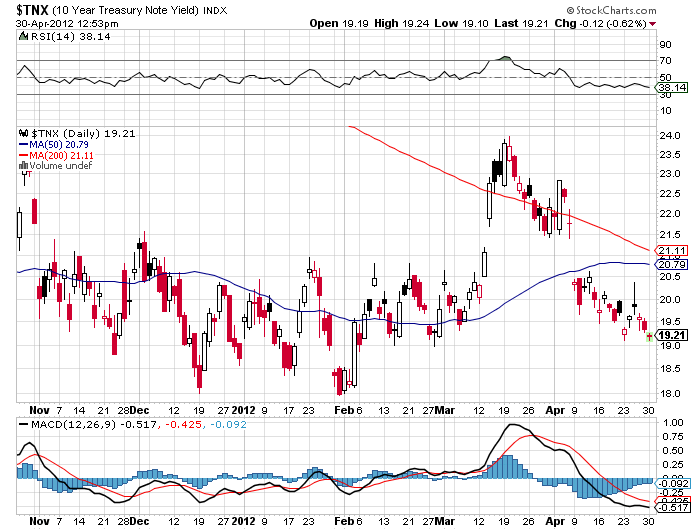
The meeting came and went without a taper announcement, catching many traders wrong footed. That forced them to chase the market to cover shorts, taking the yen year yield all the way down to 2.47% by last week.

Then the rally abruptly died.

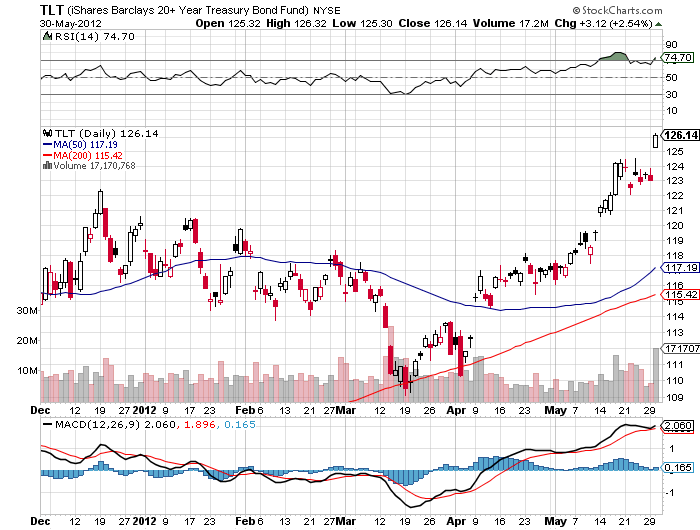
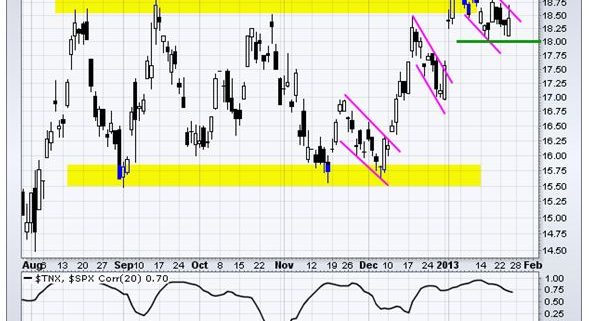
When you see disparate markets confirming major reversals within an asset class all at once, it usually signifies that something big is happening. Starting on Wednesday, the Treasury market peaked and began a rapid descent, taking yields up 17 basis points in dramatic fashion.

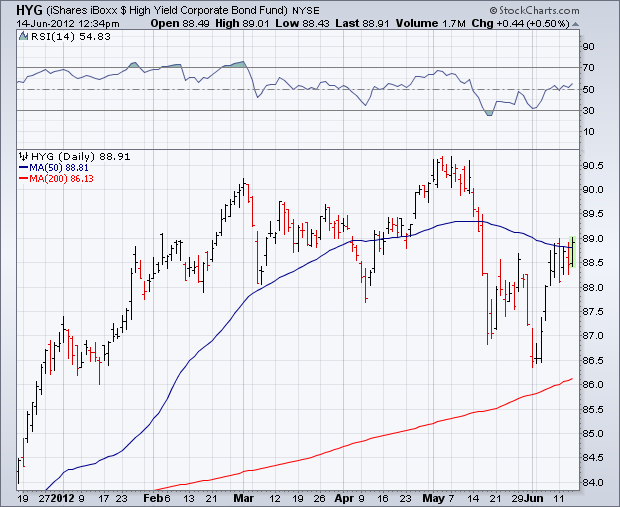
Corporate bonds also took a dive, with the High Grade Investable Bond ETF (LQD) giving back a few points. Junk bonds took a hit, with the high yield ETF (HYG) taking it on the kisser. Even emerging market debt (ELD) and the municipal bond market (MUB) were thrown out with the bathwater.

Only master limited partnerships continued to hold up well, my favorite pick in the sector, Linn Energy (LINE), blasting ten points to the upside. This is one of the few areas in the fixed income space where a double-digit yield pays you for your principal risk.

That prompted me to rush followers out of a 100% cash position into seven new positions in very quick succession. I was writing Trade Alerts so fast that I was busier than the proverbial one-handed paperhanger. So I was a day early. Take it out of my next paycheck!

What is the big thing that the market is trying to tell us here? I may be going deaf and blind in my old age, but I can see this one coming a mile off.

The ?Great Reallocation? scheduled for 2013 is actually going to happen in 2014. The sell off in bonds that ran for the first eight months of the year put the fear of god into investors and managers alike. It?s not for nothing that bond giant PIMCO?s Bill Gross says that he expects to get ?ashes in my stocking for Christmas this year.?

Having been warned once on the risks entailed in a market that is coming off a 60 year high, bond owners don?t need to be told twice to sit down when the music stops playing. They have started to lighten up in a hurry.

December is turning into a ?Great Front Run of 2014.? To reallocate out of bonds into stocks in 2014, you have to start selling your bonds now. That means that bonds could remain weak for the rest of 2013, possibly even taking the ten year yield all the way back up to 3.0% again. Hence, my aggressive selling.

If I am right about this scenario, the flipside for stocks could be even more important. It augurs for a narrow, low volume, sideways correcting stock market for a few more weeks, then a blast to the upside into year-end. A Standard and Poor?s 500 of 1,800 becomes a chip shot, and with two months to run, it could even make it as high as 1,850. There is a global synchronized recovery on the table for 2014 and everyone and his brother wants to participate.

My only concern here is that we are pulling forward performance from 2014 into this year that will ultimately make next year harder to trade.

TNX 11-1-13

LQD 10-31-13

HYG 10-31-13

LINE 11-4-13

Musical ChairsSo Who?s Selling Their Bonds First?

https://www.madhedgefundtrader.com/wp-content/uploads/2013/11/Musical-Chairs.jpg 283 473 Mad Hedge Fund Trader https://madhedgefundtrader.com/wp-content/uploads/2019/05/cropped-mad-hedge-logo-transparent-192x192_f9578834168ba24df3eb53916a12c882.png Mad Hedge Fund Trader2013-11-05 01:04:202013-11-05 01:04:20Why I?m Hammering the Bond Market
Mad Hedge Fund Trader

More of the Same from Uncle Ben

Diary, Newsletter

Ben Bernanke delivered exactly what I expected today, continuing his massively simulative monetary policy as is. The taper went missing in action, and search parties have been already sent out by the bears.

In the past this move would have triggered a massive move up in risk assets, and a collapse of the bond market, but not this time. Bernanke's news is not exactly new, and leaving things unchanged doesn't exactly prompt frenetic bouts of volatility. We are also in the summer doldrums, with much of the market liquidity now competing in company golf tournaments, gorging at clambakes, or topping up tans at the beach.

What this sets up is a rather dreary season of trading inside narrow ranges. The S&P 500 (SPY) will bounce along like a ping pong ball between 1,580 and $1,680, the ten year Treasury bond (TLT), (TBT) within 1.90%-2.40%, the yen (FXY), (YCS) inside ?98-?104, and gold (GLD) trapped inside $1,250-$1,480.

You can trade outside of these ranges with alternating call and put spreads and take in some modest returns. Or you can conclude that the risk/reward is mediocre at best, and join you friends on vacation. You don't fool me. When I send out my newsletter these days, those "Out of Office" messages are breaking out like sunburns at Coney Island, Navy Pier, and the Santa Cruz Boardwalk.

I think the markets are reserving their real fireworks for us in the coming fall. If the Federal Reserve's economic forecast is correct, we are headed towards a 2015 GDP growth rate of 2.9%-3.6%, an unemployment rate of 5.2%, and an inflation rate on only 1.6%-2.0%. That is a best case, "golden age" type scenario for the financial markets which leaves the Great Recession well in the dust of the rear view mirror.

The "Big Tell" here is the Fed's inflationary expectations rate. They are close to nil. The august government agency thinks that even a return to the long term average US economic growth rate above 3% won't ignite a wildfire of price hikes. That greenlights a continued pedal to the metal on monetary stimulus, and highlights the unemployment rate as the top priority.

These predictions would give us the launching pad for risk assets to commence a nice yearend rally. That would take the S&P 500 to $1,750, bond yield to $2.50%, the yen to ?110, and gold down to $1,100, much to the chagrin of gold bugs everywhere.

What was the biggest move today? My short position in the Japanese yen, which plunged a full 2% as Bernanke spoke. Sometimes fairy tales come true after all.

IEF 6-18-13


TNX 6-18-13


TNX a 6-18-13


SPY 6-19-13

https://www.madhedgefundtrader.com/wp-content/uploads/2013/03/Ben-Bernanke.jpg 277 197 Mad Hedge Fund Trader https://madhedgefundtrader.com/wp-content/uploads/2019/05/cropped-mad-hedge-logo-transparent-192x192_f9578834168ba24df3eb53916a12c882.png Mad Hedge Fund Trader2013-06-20 12:48:102013-06-20 12:48:10More of the Same from Uncle Ben
Mad Hedge Fund Trader

Ben?s New Leg for the Bull Market

Newsletter

I just returned from my round of monthly wine club pick-ups in California?s lush and fertile Napa Valley. I invested a half hour soaking up the breathtaking views at the hilltop Silverado winery. Duckhorn offered a lavish lunch event, which I ducked out on. The Wagner family is prospering as always, recently opening a tasting room for their spectacular Caymus private label. The trunk of my electric Tesla S-1 is brimming over with fine cabernet, merlot, pinot noir, and the odd zinfandel.

Driving through rolling hills of ripening grapevines also gave me time to digest and contemplate the implications of the dramatic events of last Friday. The Department of Labor announced a bombshell of an April nonfarm payroll, showing 165,000 in job gains in the face of dire expectations, taking the headline unemployment rate down to 7.5%, a four year low.

Far more important were the dope slapping revisions of prior months. February was taken up from a healthy 268,000 to an eye popping 332,000. As if by magic, March was boosted from a feeble 88,000 to a more robust 138,000.

I made a nice killing with my long positions in Apple (AAPL) and the S&P 500 (SPY). But I also suffered painful stop outs in my short positions in the Russell 2000 (IWM), which only had two weeks to run to expiration, sending my performance for the month down in flames. Such is the risk of betting on this notoriously volatile and always revised data point. If you play with fire, you get burned.

There were 50 data points warning that the April nonfarm payroll was going to be a disaster, the details of which you can find in my most recently posted Global Strategy Webinar. They all painted a picture of an undeniably weakening economy, paving the way for a nice ?Sell in May? and a following summer correction right on schedule.

That?s why, to a man, every hedge fund trader went into the Friday release net short. So when the announcement came, the short covering was fast and furious. And it occurred across all asset classes simultaneously. Stocks of every description and commodities (CU) soared, while the Japanese yen (FXY) (YCS) and the Treasury bond market (TLT) cratered. Only the precious metals of gold (GLD) and silver (SLV) remained moribund, still working off a long hangover.

It turns out that I was not the only one who noticed the soggy economic data. It also caught the attention of Fed governor, Ben Bernanke, ECB president, Mario Draghi, and BOJ governor, Haruhiko Kuroda, who together launched a trifecta of coordinated rescue measures designed to provide emergency life support for the flagging recovery.

In the Fed minutes released on Wednesday, Uncle Ben suggested that he might actually increase monetary easing. The European Central Bank, in a better late than never move, finally cut Euro interest rates by 25 basis points. An indiscreet minister also hinted that negative Euro interest rates might be in the cards. Of course, burning all the shorts was part and parcel of this program.

So we now have to ask, what happens next? Welcome to an S&P 500 earnings multiple of 16, a figure not seen for six years! With zero interest rates, global monetary easing still expanding, and the rest of the world tripping over each other to buy American stocks, higher multiples are in the cards. Stocks that seem richly priced to us here seem unbelievably cheap to every one else.

How high is high? One old trader?s rule of thumb says that every multiple year breakout is worth at least 10%. That takes the (SPY) up to 1,760, and the Dow average to 16,500, possibly by year end. Instead of the major 5%-10% corrections investors have been expecting all year, we may continue to get sideways time corrections before each leg up.

There also seems to be another factor at work here. Every time I take a run at a 40% return, I get thrown back. It has already happened twice this year. It?s as if 40% is an unnatural act requiring incantations in strange tongues to surpass. Black swans come out of nowhere, as do the shocks and surprises. You can do all the work in the world in these conditions, and it often ends of being for free.

That?s why in past years, when I was running my big hedge fund, I would quit for the year whenever I approached the 40% level. I then sent a letter to my investors saying I?m not working anymore until I got paid my performance bonus off of the lofty numbers. I then proceeded to take extended vacations, sending my investors postcards from exotic locales.

They all loved it.

SPY 5-3-13

TNX 5-3-13

Crystal Ball Bring Me That 40%

https://www.madhedgefundtrader.com/wp-content/uploads/2013/05/Crystal-Ball.jpg 204 306 Mad Hedge Fund Trader https://madhedgefundtrader.com/wp-content/uploads/2019/05/cropped-mad-hedge-logo-transparent-192x192_f9578834168ba24df3eb53916a12c882.png Mad Hedge Fund Trader2013-05-06 09:18:252013-05-06 09:18:25Ben?s New Leg for the Bull Market
Mad Hedge Fund Trader

The Bond Crash Has Only Just Started

Newsletter

When I was a little kid in the early 1950?s, my grandfather used to endlessly rail against Franklin Delano Roosevelt. The WWI veteran, who was mustard gassed in the trenches of France and was a lifetime, died in the wool Republican, said the former president was a dictator and a traitor to his class, who trampled the constitution with complete disregard. Hoover, Landon, and Dewey would have done much better jobs.

What was worse, FDR had run up such enormous debts during the Great Depression that not only my life would be ruined, so would my children?s lives. As a six year old, this disturbed me quite a lot, as it appeared that just out of diapers, my life was already pointless. Grandpa continued his ranting until a three pack a day Lucky Strike non-filter addiction finally killed him in 1977.

What my grandfather?s comments did do was spark in me a permanent interest in the government bond market, not only ours, but everyone else?s around the world. So what ever happened to the Roosevelt debt?

In short, it went to money heaven. And here I like to use the old movie analogy. Remember, when someone walks into a diner in those old black and white flicks? Check out the prices on the menu on the wall. It says ?Coffee: 5 cents, Hamburgers: 10 cents, Steak: 50 cents.?

That is where the Roosevelt debt went. By the time the 20 and 30 year Treasury bonds issued in the 1930?s came due, WWII, Korea, and Vietnam ?happened and the great inflation that followed. The purchasing power of the dollar cratered, falling roughly 90%, Coffee was now $1.00, a hamburger $2.00, and a Steak $10.00. The government, in effect, only had to pay back 10 cents on the dollar in terms of current purchasing power on whatever it borrowed in the thirties.

Who paid for this free lunch? Bond owners, who received, minimal, and often negative real, inflation adjusted returns on fixed income investments for three decades.

This is not a new thing. About 300 years ago, governments figured out there was easy money to be had by issuing paper money, borrowing massively, stimulating the local economy, and then repaying the debt in devalued currency. This is one of the main reasons why we have governments, and why they have grown so big. Unsurprisingly, France was the first, followed by England and every other major country.

The really fascinating thing about financial markets so far this year is that I see history repeating itself. Owners of bonds have had a terrible start, and things are about to get much worse.

The 30-year Treasury bond suffered a 3% loss in January. That means it has already lost its coupon for the year. Bondholders can expect to receive a long series of rude awakenings when they get their monthly statements. No wonder Bill Gross, the head of bond giant, PIMCO, says he expects to get ashes in his stocking for Christmas this year.

The scary thing is that we could be only six months into a new 30-year bear market for bonds that lasts all the way until 2042. This is certainly what the demographics are saying, which predicts an inflationary blow off in decades to come that could take Treasury yields to a nosebleed 18% high. That scenario has the leveraged short Treasury bond ETF (TBT), which has just leapt from $59 to $69, soaring all the way to $200.

Check out the chart below, and it is clear that the downtrend in long term Treasury bond yields going all the way back to April, 2011 is broken, and that we are now headed substantially up. The old resistance level at 1.95% now becomes support. That targets a new range for bonds of 1.90%-2.40%, possibly for the rest of 2013.

There is a lesson to be learned today from the demise of the Roosevelt debt. It tells us that the government should be borrowing as much as it can right now with the longest maturity possible at these ultra low interest rates, and spending it all.

If I were king of the world, I would borrow $5 trillion tomorrow and disburse it only in areas that create domestic US jobs. Not a penny should go to new social programs. Long-term capital investments should be the sole target. Here is my shopping list:

$1 trillion ? new Interstate freeway system
$1 trillion ? additional infrastructure repairs and maintenance
$1 trillion ? conversion of our transportation system to natural gas
$1 trillion ? construction of a rural broadband network
$1 trillion ? investment in R&D for everything

The projects above would create 5 million new jobs and end the present employment crisis. Who would pay for all of this? Today?s investors in government bonds, half of whom are foreigners, especially the Chinese and Japanese.

Whatever happened to my life? Was it ruined, as my grandfather predicted? Actually, I did pretty well, as did the rest of my generation, the baby boomers. My kids did OK too. Grandpa was always a better historian than a forecaster. But he did make a fortune in real estate, betting on the inflation that always follows borrowing binges.

TNX 2-13-13

TLT 2-13-13

TBT 2-13-13

Grandpa Thomas

Grandpa (Right) in 1916 Was a Better Historian Than Forecaster

https://www.madhedgefundtrader.com/wp-content/uploads/2013/02/Grandpa-Thomas.jpg 606 413 Mad Hedge Fund Trader https://madhedgefundtrader.com/wp-content/uploads/2019/05/cropped-mad-hedge-logo-transparent-192x192_f9578834168ba24df3eb53916a12c882.png Mad Hedge Fund Trader2013-02-14 23:02:262013-02-14 23:02:26The Bond Crash Has Only Just Started
Mad Hedge Fund Trader

Bonds are Breaking Down All Over

Diary, Newsletter

It looks like the Great Bond Reallocation of 2013 is real. The Treasury bond market is getting absolutely hammered this morning, the ten-year yield breaching 2.00%. That smashes the 1.40%-1.90% band, which has imprisoned the bond market for the past year.

The immediate trigger was the release of absolute blowout December durable goods figures this morning. They came in at a red hot 4.6%, versus an expected 2.0%. It is clear that companies are ramping up capital investment and hiring, now that the shackles of the presidential election, the fiscal cliff, and the debt ceiling crisis, have been thrown off. We?ll see the other shoe fall on Friday, when the January nonfarm payroll is released, which collapsing weekly jobless claims are predicting will be surging as well.

Cash flows into equity mutual funds and ETF?s for January have already exceeded $55 billion, and will easily close out the month as the largest in history. Yet, the move has been so fast, going up virtually every day this year, that many investors have been left on the sidelines.

Much of this money is coming from cash accounts that were topped up during the tax loss selling at the end of 2012. But there is no doubt that a major chunk is now coming out of bonds. That is what the market is screaming at us loud and clear today.

I don?t expect an immediate bond market crash here. We?ll more likely see a move up to a new trading band of $1.90%-$2.50%. So there is plenty of time to trim back positions. But the long build up here is so gargantuan, it could take 20-30 years to unwind, as it did last time, from 1948. The message here is that you should be slamming every bond market rally for the rest of 2013.

I am posting yesterday?s yields from a range of high yield instruments so I can look back on my own website in five years and see how insanely low they once were.

(TLT) ? 2.66% iShares Barclays 20+ Year Treasury Bond ETF

(MUB) ? 2.89% iShares S&P National AMT-Free Muni Bond ETF

(LQD)? - 3.83% iShares iBoxx $ Investment Grade Corporate Bond ETF

(HCN) ? 4.70% Health Care REIT, Inc.

(AMJ) ? 5.35% JP Morgan Alerian MLP Index ETN

(JNK) ? 6.78% SPDR Barclays High Yield Bond ETF

TNX 1-25-13

TLT 1-25-13

https://www.madhedgefundtrader.com/wp-content/uploads/2013/01/TNX-1-25-13.jpg 491 589 Mad Hedge Fund Trader https://madhedgefundtrader.com/wp-content/uploads/2019/05/cropped-mad-hedge-logo-transparent-192x192_f9578834168ba24df3eb53916a12c882.png Mad Hedge Fund Trader2013-01-28 23:02:492013-01-28 23:02:49Bonds are Breaking Down All Over
Mad Hedge Fund Trader

SPX 1,600, Here We Come!

Diary, Newsletter

Take a look at the chart below for the S&P 500, and it is clear that we are gunning for an all time high between 1,550 and 1,600. With the debt ceiling crisis now cancelled, you really have to look hard to find any near term reasons to sell stocks, so we could hit those lofty numbers as early as March.

A perusal of the short-term charts certainly demands one to conclude that we are overbought. The Relative Strength Indicator has just hit 70%, normally a signal that we are reaching an interim top. However, the RSI can stay elevated for an extended period of time and trade as high as 80 before the downside risks show their ugly face. That could be months off.

In the meantime, we could see some sort of correction. But it is more likely to be a time correction, not a price one. That has the market moving sideways in an agonizing, tortuous, narrowing range on declining volume for a while before launching on another leg up.

This year?s rally occurred so quickly that a lot of money was left on the sidelines, especially with the largest managers. That is why we have seen no meaningful corrections so far. This condition could remain all the way out until April.

It is likely that traders are going to keep ramping up this market until the January month end book closing. That sets up a quiet February. The deep-in-the-money options that I have been recommending to readers are ideally suited for this falling volatility environment. They reach their maximum point of profitability, whether the market goes up, sideways, or down small.

You see confirmation of this analysis everywhere you look. Treasury bonds (TLT) can?t catch a bid, and are clearly threatening to break out above the 1.90% yield band that has prevailed for the past year. The Volatility Index (VIX) hit another new five year low today at $12.40. Oil (USO) just hit a multi month high. It all points to stock prices that will remain on an upward path for the foreseeable future.

I think I?ll buy more stocks and then go drive my new Tesla around the mountain.

SPX 1-23-13

SPX 1-23-13a

INDU 1-23-13

TNX 1-23-13

VIX 1-23-13

TESLA
A Tesla S-1 Performance

https://www.madhedgefundtrader.com/wp-content/uploads/2013/01/TESLA.jpg 398 588 Mad Hedge Fund Trader https://madhedgefundtrader.com/wp-content/uploads/2019/05/cropped-mad-hedge-logo-transparent-192x192_f9578834168ba24df3eb53916a12c882.png Mad Hedge Fund Trader2013-01-24 09:28:322013-01-24 09:28:32SPX 1,600, Here We Come!
DougD

Be Careful What You Wish For

Newsletter

The wild whipsaw movements in the markets on Thursday reminded us once again how dependent they have become on monetary stimulus from central banks. As if we needed reminding. Almost simultaneously, officials from the US, Japan and the UK hinted at a coordinated move at this weekend?s G-20 meeting in Cabo San Lucas, Mexico.

Let?s hope for the sake of global financial stability that no one eats a bad taco down there. And say ?Hello? to Miguel for me at the notorious drinking establishment, The Giggling Marlin. Just make sure he doesn?t pick your pocket when he hangs you upside down by your ankles with a block and tackle to give you a tequila shot.

The rumors were enough to cause me to cover my sole remaining short position in the S&P 500 (SPY) and bat out some additional shorts in the Japanese yen, which would go into free fall in such a scenario. If the rumors are true, they will take the (SPX) up to 1,400 and I will make a killing on my hefty long positions in (AAPL), (HPQ), (JPM), (DIS) and shorts in (FXY) and (TLT). If not, then the large cap index will revisit 1,290 one more time and I will be left looking like a dummy while posting an embellished resume on Craig?s List.

To see how closely risk assets are correlated with quantitative easing, take a look at the chart produced below by my friend, Dennis Gartman of The Gartman Letter. It graphically presents the market response to QE1, QE2, and Operation Twist, which are highlighted in green. In fact, quantitative easing has become the on/off switch of the financial markets. Hence, we get ?RISK ON?/?RISK OFF? gyrations in spades.

While on the topic of monetary policy, let?s consider the implications of a Romney win in the November presidential election. The former Massachusetts governor and son of a Michigan governor has said that he would fire Federal Reserve Governor, Ben Bernanke, on his first day in office.

Well, he actually can?t do that, although it is great fodder for the faithful on the hustings. What he can do is appoint and anti QE, pro-austerity replacement when Ben?s second four year term is up on January 31, 2014. At the top of the list of replacements are Stanford University?s John Taylor of Taylor Rule fame and sitting non-voting board member, president of the Dallas Fed, and noted hawk, Richard Fisher.

How would the financial markets react? Much of the recent buying of stocks and other risk assets has been on the assumption that the ?Bernanke Put? would kick in on any serious selloff. No Bernanke means no Bernanke put. I can already hear portfolio managers thinking ?What, you mean there is risk in these things?? and heading for the exits as quickly as possible. The resulting market crash could make 2008-2009 look like a cakewalk. Your 401k would rapidly shrink to a 201k, and your IRA would become DOA. So be careful what you wish for.

That is unless you are a reader of this letter and a subscriber to my Trade Alert Service. Such a market meltdown would be one of the great shorting opportunities of the century. But to follow the game you have to have a program.


Time for Another Shot of Monetary easing

https://www.madhedgefundtrader.com/wp-content/uploads/2012/06/2000306-Hanging_with_the_best_of_them_Cabo_San_Lucas.jpg 299 400 DougD https://madhedgefundtrader.com/wp-content/uploads/2019/05/cropped-mad-hedge-logo-transparent-192x192_f9578834168ba24df3eb53916a12c882.png DougD2012-06-14 23:03:552012-06-14 23:03:55Be Careful What You Wish For
DougD

My Tactical View of the Market

Newsletter

The abject failure of the equity indexes to breach even the first line of upside resistance does not bode well for the ?RISK ON? trade at all. Only a week ago I predicted that the markets would be challenged to top 1,340 in the (SPX) and $78 for the Russell 2000 (IWM). In fact, we made it up only to 1,335 and $77.90 respectively.

To see the melt down resume ahead of the month end window dressing is particularly concerning. That?s the one day a month that investors really try to pretend that everything is alright. People just can?t wait to sell.

Blame Europe again, which saw Spanish bond yields reach a 6.6% yield on the ten year and the Italian bond market roll over like the ?Roma? (a WWII battleship sunk by the Germans while trying to surrender to the Allies). Facebook didn?t help, knocking another $8 billion off its market capitalization, further souring sentiment.

Urging traders to head for the exits was confirming weakness across the entire asset class universe. The Euro is in free fall. Copper took a dive. Oil is plumbing new 2012 lows. Treasury bond prices rocketed, taking ten year yields to new all-time lows at 1.65%. It all adds up to a big giant ?SELL!?

It is just a matter of days before we revisit the (SPX) 200 day moving average at 1,280. Thereafter, the big Fibonacci level at 1,250 kicks in. It is also exactly one half the move off of the October 2011 low, and unchanged on the year for 2012.
I am not looking for a major crash here a la 2011. There is just not enough leverage and hot long positions in the system to take us down to 1,060. It will be a case of thrice burned, four times warned. And remember, last year?s 1,060 is this year?s 1,100, thanks to the earnings growth we have seen since then. With 56% of all S&P 500 stocks now yielding more than the ten year Treasury bond, you don?t want to be as aggressive on the short side as in past years, when bond yields were 4 or higher.

By adding on a short in the (SPY) here, I am also hedging my ?RISK ON? exposure in the deep in-the-money call spreads in (AAPL), (HPQ), and (JPM), and my (FXY) puts. The delta on these out-of-the-money?s are so low that I can hedge the lot with one small 5% position in the at-the-money (SPY) puts.

If the (SPX) hits 1,280, the (SPY) puts will add 2.25% to our year to date performance. At 1,250 we pick up 4.00% and at 1,200 we earn 7.00%. I now have the option to come out at any of these points if the opportunity presents itself, depending on how the rapidly changing global macro situation unfolds. If we get another pop from here back up to the 1,340-1,360 range, I will double up the position and swing for the fences. There?s no way we are taking a run at new highs for the year from here.

Below, find today?s charts from my friends at www.StockCharts.com with appropriate support and resistance levels outlined. If I may make another observation, when you see the technicals work as well as they have done recently, it is only because the real long term end investors have fled. There are not enough cash flows in the market to overwhelm even the nearest pivot points. That leaves hedge fund, day, and high frequency traders to key off of the obvious turning points in the market. That also is not good for the rest of us.


It?s a good thing that I?m not greedy. If I had sold short a near money call spread for the (TLT) on May 23, I would be in a world of hurt right now. Instead, I went six point out of the money. So when we get dramatic moves like we saw today that take bond yields to all-time lows, I can just sit back and say, ?Isn?t that interesting.? This spread expired in six trading days, which should be enough time to digest the big move today and expire safely out of the money and worthless. What?s better, I can then renew the trade at better strikes after expiration into the July?s and take in more money.

If you are wondering why I am not doubling up on the short Treasury bond ETF (TBT) down here, it?s because it doesn?t have enough leverage. In these conditions you need to go for instruments that can generate immediate and large profits, such as through the options market. The topping process for the Treasury market could go on for another month or two. Until that ends, I am happy to use price spikes like today?s to sell short limited risk (TLT) call spreads 6-8 points out of the money, which can handle a 20 basis point drop in yields and still make you money.

If you own the (TBT) and are willing to take a multi month view, you should be doubling up here. This ETF will have its day in the sun, it is just not today. We could see the $20 handle again and maybe even $30 within the next year. That makes it a potential ten bagger off of today?s close.


I don?t want to touch gold (GLD) or silver here. The barbarous relic is clearly trying to base at $1,500 an ounce. If it fails, it will probably only go down to only $1,450 before major Asian central bank buying kicks in. Better to admire it from afar, or limit your activity to early Christmas shopping for your significant other. We are months away from the next major rally in the yellow metal.


The Roma

Time to Puke Out Again


https://www.madhedgefundtrader.com/wp-content/uploads/2012/05/300px-Italian_battleship_Roma_1940_starboard_bow_view.jpg 164 300 DougD https://madhedgefundtrader.com/wp-content/uploads/2019/05/cropped-mad-hedge-logo-transparent-192x192_f9578834168ba24df3eb53916a12c882.png DougD2012-05-30 23:02:052012-05-30 23:02:05My Tactical View of the Market
DougD

The Bombshells Headed Our Way

Newsletter

This certainly promises to be an interesting week for the markets. On Thursday, we get the Department of Labor?s weekly jobless claims at 8:30 AM EST. If we clock a fourth consecutive week over 380,000, or go even higher, then an exact repeat for last year?s summer slowdown will be in play. So will the 25% drop in equity markets that followed.

This will be confirmed by an April nonfarm payroll of less than 100,000, the result of hiring being pulled forward into January and February by the warm winter, and then puffed up by the seasonal adjustment process.

This will bolster the relentless torrent of negative economic data that has been rapidly deteriorating for the last two months, which no one seems to be noticing but me. Here is the latest batch:

April 30 - Chicago Purchasing Managers Index down from 62.2 in March to 56.2 in April

April 30 - Personal Spending fell from 0.9% in February to 0.3% in March

April 27 - The real shocker was that Q1, 2012 GDP fell out of the bottom at 2.2%, compared to an earlier prediction of 2.5%, and a 3.0% rate before that. The current quarter is now expected to fall to the 1% handle.

April 26 - Weekly jobless claims stayed at a high 388,000.

April 25? - March durable goods fell -4.2%, in part due to a decline in domestic aircraft orders.

The corporate Q1 earnings reports are winding down, and look like they will come in bang on my 5% prediction. This is down substantially from last year?s 15% rate. When these reports finish, where is the next upside surprise coming from? In almost every case, each announcement generated a lot of selling on the news.

Permabulls beware: Rising multiples against falling earnings growth doesn?t go on for very long. Please note also that Treasury bond yields have given up all their gains this year and are poised to break to the low end of their one year range. This usually heralds a major ?RISK OFF? move bad for asset prices everywhere.

In case you didn?t have enough to worry about, on Sunday we get the French presidential election, where Socialist Fran?ois Hollande is leading conservative Nicolas Sarkozy by an impressive eight points. A much bigger borrowing and spending government in France could trigger the next wave of the European sovereign debt crisis, and lots of those riots that stock traders despise. Better take your significant other out to a French restaurant on Saturday night because it may not be there on Sunday.

It is possible that the data suddenly turn on a dime and return to an improving trend. But it is also possible that pigs fly. As for me, I?ve already got my weekend reservations at San Francisco?s Gary Danko?s. Frogs, hang on to your legs!


https://www.madhedgefundtrader.com/wp-content/uploads/2012/04/425AirportFlyingPigs.jpg 400 383 DougD https://madhedgefundtrader.com/wp-content/uploads/2019/05/cropped-mad-hedge-logo-transparent-192x192_f9578834168ba24df3eb53916a12c882.png DougD2012-04-30 23:03:322012-04-30 23:03:32The Bombshells Headed Our Way
DougD

Time to Pick up Some (TBT)

Diary

This is the year of the one way move. That has been the harsh lesson of the marketplace since trading commenced at the New Year. We have seen this in Apple, the S&P 500, the Japanese yen, bank shares, natural gas, the volatility index, and now it looks like the Treasury bond market.

Once a move starts, it continues in a straight line. There are no pull backs, corrections, or chances for newcomers to join the party. It is all momentum, or ?momo? as the pit traders refer to it. You either have to close your eyes and buy, or read about it in the newspapers while you are fielding calls from clients complaining about underperformance.

While I am reluctant to buy highs in other asset classes, not so with short Treasury bond plays like the (TBT). The long term case is against Treasury bonds, which have been paying negative real interest rates for years now, is overwhelming. If the (TBT) pulls back 10% from here, I will happily double up.

If you want to read about Treasury bonds, warts and all, please refer to last week?s piece, ?The Structural Bear Case for Treasury Bonds? by clicking here.

There are many reasons why the markets are behaving like this. Volumes are low. Conviction is low. The big volume generators, like the high frequency traders, have departed for friendlier climes, like the foreign exchange and oil markets. Hedge fund traders are out until their models start working again. Individual investors are still back at the station waiting for the next train, having spent the last decade unloading stocks.

The markets aren?t rising because of a new surge of cash coming into the market. Rather, a lack of sellers is the cause, as almost everyone is underweight equities. It only takes a small amount of money coming in from performance chasers to cause the indexes to rise.

It is impossible to say how long the markets will last like this. They will continue until they don?t. There is no quantifying human emotion. Until then, I will keep my book relatively small. I can tell you that when the geniuses look like idiots and the idiots look like geniuses, markets can be very dangerous.


https://www.madhedgefundtrader.com/wp-content/uploads/2012/03/tbt-18.png 530 700 DougD https://madhedgefundtrader.com/wp-content/uploads/2019/05/cropped-mad-hedge-logo-transparent-192x192_f9578834168ba24df3eb53916a12c882.png DougD2012-03-19 23:05:512012-03-19 23:05:51Time to Pick up Some (TBT)
Page 8 of 8«‹678

tastytrade, Inc. (“tastytrade”) has entered into a Marketing Agreement with Mad Hedge Fund Trader (“Marketing Agent”) whereby tastytrade pays compensation to Marketing Agent to recommend tastytrade’s brokerage services. The existence of this Marketing Agreement should not be deemed as an endorsement or recommendation of Marketing Agent by tastytrade and/or any of its affiliated companies. Neither tastytrade nor any of its affiliated companies is responsible for the privacy practices of Marketing Agent or this website. tastytrade does not warrant the accuracy or content of the products or services offered by Marketing Agent or this website. Marketing Agent is independent and is not an affiliate of tastytrade. 

Legal Disclaimer

There is a very high degree of risk involved in trading. Past results are not indicative of future returns. MadHedgeFundTrader.com and all individuals affiliated with this site assume no responsibilities for your trading and investment results. The indicators, strategies, columns, articles and all other features are for educational purposes only and should not be construed as investment advice. Information for futures trading observations are obtained from sources believed to be reliable, but we do not warrant its completeness or accuracy, or warrant any results from the use of the information. Your use of the trading observations is entirely at your own risk and it is your sole responsibility to evaluate the accuracy, completeness and usefulness of the information. You must assess the risk of any trade with your broker and make your own independent decisions regarding any securities mentioned herein. Affiliates of MadHedgeFundTrader.com may have a position or effect transactions in the securities described herein (or options thereon) and/or otherwise employ trading strategies that may be consistent or inconsistent with the provided strategies.

Copyright © 2025. Mad Hedge Fund Trader. All Rights Reserved. support@madhedgefundtrader.com
  • Privacy Policy
  • Disclaimer
  • FAQ
Scroll to top