I think that oil peaked last week with the Egyptian Army?s ferocious and bloody attack on the Muslim Brotherhood. I hate to sound cynical here, but count the daily bodies in the street, which has been trending down sharply since Thursday?s, 1,000 plus tally. Fewer bodies mean lower oil prices.
This has most likely broken the back of the fundamentalist opposition movement for at least the time being, which has accounted for the $20 spike in oil prices over the last two months.
This returns us to the longer term fundamental trend for oil, which is sideways at best, and down at worst. The US is flooding the world?s oil markets with energy in all its many forms. The driver here is American fracking technology, which will continue to upend the traditional energy markets for decades to come. It?s just a matter of time before fracking goes mainstream in Europe, especially in the big coal countries of Germany, Poland, and England. Then they can thumb their noses at Russia, a major gas supplier over the last thirty years. China will follow.
In a crucial news item that wasn?t reported nationally, the California legislature voted down a measure to ban hydraulic fracturing in their state. It was defeated in a democratically controlled body. As the Golden State is the most anti energy state in the country, this gives the state a flashing green light to move forward against environmentalist opposition. There is a ton more of new supply coming. This is what the weakness in the price of natural gas is telling you (UNG).
We also received a new negative for oil this month, the collapse of the emerging market currencies, stock markets, and bonds, especially the Indian rupee. This reduces their international purchasing power in US dollar terms, thus raising the cost of oil in local currency terms. You see, oil is priced in dollars. As the emerging markets have seen the largest growth in demand for oil in recent years, this can only be bad for prices.
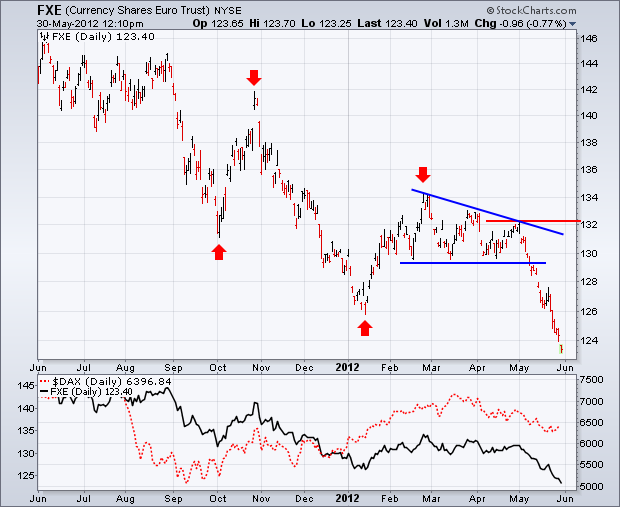
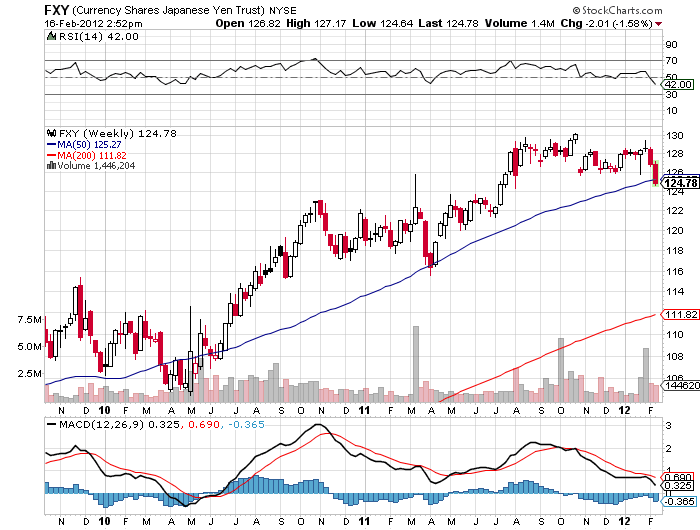
In terms of my own trading portfolio, I want to have a ?RISK OFF? position, like an oil short, to hedge my two existing ?RISK ON? positions in the Euro (FXE) and the yen (FXY) shorts. US stock markets could be weak into September, and they will take oil down with them.
The energy inventory figures released on Wednesday were another tell. Oil came in line with a 1.5 million barrel weekly draw down. But gasoline showed a precipitous 4 million barrel drop in supplies, meaning that more people are driving to their summer vacations than expected. Texas tea should have rallied at least $1 on the news. Instead it fell $1.50. It is an old trading nostrum that if a contract can?t rally on surprisingly positive developments, you sell the daylights out of it.
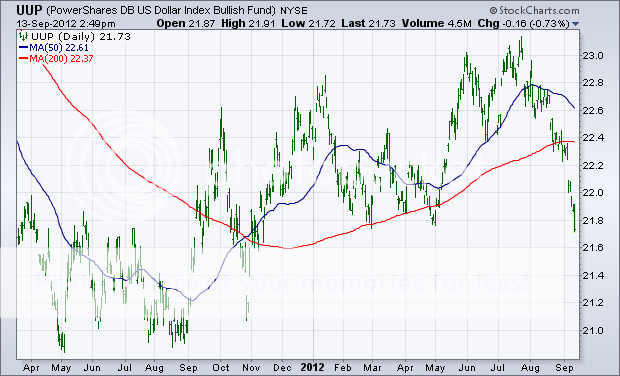
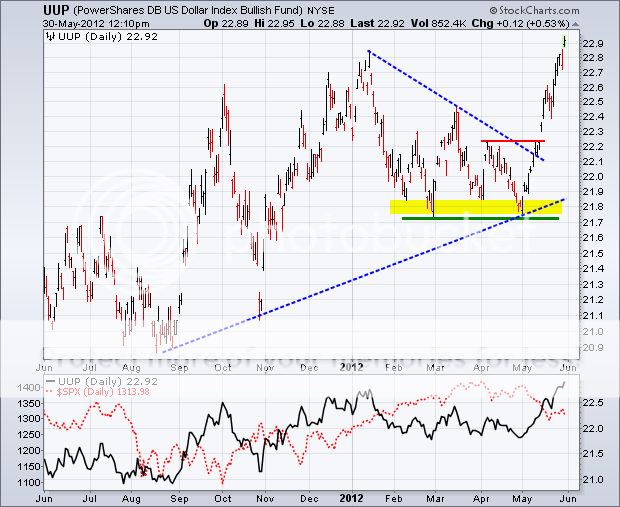
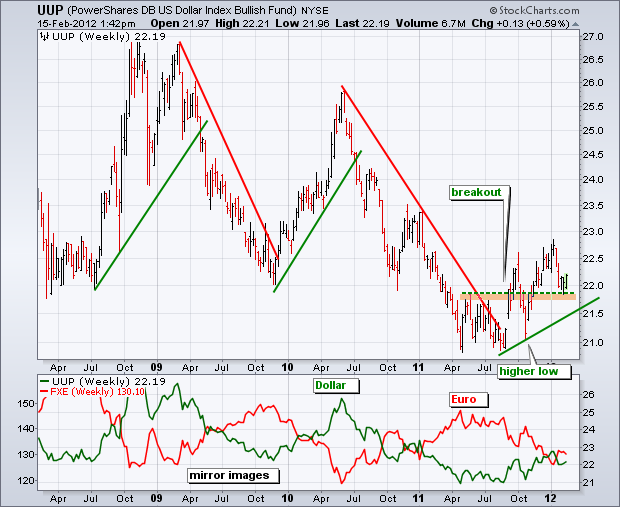
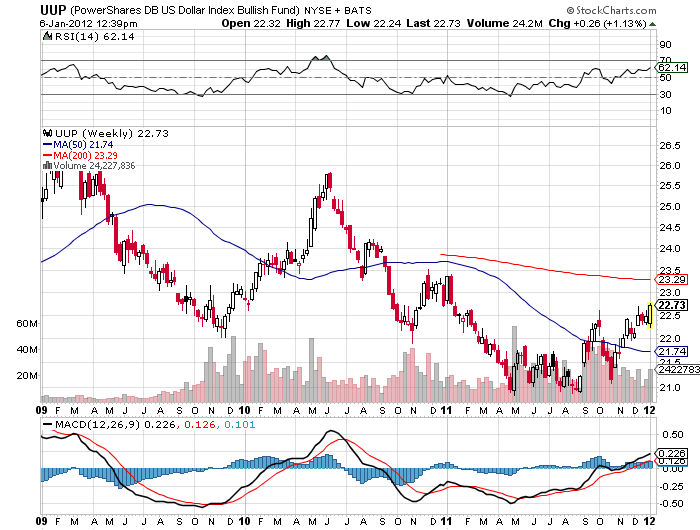
Below, you will find another chart that you should wake up and take notice of, the Powershares DB US Dollar Bullish Index Fund (UUP). Commodities traditionally are weak when the dollar is strong. Both the chart and the fundamentals suggest that we are close to a multiyear low for the greenback and are about to enter a prolonged period of dollar strength. This is also grim tidings for oil.
Finally, there is that last resort, the charts. Check out those for the (USO) and oil and it very much looks like we have a triple top in place. That is the straw that breaks the camel?s back. Time to sell.
The only way I am wrong on my oil call is if the Chinese economy is about to take off like a rocket. They are the marginal big swing player in this market. But there is absolutely no sign of that happening in the economic data. If anything, the collapse in emerging markets suggest that conditions in the Middle Kingdom are about to get worse before they get better.