Below please find subscribers’ Q&A for the Mad Hedge Fund Trader September 19 Global Strategy Webinar with my guest and co-host Bill Davis of the Mad Day Trader.
As usual, every asset class long and short was covered. You are certainly an inquisitive lot, and keep those questions coming!
Q: Do you expect a correction in the near term?
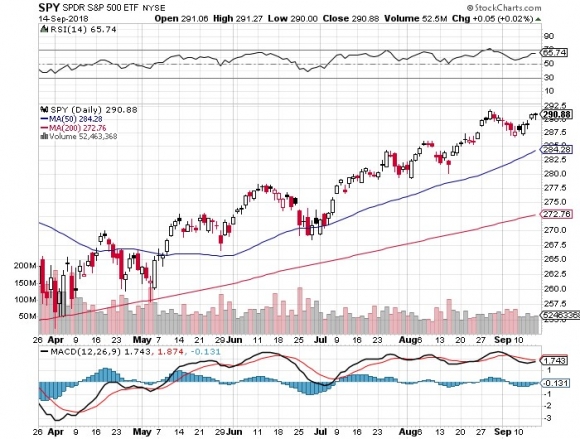
A: Yes. In fact, we may even see it in October. Markets (SPY) have been in extreme, overbought territory for a month now, the macro background is terrible, trade wars are accelerating, and interest rates are rising sharply. The only thing holding the market up is the prospect of one more quarter of good earnings, which companies start reporting next month. So once that’s out of the way, be careful, because people are just hanging on to the last final quarter before they sell.
Q: I just got out of my cannabis stock, what should I do now?
A: Thank your lucky stars you got away with that—it was an awful trade and you made money on it anyway. Stay away in droves. After all, the cannabis industry is all about growing a weed and how hard is that? This means the barriers to entry are zero. In fact, I’m thinking of growing some in my own backyard. My tomatoes do well, so why not Mary Jane?
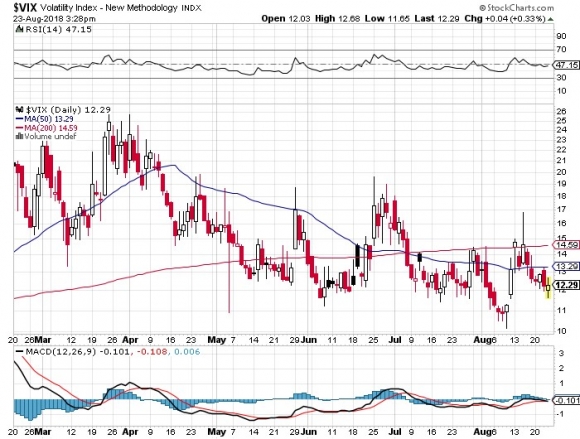
Q: The Volatility Index (VIX) is now at $11.79—should I buy?
A: No, the rule of thumb for the (VIX) is to wait for it to sit on a bottom for one to two weeks and let some time decay work itself out. You’ll see that in the ETF, the iPath S&P 500 VIX Short-Term Futures ETN (VXX). When it stops breaking to new lows, that means it’s ready for another bounce. I would wait.
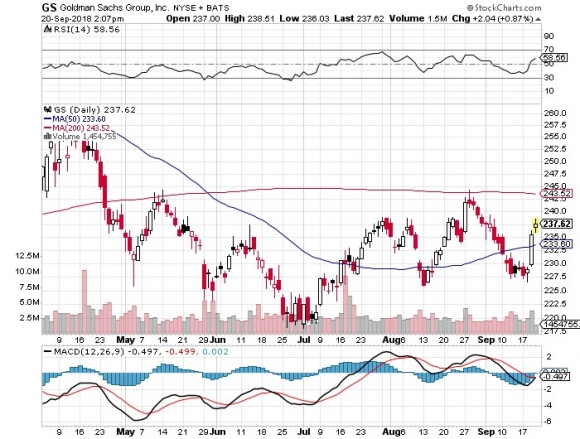
Q: What do you think about banks here? Is it time to get in?
A: No, these are not promising charts. If anything, I’d say Goldman Sachs (GS) is getting ready to do a head and shoulders and go to new lows. I would stay away from financials unless I see more positive evidence. The industry is ripe for disruption from fintech, which has already started. That’s said, they are way overdue for a dead cat bounce. That’s a trade, not an investment.
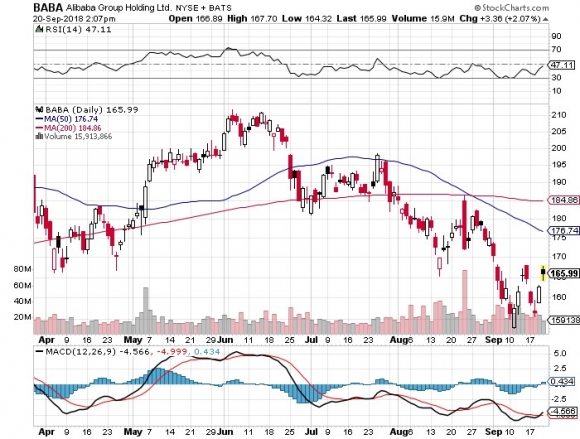
Q: Would you short Alibaba (BABA) and Baidu (BIDU) here?
A: No. Shorting is what I would have done six months ago; now it’s far too late. If anything, I would be a buyer of those stocks here, based on the possibility that we will see progress or an end to the trade war in the next couple of months. If the trade wars continue, they will put the U.S. in recession next year, and then you don’t want to own stocks anywhere.
Q: Is Apple (AAPL) going to get hit by the trade wars?
A: So far, this has not been the case, but they are whistling past the graveyard right now—an obvious target in the trade wars from both sides. For instance, the U.S. could suddenly start applying a 25% import duty to iPhones from China, which would make your $1,000 phone a $1,250 phone. Similarly, the Chinese could hit it in China, restricting their manufacturing in one way or another. I’m being very cautious of Apple for this reason. The stock already has one $10 drop just because of this worry.
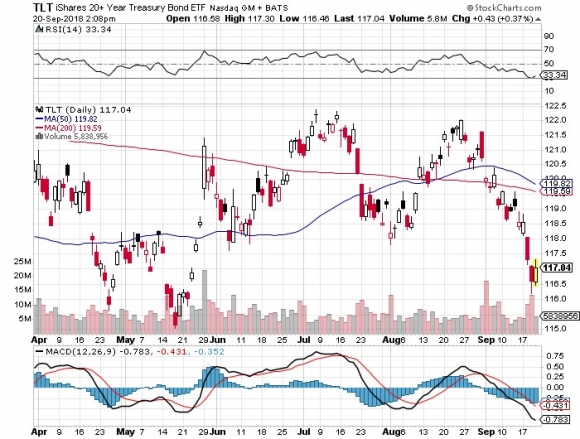
Q: Can the U.S. ban China from selling bonds?
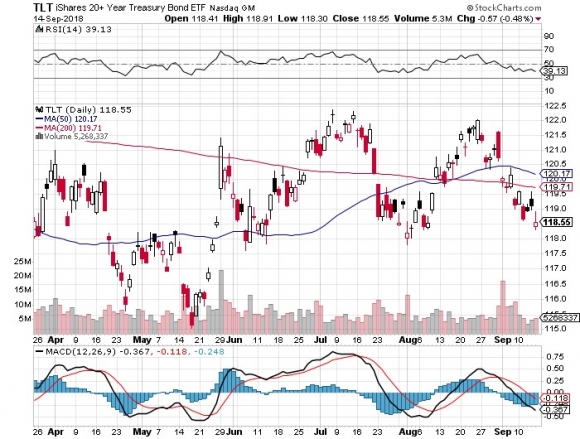
A: No, they can’t. The global U.S. Treasury bond market (TLT) is international by nature—there is no way to stop the selling. It would take a state of war to reach the point where the Fed actually seizes China’s U.S. Treasury bond holdings. The last time that happened was when Iran seized the U.S. embassy in Tehran in 1979. Iran didn’t get its money back until the Iran Nuclear Deal in 2015. Before that you have to go back to WWII, when the U.S. seized all German and Japanese assets. They never got those back.
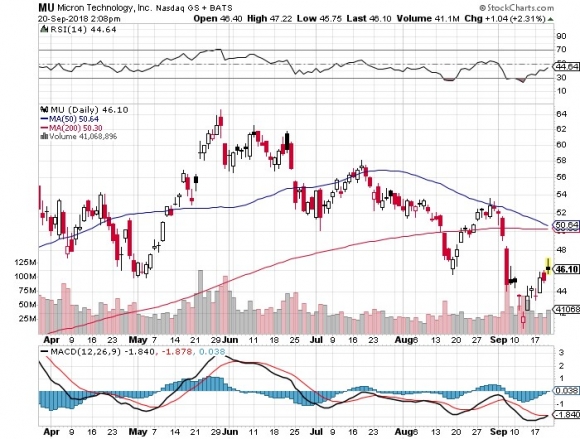
Q: What are your thoughts on the chip sector?
A: Stay away short-term because of the China trade war, but it’s a great buy on the long term. These stocks, like NVIDIA (NVDA) and Micron Technology (MU) have another double in them. The fundamentals are outrageously good.
Q: Is the market crazy, or what?
A: Yes, it is crazy, which is why I’m keeping 90% cash and 10% on the short side. But “Markets can remain irrational longer than you can stay liquid,” as my friend John Maynard Keynes used to say.
Q: What’s your take on the Consumer Staples sector (XLP)?
A: It will likely go up for the rest of the year, into the Christmas period; it’s a fairly safe sector. The uptrend will remain until it doesn’t.
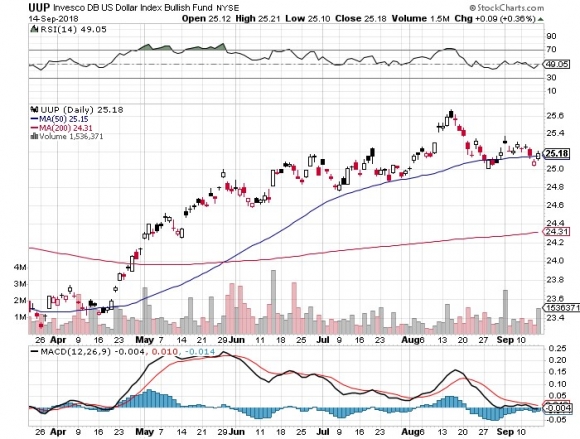
Q: Should we buy TBT now?
A: No, the time to buy the ProShares Ultra Short 20+ Year Treasury ETF (TBT) was two months ago. Now is the time to sell and take profits. I don’t think 10-year U.S. Treasury yields (TLT) are going above 3.11% in this cycle, and we are now at 3.07%. Buy low and sell high, that’s how you make the money, not the opposite.
Q: Does this webinar get posted on the website?
A: Yes, but you have to log in to access it. Then hover your cursor over My Account and a drop-down menu magically appears. Click on Global Trading Dispatch, then the Webinars button, and the last nine years of webinars appear. Pick the webinar you want and click on the “PLAY” arrow. Just give us a couple of hours to get it up.
Q: Can Chinese companies use Southeast Asia as a conduit to export to the U.S.?
A: Yes. This is an old trick to bypass trade restrictions. For example, most of the Chinese steel coming into the U.S. is through third countries, like Singapore. Eventually they do get found out, at which point companies or imports from Vietnam will be identified as Chinese origin and get hit with the import duties anyway, but it could take a year or two for those illegal imports to get discovered. This has been going on ever since trade started.
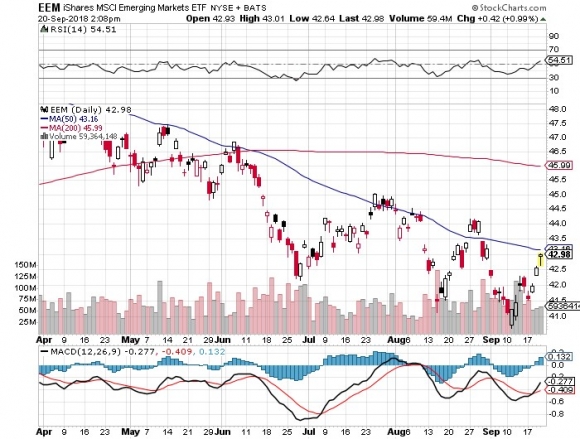
Q: Will the currency crisis in Argentina and Turkey spread to a global contagion?
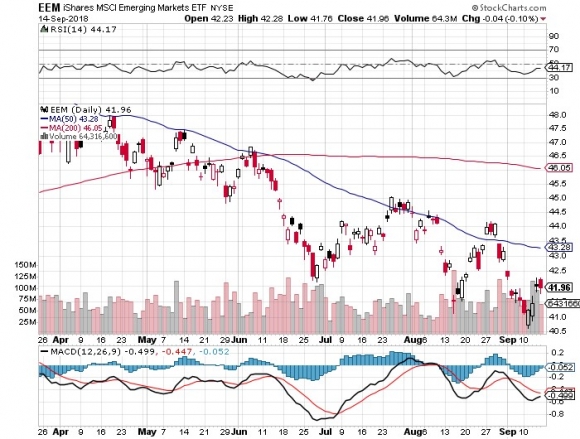
A: Yes, and this could be another cause of a global recession late next year. The canaries in the coal live there (EEM).
Q: Would you use the DOJ probe to buy into Tesla (TSLA)?
A: No, buy the car, not the stock as it is untradeable. This is in fact the third DOJ investigation Tesla has undergone since Trump came into office. The last one was over how they handled the $400 million they have in deposits for their 400,000 orders. It turns out it was all held in an escrow account. There are easier ways to make money. It’s a black swan a day with Tesla. This is what happens when you disrupt about half of the U.S. GDP all at once, including autos, the national dealer network, big oil, and advertising. All of these are among the largest campaign donors in the U.S.