Below please find subscribers' Q&A for the Mad Hedge Fund Trader May 23 Global Strategy Webinar with my guest and co-host Bill Davis of the Mad Day Trader.
As usual, every asset class long and short was covered. You are certainly an inquisitive lot, and keep those questions coming!
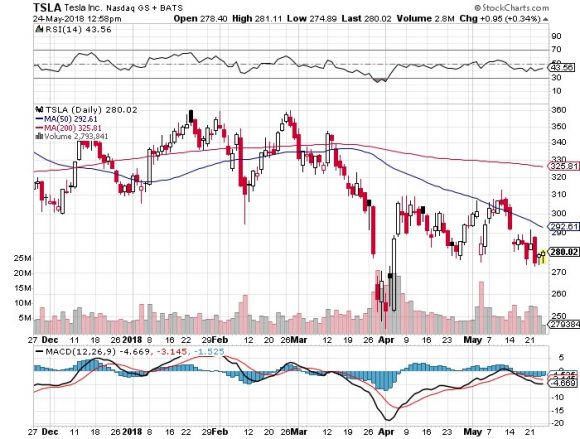
Q: Would you short Tesla here?
A: Tesla (TSLA) is on the verge of making the big leap to mass production, so they're in somewhat of an in-between time from a profit point of view, and the burden of proof is on them. Elon Musk is notorious for squeezing shorts. I would not want to bet him.
Musk has been successfully squeezing shorts for 10 years now, from the time the stock was at $16.50 all the way up to $392. So, I would not short Tesla. Buy the car but don't play in the stock; it's really a venture capital play that happens to have a stock listing because so many people are willing to back his vision of a carbon-free economy.
Q: What is your takeaway on the China trade war situation?
A: The Chinese said "no," and that is positive for economic growth. Anything that enhances international trade is good for growth and good for the stock market; anything that damages international trade is bad for corporate earnings and bad for the stock market. So, the China win in the trade war is essentially positive, but I don't think we'll see that reflected in stock prices until the end of the year.
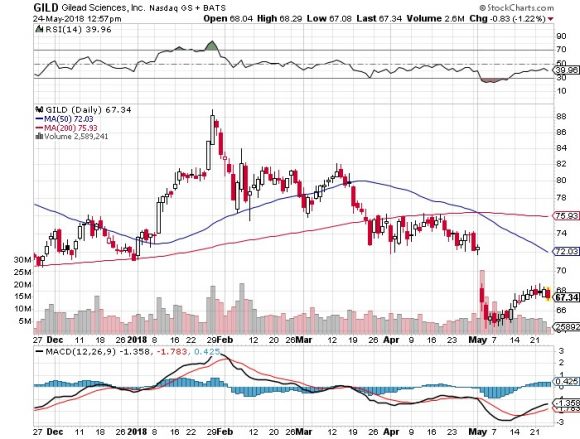
Q: What do you think about Gilead Sciences?
A: I don't really want to touch Gilead (GILD), or the entire sector, for that matter. We shouldn't be seeing such a poor performance at this point in the market. Health care has been dead for a long time, and you would have expected a rally based purely on fundamentals; they are delivering good earnings, it's just not reflected in the price action of the stocks. I think with no new money going into the market, there's nothing to push up other sectors; it's really become a "technology on and off" market. Health care doesn't fit anywhere in that world.
Q: Do you still like Nvidia?
A: I love Nvidia (NVDA). The chip sector still has another year to go. Nvidia has the high value-added product, and I'm looking for $300 dollars a share sometime this year/next year. The reason the stock hasn't really been moving is that it's over-owned; too many people know about the Nvidia story, which continues to go "gangbusters," so to speak. The chairman has also put out negative comments on short-term inventories, which have been a drag.
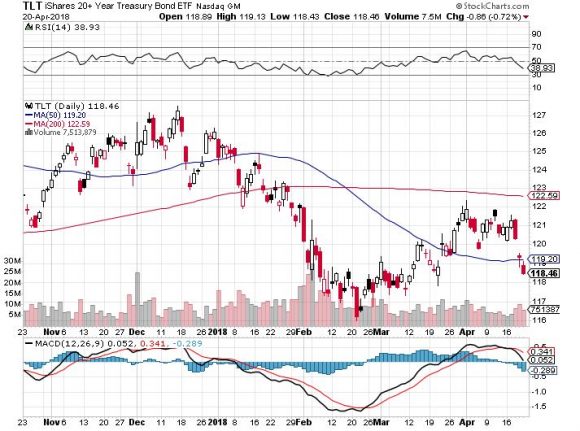
Q: Treasuries (TLT) are over 3%. Will they go over 3.5% by then end of this year?
A: I would say yes. Since that is only 50 basis points away from the current market, I would say it's a pretty good bet. So, if you get any good entry points you can do LEAPS going out to next year, betting that Treasuries will not only be below $116 by the end of the year, but they'll probably be below 110. And that would give you a very good high return LEAP with a yield of 50% in the next, say 8 months. By the way, if the Treasury yield rises to 4% that takes the (TLT) down to $98!
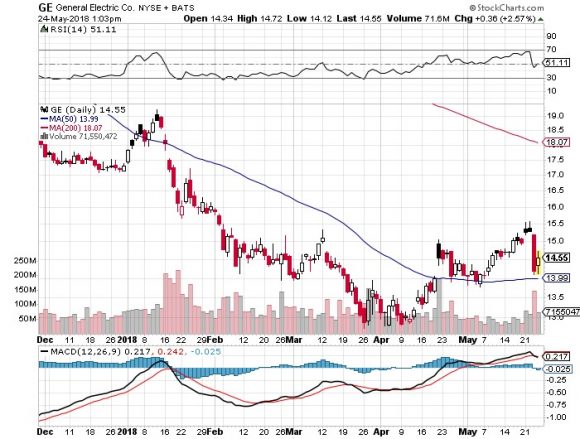
Q: Any chance General Electric will be acquired this year?
A: Absolutely not. General Electric (GE) worth far more if you break it up into individual pieces and sell them. Some parts are very profitable like jet engines and Baker Hughes, while other parts, like their medical insurance exposure, are awful.
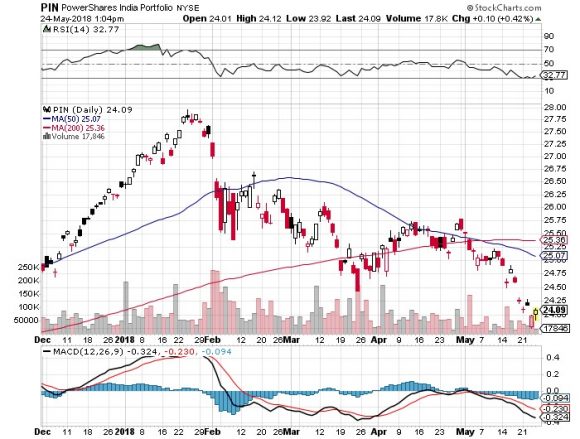
Q: What do you see about the India ETF?
A: The one I follow is the PowerShares India Portfolio ETF (PIN) and we love it long term. Short term, they can take some pain with the rest of the emerging markets.
Q: What should I do with my January 2019 Gold calls?
A: I would sell them. It's not worth hanging on to here with too many other better things to do in stocks.
Q: Would you continue to hold ExxonMobile?
A: I would not. If you were lucky enough to get in at the bottom on ExxonMobile (XOM). I would be taking profits here. I'm not sure how long this energy rally will last, especially if the global economic slowdown continues.
Q: Is Freeport-McMoRan (FCX) a buy?
A: Yes, but only buy the dip in the recent range, so you don't get stopped out when the price goes against you. Commodities are the best performing asset class this year and that should continue.
Q: How high is oil (USO) headed?
A: I think we're probably peaking out short of $80 a barrel currently unless we get a major geopolitical event. Then it could go up to $100 very quickly and trigger a recession.
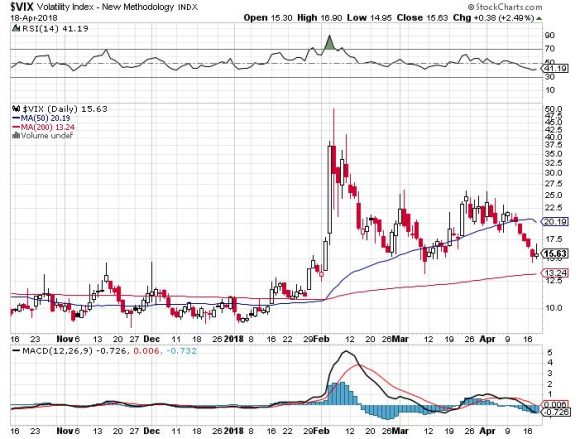
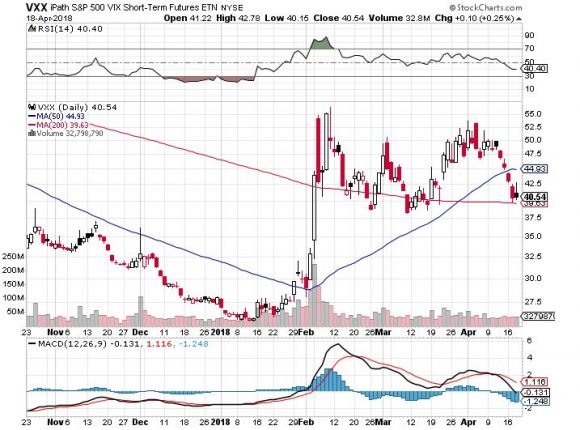
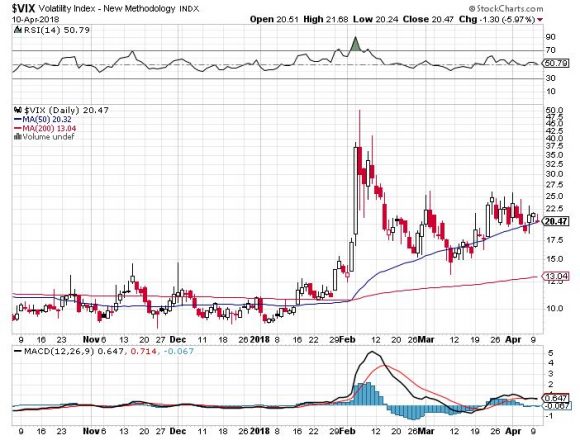
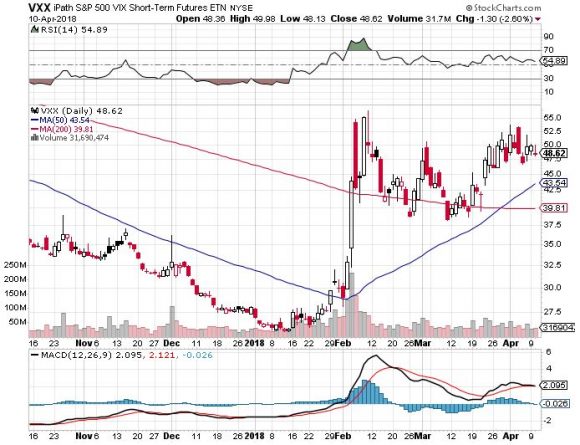
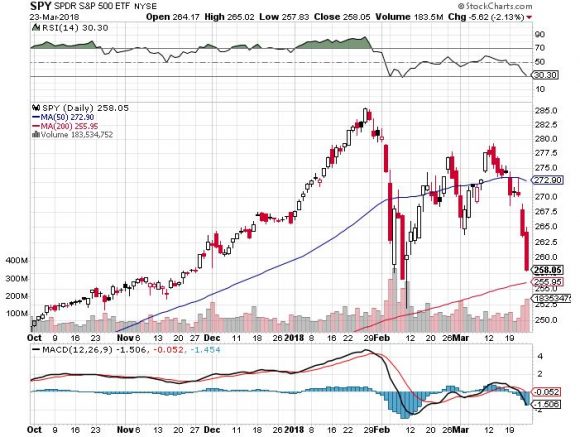
Q: Are you looking to buy the Volatility Index here?
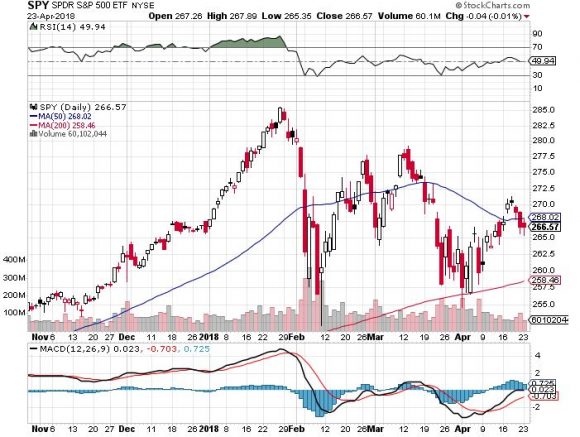
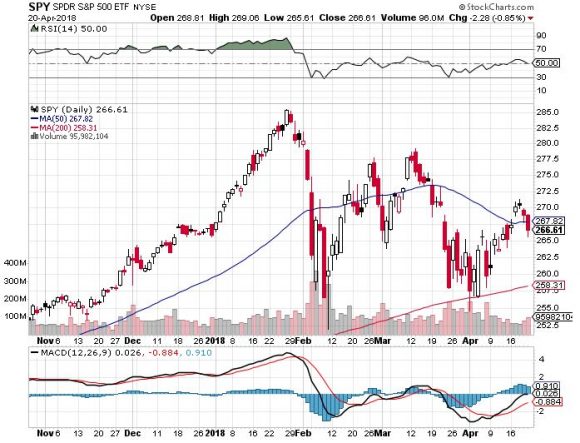
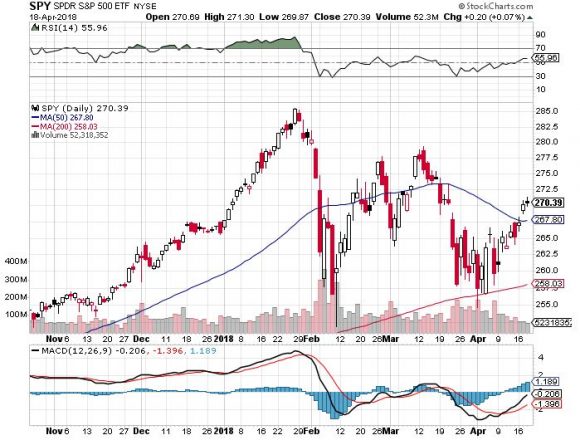
A: Buy the next dip, but the trick with (VIX) is buying after it sits on a bottom for about five days. You also want to buy it when stocks (SPY) are at the top of a range, like yesterday.
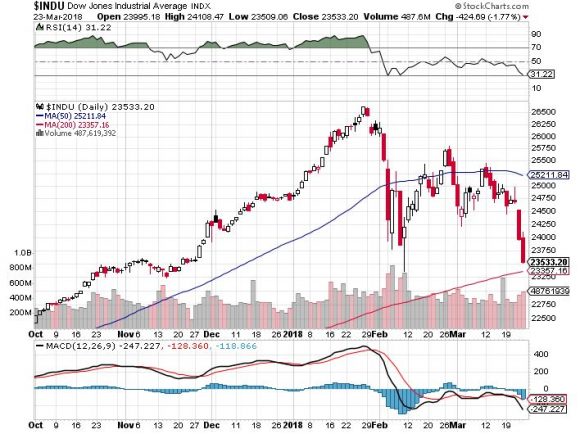
Q: How long do you think the market will be range-bound for?
A: My bet is at least three months, and possibly four or five. We should start to anticipate the outcome of the midterm congressional elections in September/October; that's when you get your upside breakout.
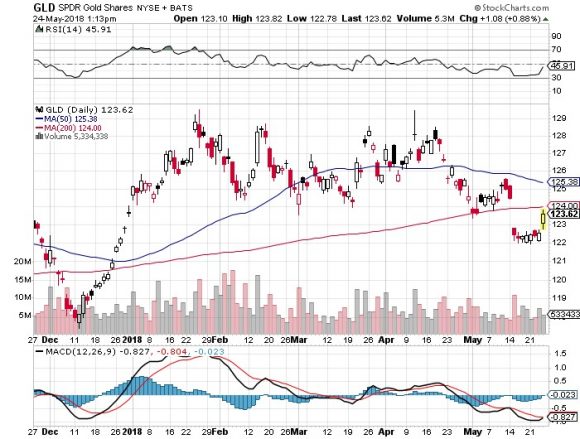
Q: Is Gold (GLD) not worth buying since Bitcoin has taken over market share from Gold buyers?
A: Essentially, yes. That's probably why you're not getting these big spikes in Gold like you're used to. Instead, you're getting them in Bitcoin. Bitcoin is clearly stealing Gold's thunder. That's a major reason why we haven't been chasing Gold this year.
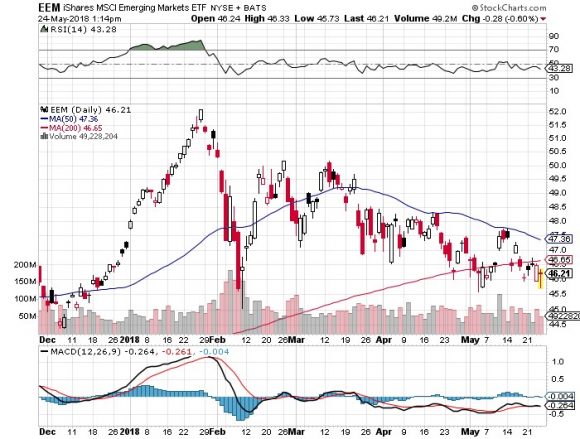
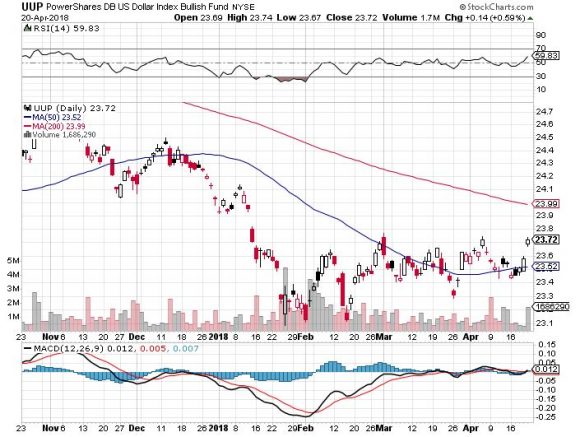
Q: After the emerging market sell-off, is it a good time to go in?
A: No, I think the emerging market (EEM) sell-off is being created by rising interest rates and a strong dollar. I don't see that ending anytime soon. In a year let's take another look in emerging markets. By then overnight Fed funds should be at 2.50% to 2.75%.