
“Getting information off the Internet is like taking a drink from a fire hydrant.” Said American Entrepreneur Mitchell Kapor

“Getting information off the Internet is like taking a drink from a fire hydrant.” Said American Entrepreneur Mitchell Kapor
Mad Hedge Technology Letter
April 19, 2021
Fiat Lux
Featured Trade:
(AN ECOMMERCE / EGAMING BEHEMOTH TO LOOK AT)
(SEA)

Do you want to invest in the 3rd most downloaded app in the shopping category globally for 2020?
Well, you can.
And that’s not all this company does, there is more.
This tech company is also part of a wider portfolio that includes Esport assets.
Sea Limited (SEA) is listed on the Nasdaq stock exchange under the ticker symbol SEA.
SEA, previously known as Garina, is headquartered in Singapore and serves the South East Asian and Latin American markets.
In both the fourth quarter and for the full year, Shopee, SEAs ecommerce division, was ranked the No. 1 in the shopping category across Southeast Asia and Taiwan by average monthly active users, total time spent in-app on Android, and the downloads based on App Annie.
Initially, SEA was a communication platform for video gamers, before distributing games made by Tencent for the Southeast Asian audience.
The company then went on to produce its own in-house game, Free Fire, which became an international phenomenon on the company's first try out of the gate.
Free Fire was once again the top-ranked mobile-only video game and the top-ranked battle royale video game on YouTube in terms of views.
It was also the third-ranked game overall on YouTube by view count. Free Fire-related content recorded over 72 billion view count across YouTube globally over the course of the year.
The game was also named the Esports Mobile Game of the Year at the Esports Award 2020.
They have the in-game titles to accumulate the eyeballs in its ecommerce division.
SEA's ambition went well beyond video games, and the company then launched Shopee in 2015, along with SeaMoney, its digital financial-services arm around the same time.
Shopee has been a winner, overtaking early e-commerce players in the region just as Southeast Asians began to adopt e-commerce at a larger scale.
The pandemic then hit just as Shopee was overtaking its rivals, leading to meteoric growth last year.
It continued to invest in its fintech ambitions by buying Jakarta-based bank Bank BKE. Acquiring a bank signals SEAs ambition to become a swiss army knife of financial services beyond mere e-commerce payments.
Second, Sea Limited has also entered Latin America in a dramatic fashion.
After starting with a small e-commerce presence in Brazil in 2019, Shopee just launched its app in Mexico in February.
The launch signaled that SEA is targeting Latin America for the next phase of incremental growth, where e-commerce is underpenetrated, and where it can cross-market effectively with the many Free Fire players in the region.
Moreover, Latin America has an even bigger population than Southeast Asia, with 2019 GDP of $5.2 trillion, versus Southeast Asia's $3.6 trillion.
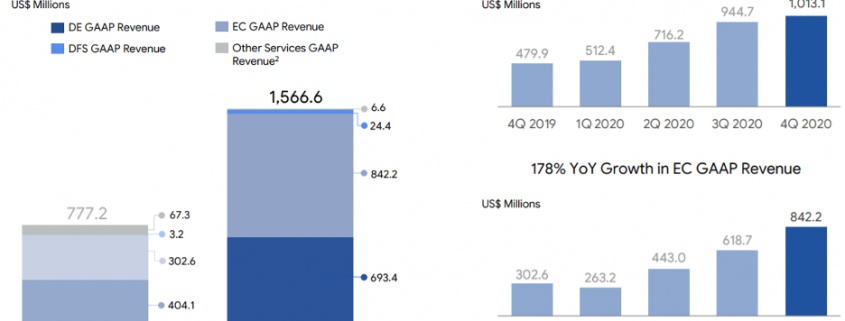
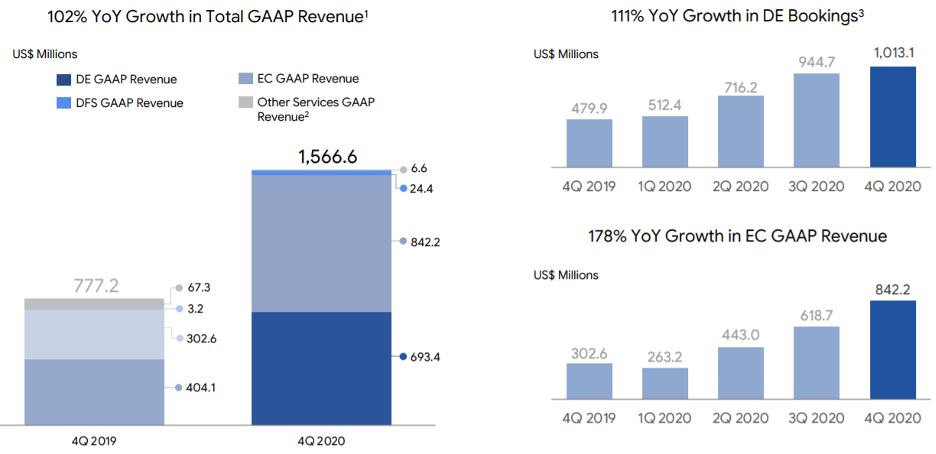
The recent performance is quite breathtaking, to say the least with total revenue increasing 102% year on year to $1.6 billion in the fourth quarter, and 101% year on year to $4.4 billion for the full year of 2020.
This was mainly driven by rapid rate growth in SEAs e-commerce business as they continue to grow tools to better serve users' needs, as well as the growth of the digital entertainment business, especially self-developed game Free Fire.
The proof is in the numbers.
To sustain the momentum in Esports, in the fourth quarter, Phoenix Labs, SEAs triple-A gaming studio based in Vancouver, is adding new offices in Montreal and Los Angeles, alongside its existing - existing bases in Vancouver and Seattle.
Shopee reported 1 billion gross orders, up 135% year on year, and a gross market value (GMV) of $11.9 billion, an increase of 113% year on year resulting in quarterly revenue growing 178% year on year to $842.2 million.
Shopee continued to rank first in Indonesia by average monthly active users, total time spent in-app on Android, and the downloads in the shopping category in the fourth quarter and the for the full year of 2020.
For the full year of 2021, SEA currently expects bookings for digital entertainment to be between $4.3 billion and $4.5 billion, representing 38% year-on-year growth.
Sea Limited also expects that revenue for e-commerce could be between $4.5 billion and $4.7 billion, representing 112% and year-on-year growth as a mid-point of the guidance.
A tech company that grows revenue from $4.38 billion to a projected $9 billion by end of 2021 has caught my eye but there are some major caveats.
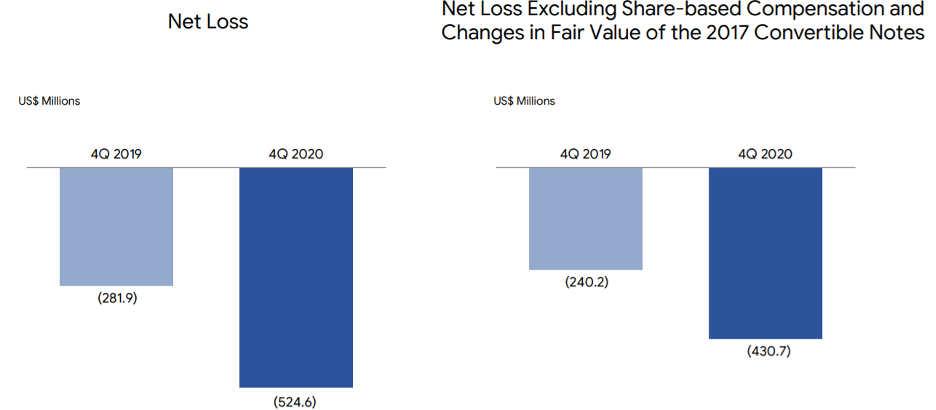
The first major eyesore is the gigantic losses.
Granted, net losses are only half as bad as Uber, but they have a track record of badly missing earnings projections as well.
This would lead me to suggest that the company is not being managed properly if they consistently forecast earnings that are unattainable.
I am quite discouraged by the lack of future profitability rhetoric by management in their earnings call.
Next, they are targeting markets of Latin America and South East Asia that aren’t as lucrative as the North American markets.
Granted, North America is cornered by local incumbents, but that doesn’t change the fact that consumer purchasing power in Mexico, Brazil, and Indonesia is low.
Being a foreign company, regulatory risks are now the order of the day as well.
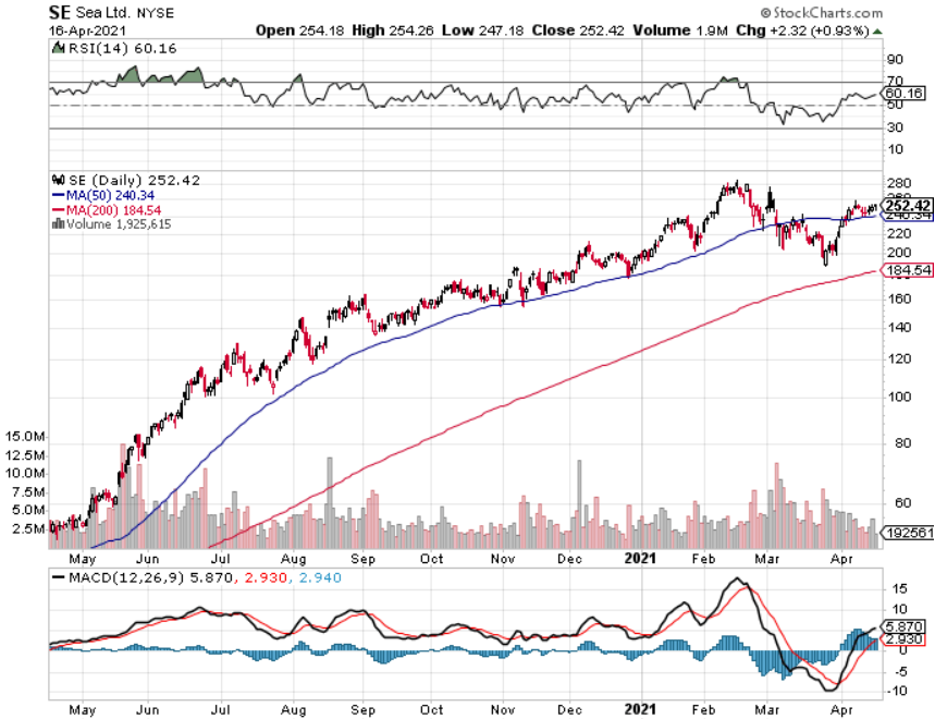
In the past 365 days, the underlying stock has risen around 500% validating the trajectory of this tech group as a real ecommerce and digital gaming force.
The stock year to date is only up 20% suggesting the pace of appreciation is plateauing and even though annual revenue is projected to double in 2021, I do believe there will be consolidation before the next leg up.
Cut it up any way you want, in a market that pays a premium for big loss-making tech firms, the over 100% in projected revenue growth in 2021 delivers exactly what the tech market desires.
But like other growth stocks ROKU, the ride up will be exhilarating and rocky because unpredictable earnings results are part and parcel of high beta tech stock’s inner workings.
Readers looking for global exposure in a volatile tech name taking advantage of the emerging ecommerce story, take a look at Sea Limited on a meaningful pullback.
Mad Hedge Technology Letter
April 16, 2021
Fiat Lux
Featured Trade:
(SHOULD I BUY COINBASE TODAY?)
(COIN), (CRM), (ADBE), (PYPL), (SQ)

For all the cryptocurrency haters in the world, it’s getting harder to take that stand.
I’ll tell you why.
Coinbase (COIN) was the first major crypto business to go public in the U.S. when it began trading at $381 Wednesday morning on the Nasdaq and its IPO symbolizes the acceptance of an alternative digital asset class in technology.
Prior to this watershed moment, the only way to play crypto was through second derivatives plays like PayPal (PYPL) and Square (SQ) who have been handsomely rewarded through higher share prices.
Now, we get the biggest U.S. cryptocurrency exchange trading publicly that will allow exposure to mainstream stock-market investors.
The event has also been tabbed as a catalyst that might drive the adoption of incremental digital assets.
At the very least, this lays down a marker for further crypto-related companies eyeing the Nasdaq after Coinbase’s blowout success.
This also shows that the cryptocurrency infrastructure is developing rapidly and its budding credibility is something that needs to be acknowledged.
The Coinbase IPO was also the catalyst in sending bitcoin prices to almost $65,000.
No doubt that the appreciating asset has been the most attractive use case for the incremental investor and cryptocurrency buyer.
Many early investors who got into bitcoin at 20 cents are now billionaires many times over.
After such stunning success, it’s hard to believe that any fintech or cryptocurrency start-up would ever consider doing their IPO anywhere else but New York.
New York has the liquidity, the US dollar, and the capacity to receive such type of growth companies in bulk.
This is not only an emphatic victory for digital assets, but also for the US tech sector and a stamp of validation for the Nasdaq market.
Ironically enough, even during this trade war, Chinese tech companies are clamoring to go public in New York and not mainland China for the above reasons.
Here are a few other highly positive data points to digest that were talking points in their S-1 filing.
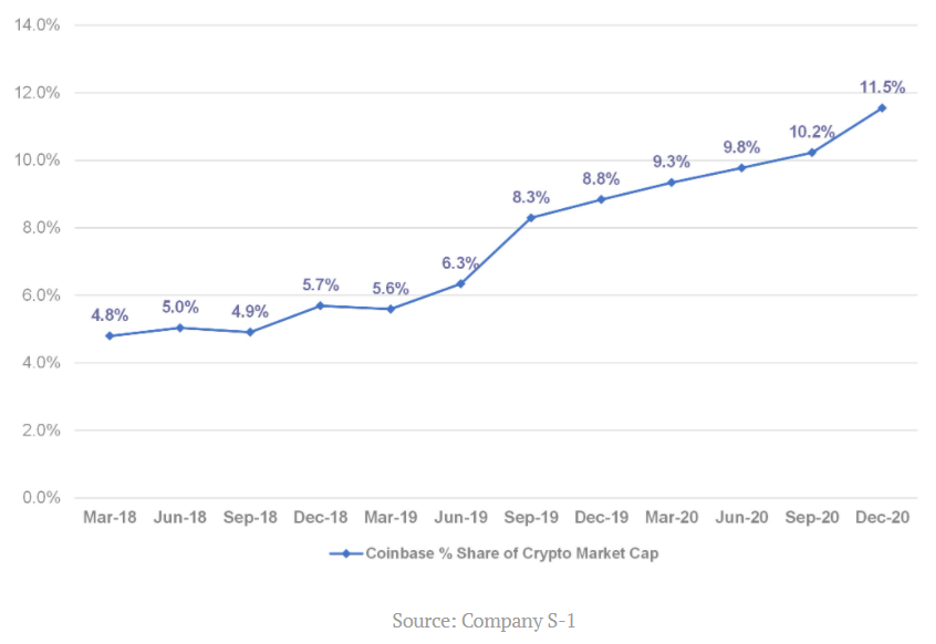
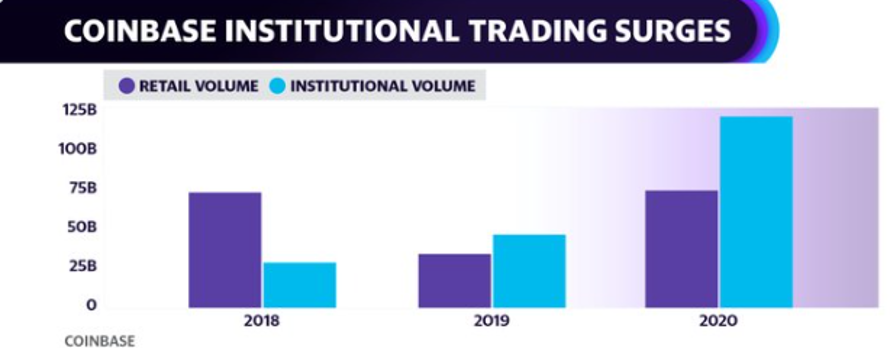
The overall market capitalization of crypto assets grew from less than $500 million to $782 billion between December 31, 2012, and December 31, 2020, representing a CAGR (compound annual growth rate) of over 150%.
Over the same period, Coinbase retail users grew from less than 13,000 to 43 million, a 175% CAGR.
I believe the total market cap of crypto is now around $2 trillion in April 2021.
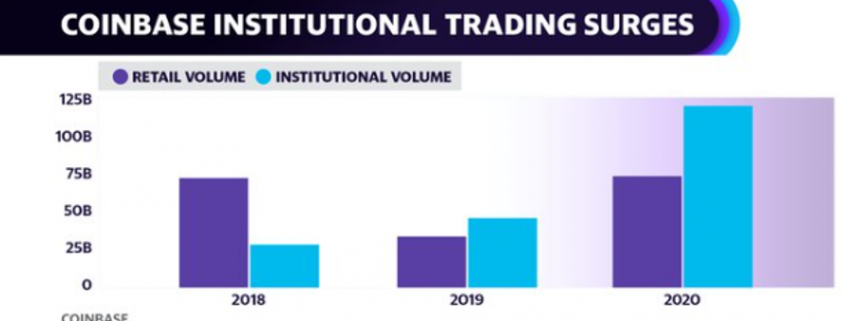
And more recently, Coinbase has experienced significant growth in the number of institutions on their platform, increasing from over 1,000 as of December 31, 2017, to 7,000 as of December 31, 2020.
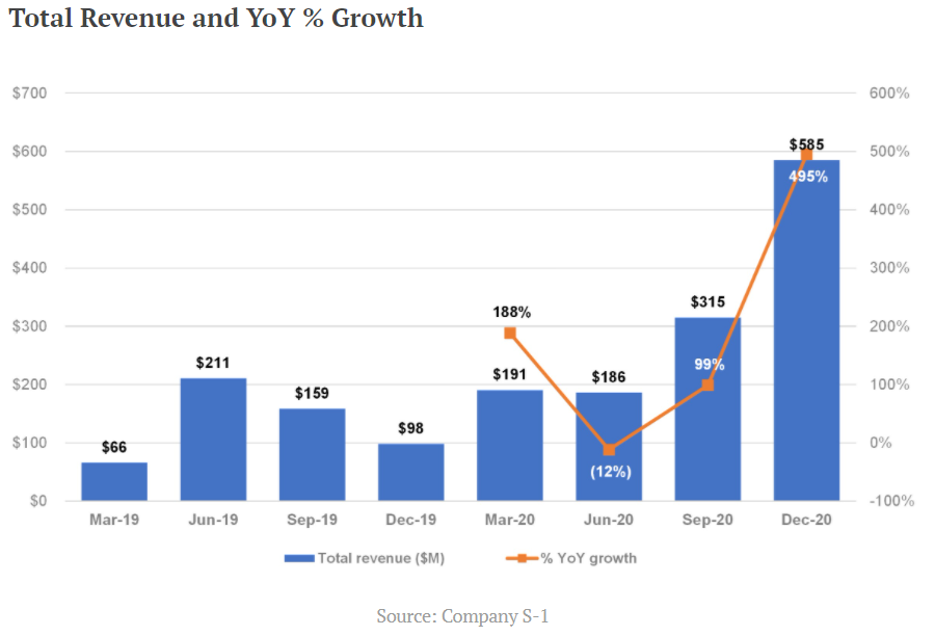
Bitcoin reported a nine-fold increase in Q1 revenue, to $1.8B, up from $190.6M the previous year.
Just like Google and Facebook benefit from a duopoly, Coinbase will benefit from being the only pure cryptocurrency option on the Nasdaq and that will put a floor under shares in the short-term.
The growth metrics of the company are also robust via a helping hand by the increasingly expensive price of bitcoin.
No doubt that this company’s prospects are tied to the hip with the prices of cryptocurrencies.
If the price of bitcoin retraces to $30,000, which it could because of the high volatility of it, expect Coinbase shares to dive with it.
This for all intents and purposes is a bet on the health and price trajectory of bitcoin for better or worse until other crypto-based choices are introduced which would give more layers and complexity to this sub-sector.
Bitcoin calls out Binance which they state as a competitor and Kraken is another exchange that is large and vying for the same capital.
I believe these two companies have a chance to go public and that is when you will really see the institutions jump on this crypto bandwagon.
More options and a foundational investment base will also promote stability in this new technology sub-sector.
Should you buy Coinbase today?
No.
I understand Coinbase’s growth metrics are off the charts with revenue growing 900%, but it’s not worth $100 billion market cap on just $1.8 billion of quarterly sales.
Investors would need solid tailwinds such as bitcoin passing $100,000 in 2021 for this company to be worth $100 billion and I just don’t see it.
Then also understand the cybersecurity and possible regulations are two risks that could blow up the business model at any moment which would take down the premium in the stock.
Yes, the meteoric rise of crypto at the start of 2021 has turned heads, but as the economy reopens, I do believe money will rotate from crypto back into traditional technology that is underpinned by cash cow businesses.
Highly profitable companies that aren’t FANGs are also set to deliver share appreciation to shareholders such as Salesforce (CRM) or a company like Adobe (ADBE) who earn profits of $5.27 billion on $13 billion of annual revenue.
I acknowledge that Coinbase’s IPO was the perfect time to go public.
They are taking advantage of easy money and low rates while the acceptance of this alternative asset class has never been higher.
However, I don’t see any more incremental growth in the short term and the stock is more than fully priced today.
The risk-reward is not favorable to pile into this stock now unless you have a bullish 50-year view on crypto and can’t wait.
This stock will go through volatility because of the inherent dynamics they are tied to and I would seriously look at buying Coinbase only on a massive sell-off.
Don’t go chasing unicorns.
At the end of the day, this is a real company with real revenue growth of 900% year-over-year. Slice it up anyway, and these numbers are numbers that attract investors, but the stock is too expensive right here.

“Every smart person that I admire in the world, and those I semi-fear, is focused on this concept of crypto for a reason. They understand that this is the driving force of the fourth industrial revolution: steam engine, electricity, then the microchip - blockchain and crypto is the fourth.” – Said American Entrepreneur Brock Pierce

Mad Hedge Technology Letter
April 14, 2021
Fiat Lux
Featured Trade:
(A 2021 TECH DARLING)
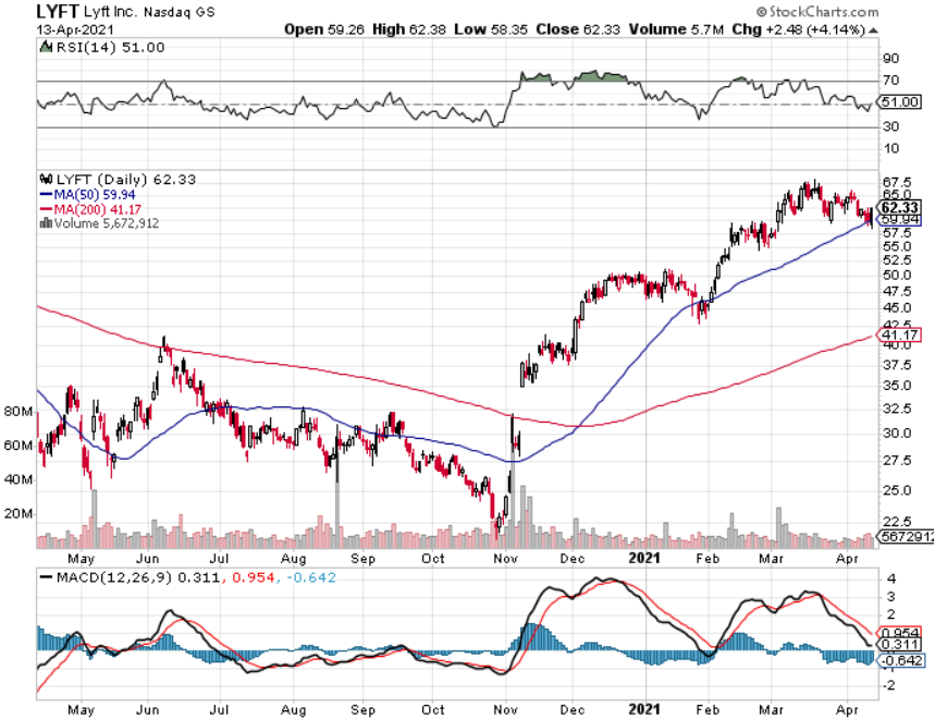
(UBER), (LYFT)

Uber (UBER) is a solid tech investment for the remainder of 2021, and this is me saying that when I don’t even like their company business model.
The biggest gap up in shares usually occurs when a company goes from flat-out terrible to the level just above that and that’s what is happening to Uber in 2021.
Why have they been so bad lately?
Uber’s Mobility gross bookings, or ride-sharing revenue, was $6.8 billion, which was down 47% year on year and revenue of only $1.5 billion.
Uber was never profitable, to begin with, not even close, and for COVID to gut their main business in 2020, investing in shares became even less appetizing.
Or were they?
Ironically enough, the California ride-sharing company was able to compensate during the pandemic by delivering food, a very non-tech type of business.
Delivery revenue of $1.4 billion, up 220%, significantly outpaced gross bookings growth and delivery revenues take rate was 13.5%, up 391 basis points year on year and up 21 basis points quarter on quarter.
Not only did the delivery revenue become almost equal to its ride-sharing revenue in such a short time span, but their “take rate” nudged up which is measured as the percentage of what they accrue from each $1 in delivery.
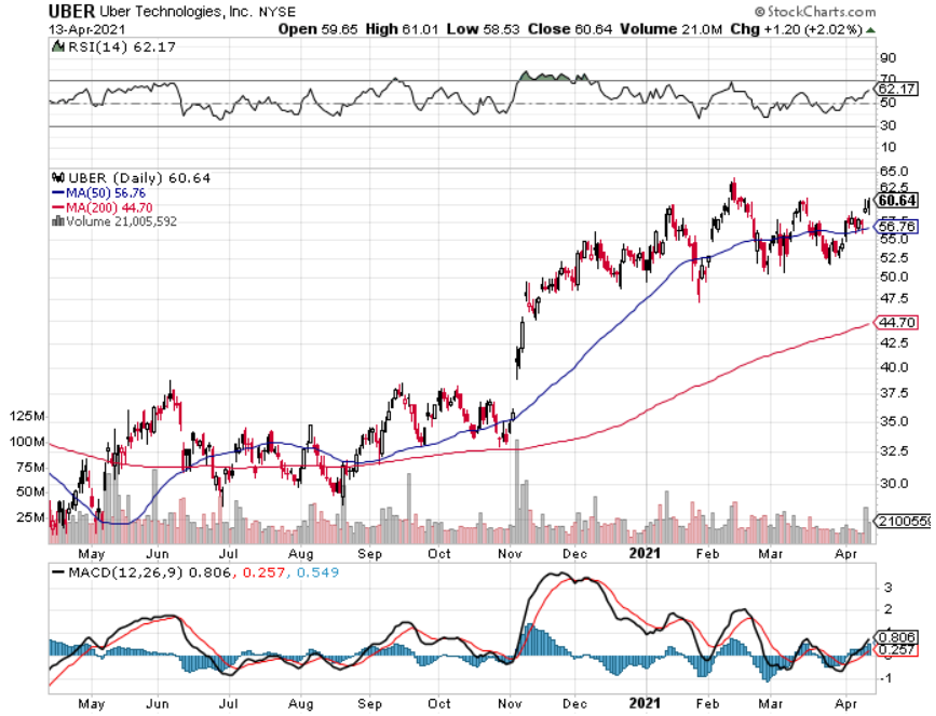
The momentum allowed Uber to triple its shares from March 2020 lows on the back of a reinvigorated delivery service, trillions of printed money, and a broad-based rally that swept up Uber.
Trust me, Uber doesn’t own any worthwhile intellectual property that is going to differentiate itself from the competition, but they are part of a duopoly with Lyft (LYFT) that makes 2021 so intriguing.
Reading the 2021 tea leaves, it's hard not to love this company as tourism, outdoor mobility, and intercity mobility will reverse and people will start paying uber for rides to go to bars and house parties.
Uber indicated just that with a teaser report before the real earnings come out showing that total gross bookings as of March 2021 reached the highest monthly level in the company's nearly 12-year history.
Mobility posted its best month since the pandemic started in March 2020, passing a $30B annualized gross bookings run rate. Average daily gross bookings were up 9% month-over-month.
Delivery set another all-time record, crossing $52B annualized gross bookings run rate in March, up over 150% on the year.
Uber says the rideshare business recovery and continuing Eats demand have customers outpacing the number of drivers and couriers.
The company ended the Form 8-K on a down note, letting investors know that after a court order, Uber must reclassify UK drivers as employees.
The company expects to record a “significant accrual” due to higher British employment costs in Q1 with the majority expected to reduce total and mobility revenues and revenue take rates but will be excluded from adjusted EBITDA results.
I must say that it’s quite irresponsible of management to just slide this “significant accrual” off the balance sheet as it could turn into something major if other big markets similar to London force Uber to reclassify workers as employees.
This is by far the biggest risk moving forward in 2021, but I doubt that other European locales will have the balls to say no to Uber.
Management reiterated that they remain on track to turn the EBITDA profitable in 2021, but then again, the EBITDA is quite substantial which is a management trick that needs to be banned in corporate America.
I believe that management keeps moving the goalposts by trying hard to please the incremental investor with alternative metrics, but that doesn’t take away from the immense potential of the back half of 2021.
Uber is poised to seriously outperform as people have been quarantined inside for over a year now and are waiting to explode out of their front door.
The company has burnt through over $15 billion in cash since 2019 and the stock has tripled, after stripping out a decline in food deliveries later this year, I believe the strength in rideshare revenue will end up with Uber having some quite rosy numbers.
Call it a net positive after you minus out the delivery revenue which is poised to shrink in the latter half of the year.
Thus, I will stamp Uber with a short-term and medium-term conviction buy, but a long-term sell because I just don’t see a pathway yet to become a heavy hitter, and Uber’s accounting gimmicks are a red flag.

“Once a new technology rolls over you, if you're not part of the steamroller, you're part of the road.” – Said Writer Stewart Brand

Mad Hedge Technology Letter
April 12, 2021
Fiat Lux
Featured Trade:
(SHOULD I BUY THE BEYOND MEAT DIP?)
(BYND), (KR), (IMPOSSIBLE FOODS)