• support@madhedgefundtrader.com
  • Member Login
Mad Hedge Fund Trader
  • Home
  • About
  • Store
  • Luncheons
  • Testimonials
  • Contact Us
  • Click to open the search input field Click to open the search input field Search
  • Menu Menu
DougD

The Bad Economic Data Deluge

Newsletter

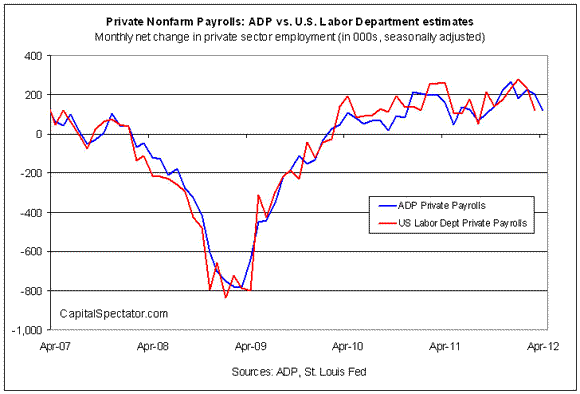
Traders were sucker punched this morning with the release of the April ADP showing that private sector hiring came in at a flaccid 119,000, some 56,000 less than expected. This signals that the Department of Labor weekly jobless claims due out at 5:30 AM EST could be equally grim, and the Friday nonfarm payroll even worse. My sub 100,000 forecast for the latter is looking better by the minute.

They were preceded by European Purchasing Managers Index figures showing that the continental economy is falling off a cliff faster than anticipated. Following was the New York April ISM, plunging from 67.4 to 61.2, and March factory orders shrinking from +1.1% to -1.5%. The economic data are clearly moving out of the frying pan and into the fire. If you want to see what the early stages of a recession look like, this is it, up close and ugly.

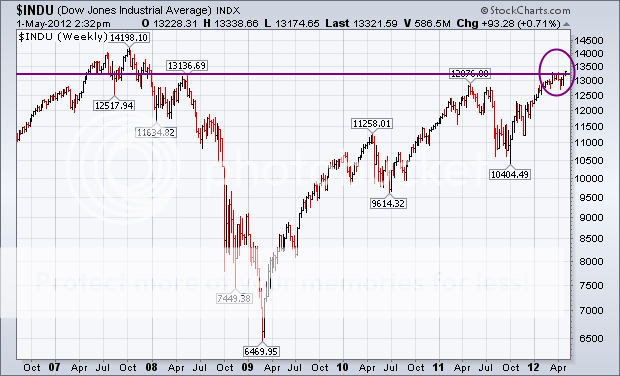
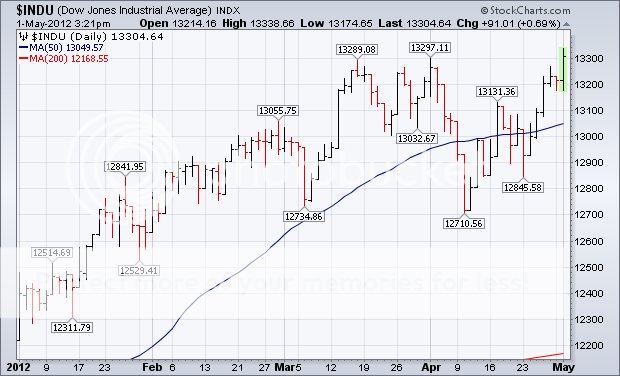
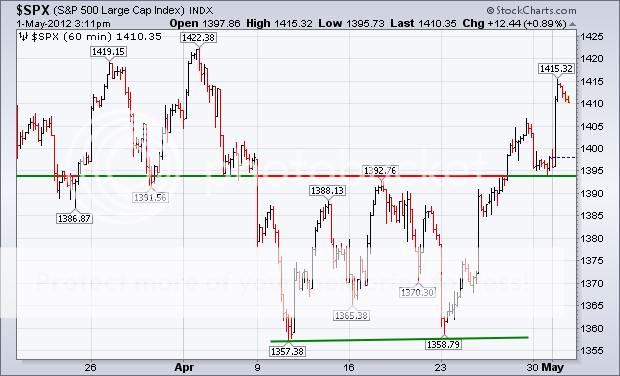
What amazes me is how the stock market has been able to hold up against this onslaught of deteriorating fundamentals. I have argued all along that hedge funds have been on a buying strike this year, either sitting on the sidelines or dabbling with minimal token positions. That means there are few left to sell at market tops. The subterranean level of market volatility confirms this view.

It is also true that stock indexes are rising more from a lack of sellers than from any big influx of buyers. That is verified by trading volumes that are half of what they were a year ago. And the few buyers that exist are long term in nature, like pension funds. They seem to be willing to look across any valley crated by a downturn in share prices created by the current weakness in the economy. If they are focused on a yearend share price levels that are at, or higher, than current prices, they don?t care if the indexes take a 15% detour downward, or if individual names give back as much as 30%. These guys only reallocate once a year.

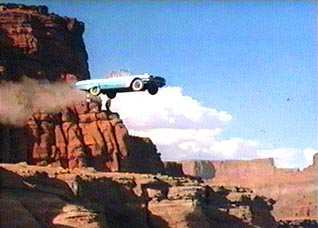
That is all well and good if the summer dip is a little dell, vale, or glen that one might appreciate in a Thomas Kincaid painting. If it turns out to be a Grand Canyon, that is another story. Then they will all be puking out at the bottom, as they have done for the last three years.


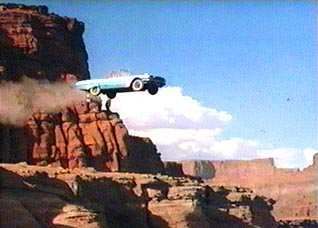
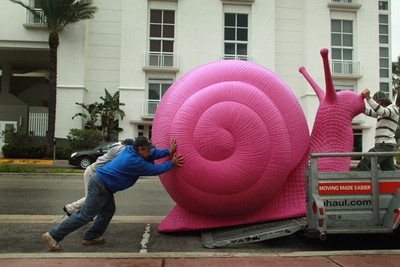
Is This Your Summer Trading Strategy?

https://www.madhedgefundtrader.com/wp-content/uploads/2012/05/thelma3-Copy2.jpg 228 318 DougD https://madhedgefundtrader.com/wp-content/uploads/2019/05/cropped-mad-hedge-logo-transparent-192x192_f9578834168ba24df3eb53916a12c882.png DougD2012-05-02 23:04:332012-05-02 23:04:33The Bad Economic Data Deluge
DougD

Undercutting Canadian Tar Sands

Diary

Anyone who has any illusions about the Canadian tar sands business should take a look at the picture below. I?m not a fanatic, sandal wearing, organic bean sprout eating environmentalist, but just looking at it tells you that this is an eco-disaster of Biblical proportions.

A $50 billion investment by several firms over the last decade is now producing 750,000 barrels/day, and another $100 billion in capital is headed north. You have to cut down a whole forest, remove two tons of peat, then another two tons of sand, and burn 100 barrels of oil equivalent to heat rivers of water to steam, just to produce a single miserable barrel of oil.

This gives you the world?s highest production cost, thought to be $80-$100/barrel. There are now 50 square miles of sludge ponds in Northern Alberta leaching a witch?s brew of poisons into the water supply, which has caused the local cancer rate to explode tenfold. We?re not just talking about a few sick geese here.

Canada is the largest foreign supplier of oil to the US, accounting for 19% of our total, and half of that is coming from tar sands. The whole industry was built as a hedge against some Third World War, Armageddon type total cut off of all foreign crude supplies that would drive prices to $500/barrel, making all of this hugely profitable someday.

Maybe the owners think they can get away with this because it is in the middle of nowhere. An army of lawyers hitting these projects with a tidal wave of litigation think otherwise. This is the reason why environmentalist opposition to the Keystone pipeline was so acerbic. They view the tar sands as the world?s single largest source of greenhouse gasses. With North Dakota?s production expected to exceed total Canadian tar sands production by next year, and with challenges now arising from the seemingly endless new supply of cheap natural gas, the whole project may become redundant

After looking at this picture and analyzing the numbers, you have to ask if it is really worth it, just so you can drive your Hummer to Wal-Mart. It all makes the future performance of major producer, Suncor Energy (SU), very suspect.


https://www.madhedgefundtrader.com/wp-content/uploads/2012/05/tar.jpg 267 400 DougD https://madhedgefundtrader.com/wp-content/uploads/2019/05/cropped-mad-hedge-logo-transparent-192x192_f9578834168ba24df3eb53916a12c882.png DougD2012-05-02 23:03:142012-05-02 23:03:14Undercutting Canadian Tar Sands
DougD

The New California Gold Rush

Diary

On my way back from Lake Tahoe last weekend I saw that every bend of the American river was dotted with hopeful miners, looking to make a windfall fortune. Weekend hobbyists were there panning away from the banks, while the hardcore pros stood in hip waders balancing portable pumps on truck inner tubes, pouring sand into sluice boxes. Welcome to the new California gold rush.

A sharp eyed veteran can take in $2,000 worth of gold dust a day. The new 2012'ers were driven by high prices of gold at $1,650 and the attendant headlines, but also by unemployment, and recent heavy rains that flushed out new quantities of the yellow metal out from the Sierras. They were no doubt inspired by the chance discovery of an 8.7 ounce nugget in May near Bakersfield, worth an impressive $14,300.

Local folklore says that The Sierra's have given up only 20% of their gold, and the remaining 80% is still up there awaiting discovery. Out of work construction workers are taking their heavy equipment up to the mountains and using it to reopen mines that have been abandoned since the 19th century.

The US Bureau of Land Management says that mining permits in the Golden State this year have shot up from 15,606 to 23,974. Unfortunately, the big money here is being made by the sellers of supplies and services to the new miners, much as Levi Strauss and Wells Fargo did in the original 1849 gold rush.

https://www.madhedgefundtrader.com/wp-content/uploads/2012/05/gold-23.jpg 260 399 DougD https://madhedgefundtrader.com/wp-content/uploads/2019/05/cropped-mad-hedge-logo-transparent-192x192_f9578834168ba24df3eb53916a12c882.png DougD2012-05-02 23:02:092012-05-02 23:02:09The New California Gold Rush
DougD

May 3, 2012 - Quote of the Day

Quote of the Day

?Isn?t it funny when you walk into an investment firm, and you see all of the financial advisors watching CNBC? That gives me the same feeling of confidence I would have if I walked into the Mayo Clinic or Sloan Kettering and all of the doctors were watching the TV soap opera General Hospital,? said a bond manager friend.

https://www.madhedgefundtrader.com/wp-content/uploads/2012/05/doctor-1.jpg 159 108 DougD https://madhedgefundtrader.com/wp-content/uploads/2019/05/cropped-mad-hedge-logo-transparent-192x192_f9578834168ba24df3eb53916a12c882.png DougD2012-05-02 23:01:142012-05-02 23:01:14May 3, 2012 - Quote of the Day
DougD

The Hard Numbers Behind Selling in May.

Newsletter

If I had a nickel for every time that I heard the term ?Sell in May and go away? this year, I could retire. Oops, I already am retired! In any case, I thought that I would dig out the hard numbers and see how true this old trading adage is.

It turns out that it is far more powerful than I imagined. According to the data in the Stock Trader?s Almanac, $10,000 invested at the beginning of May and sold at the end of October every year since 1950 would be showing a loss today. Amazingly, $10,000 invested on every November 1 and sold at the end of April would today be worth $702,000, giving you a compound annual return of 7.10% .

My friends at the research house, Dorsey, Wright & Associates, (click here for their site at http://www.dorseywright.com/ ) have parsed the data even further. Since 2000, the Dow has managed a feeble return of only 4%, while the long winter/short summer strategy generated a stunning 64%.

Of the 62 years under study, the market was down in 25 May-October periods, but negative in only 13 of the November-April periods, and down only three times in the last 20 years! There have been just three times when the "good 6 months" have lost more than 10% (1969, 1973 and 2008), but with the "bad six month" time period there have been 11 losing efforts of 10% or more.

Being a long time student of the American, and indeed, the global economy, I have long had a theory behind the regularity of this cycle. It?s enough to base a pagan religion around, like the once practicing Druids at Stonehenge.
Up until the 1920?s, we had an overwhelmingly agricultural economy. Farmers were always at maximum financial distress in the fall, when their outlays for seed, fertilizer, and labor were at a maximum, but they had yet to earn any income from the sale of their crops. So they had to borrow all at once, placing a large cash call on the financial system as a whole. This is why we have seen so many stock market crashes in October. Once the system swallows this lump, it?s nothing but green lights for six months.
After the cycle was set and easily identifiable by low end computer algorithms, the trend became a self-fulfilling prophesy. Yes, it may be disturbing to learn that we ardent stock market practitioners might in fact be the high priests of a strange set of beliefs. But hey, some people will do anything to outperform the market.

It is important to remember that this cyclicality is not 100%, and you know the one time you bet the ranch, it won?t work. But you really have to wonder what investors are expecting when they buy stocks at these elevated levels, over 1,400 in the S&P 500.

Will company earnings multiples further expand from 14 to 15 or 16? Will the GDP suddenly reaccelerate from a 2% rate to the 4% expected by share prices when the daily data flow is pointing the opposite direction?

I can?t wait to see how this one plays out.


Thank Goodness I Sold in May

https://www.madhedgefundtrader.com/wp-content/uploads/2012/05/sunbathing.jpg 320 320 DougD https://madhedgefundtrader.com/wp-content/uploads/2019/05/cropped-mad-hedge-logo-transparent-192x192_f9578834168ba24df3eb53916a12c882.png DougD2012-05-01 23:02:272012-05-01 23:02:27The Hard Numbers Behind Selling in May.
DougD

June 1, 2012 - Quote of the Day

Quote of the Day

?If there is no monetary stimulus and no fiscal stimulus, obviously we are going to continue to grow slowly. We could be in secularly slow growth for decades,? said Harvard economics professor, Ken Rogoff.

https://www.madhedgefundtrader.com/wp-content/uploads/2012/06/snail.jpg 267 400 DougD https://madhedgefundtrader.com/wp-content/uploads/2019/05/cropped-mad-hedge-logo-transparent-192x192_f9578834168ba24df3eb53916a12c882.png DougD2012-05-01 23:01:222012-05-01 23:01:22June 1, 2012 - Quote of the Day
DougD

May 2, 2012 - Quote of the Day

Quote of the Day

?If you want to succeed, double your failure rate,? said Thomas Watson, the CEO who built IBM into a global force from the twenties to the fifties. He also said, ?I think there is a world market for maybe five computers.?

https://www.madhedgefundtrader.com/wp-content/uploads/2012/05/thomas_watson.jpg 450 350 DougD https://madhedgefundtrader.com/wp-content/uploads/2019/05/cropped-mad-hedge-logo-transparent-192x192_f9578834168ba24df3eb53916a12c882.png DougD2012-05-01 23:01:132012-05-01 23:01:13May 2, 2012 - Quote of the Day
Page 10 of 10«‹8910

tastytrade, Inc. (“tastytrade”) has entered into a Marketing Agreement with Mad Hedge Fund Trader (“Marketing Agent”) whereby tastytrade pays compensation to Marketing Agent to recommend tastytrade’s brokerage services. The existence of this Marketing Agreement should not be deemed as an endorsement or recommendation of Marketing Agent by tastytrade and/or any of its affiliated companies. Neither tastytrade nor any of its affiliated companies is responsible for the privacy practices of Marketing Agent or this website. tastytrade does not warrant the accuracy or content of the products or services offered by Marketing Agent or this website. Marketing Agent is independent and is not an affiliate of tastytrade. 

Legal Disclaimer

There is a very high degree of risk involved in trading. Past results are not indicative of future returns. MadHedgeFundTrader.com and all individuals affiliated with this site assume no responsibilities for your trading and investment results. The indicators, strategies, columns, articles and all other features are for educational purposes only and should not be construed as investment advice. Information for futures trading observations are obtained from sources believed to be reliable, but we do not warrant its completeness or accuracy, or warrant any results from the use of the information. Your use of the trading observations is entirely at your own risk and it is your sole responsibility to evaluate the accuracy, completeness and usefulness of the information. You must assess the risk of any trade with your broker and make your own independent decisions regarding any securities mentioned herein. Affiliates of MadHedgeFundTrader.com may have a position or effect transactions in the securities described herein (or options thereon) and/or otherwise employ trading strategies that may be consistent or inconsistent with the provided strategies.

Copyright © 2025. Mad Hedge Fund Trader. All Rights Reserved. support@madhedgefundtrader.com
  • Privacy Policy
  • Disclaimer
  • FAQ
Scroll to top