While the Diary of a Mad Hedge Fund Trader focuses on investment over a one week to six-month time frame, Mad Day Trader, provided by Jim Parker, will exploit money-making opportunities over a brief ten minute to three day window. It is ideally suited for day traders, but can also be used by long-term investors to improve market timing for entry and exit points.
While the Diary of a Mad Hedge Fund Trader focuses on investment over a one week to six-month time frame, Mad Day Trader, provided by Jim Parker, will exploit money-making opportunities over a brief ten minute to three day window. It is ideally suited for day traders, but can also be used by long-term investors to improve market timing for entry and exit points.
More than 51 million iPhones sold is good enough for me, 3.2 million more than they moved a year ago, and they are more expensive devices. IPads leapt from 22.9 million to 26 million, including the five high end ones I bought.
The earnings announcement wasn?t that bad, with record quarterly YOY revenues of $57.6 billion reported. Earnings per share jumped a middling 5%, from $13.81 to $14.50, partially in response to the company?s own massive buy back program. ?Gross margins came in at 37.9%, which would be gigantic if Apple were in any other industry but technology.
The dividend was nailed at $3.05 per share, setting the yield today at 2.43% annualized, a mere 30 basis points below ten-year Treasury bonds.
However, I think that traders have become so conditioned to selling on the news that the stock wasn?t going to take a dump no matter what the company said. This is why I went into the release flat on Apple this time. It?s too early in the year to lick wounds. At today?s low of $502, we were down $73 from the recent high, or 12.7%.
If you look back at the collapse after the September, 2012 $706 peak, it took two months for the shares to fall $100. For us to lose money on the Apple February, 2014 $460-$490 bull call spread, it would have to fall twice as fast as back then, and it has to do it in only 17 trading days. Sounds like a good bet to me.
We are also getting huge valuation support down here, with an ex cash multiple of 9, versus a market multiple of 16. Investors are going to hold a gun to the head of their portfolio managers to get them to average up in this neighborhood.
You also have corporate raider, green mailer, and former Manhattan neighbor of mine (activist, to be polite) Carl Icahn twittering away about how cheap the stock is, and buying another $500 million worth of shares today to cash in on the plunge. You can see him coming in every time the stock takes a run at $507. Carl was not a factor in the last melt down.
My whole theory on why Apple has disappointed continuously for the past 18 months is that the company has just gotten too big. A different sort of physics seems to apply when companies exceed $500 billion in market capitalization. The more money the company makes, the cheaper it gets. This is causing even the most seasoned value players to adopt a surly attitude, throw their handsets at their monitors, and tear out there hair, if they have any left.
Steve Jobs must be laughing from the grave.
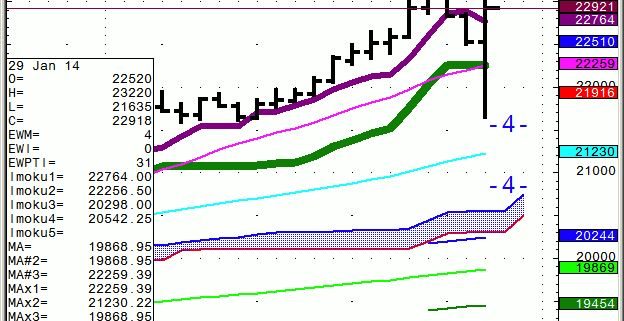
For your edification, I have included a proprietary chart from my colleague, Mad Day Trader Jim Parker, showing huge technical support at the $470-$480 level. It is days like this that Jim is worth hit weight in gold. Too bad he isn?t heavier.
https://www.madhedgefundtrader.com/wp-content/uploads/2014/01/S.APL-1-28-143.jpg496553Mad Hedge Fund Traderhttps://madhedgefundtrader.com/wp-content/uploads/2019/05/cropped-mad-hedge-logo-transparent-192x192_f9578834168ba24df3eb53916a12c882.pngMad Hedge Fund Trader2014-01-29 01:04:032014-01-29 01:04:03Apple Strikes Again
?Taxes are what we pay for a civilized society,? said Oliver Wendell Holmes, a Supreme Court justice servicing at the time of the enactment of the tax code in 1913. The slogan is inscribed in huge letters on the face of the IRS headquarters in Washington DC.
https://www.madhedgefundtrader.com/wp-content/uploads/2013/04/Oliver-Wendell-Holmes.jpg271189Mad Hedge Fund Traderhttps://madhedgefundtrader.com/wp-content/uploads/2019/05/cropped-mad-hedge-logo-transparent-192x192_f9578834168ba24df3eb53916a12c882.pngMad Hedge Fund Trader2014-01-29 01:02:492014-01-29 01:02:49January 29, 2014 - Quote of the Day
As a potentially profitable opportunity presents itself, John will send you an alert with specific trade information as to what should be bought, when to buy it, and at what price. This is your chance to ?look over? John Thomas? shoulder as he gives you unparalleled insight on major world financial trends BEFORE they happen.
Further Update to: Trade Alert -(AAPL)
Buy the Apple (AAPL) February, 2014 $460-$490 bull call spread at $26.85 or best
Opening Trade
1-28-2014
expiration date: 2-21-2014
Portfolio weighting: 10%
Number of Contracts = 4 contracts
Let me tell you my thinking here.
More than 51 million iPhones sold is good enough for me, 3.2 million more than they moved a year ago, and they are more expensive devices. iPads leapt from 22.9 million to 26 million, including the five high end ones I bought.
The earnings announcement wasn?t that bad, with record quarterly YOY revenues of $57.6 billion reported. Earnings per share jumped a middling 5%, from $13.81 to $14.50, partially in response to the company?s own massive buyback program.
Gross margins came in at 37.9%, which would be gigantic if Apple were in any other industry but technology.
The dividend was nailed at $3.05 per share, setting the yield today at 2.43% annualized, a mere 30 basis points below ten-year Treasury bonds.
However, I think that traders have become so conditioned to selling on the news that the stock wasn?t going to take a dump no matter what the company said. This is why I went into the release flat on Apple this time. It?s too early in the year to lick wounds. At today?s low of $502, we were down $73 from the recent high, or 12.7%.
If you look back at the collapse after the September, 2012 $706 peak, it took two months for the shares to fall $100. For us to lose money on the Apple February, 2014 $460-$490 bull call spread, it would have to fall twice as fast as back then, and it has to do it in only 17 trading days. Sounds like a good bet to me.
We are also getting huge valuation support down here, with an ex cash multiple of 9, versus a market multiple of 16. Investors are going to hold a gun to the head of their portfolio managers to get them to average up in this neighborhood.
You also have corporate raider, green mailer, and former Manhattan neighbor of mine (activist, to be polite) Carl Icahn Twittering away about how cheap the stock is, and buying another $500 million worth of shares today to cash in on the plunge. You can see him coming in every time the stock takes a run at $507. Carl was not a factor in the last melt down.
For your edification, I have included a proprietary chart from my colleague, Mad Day Trader Jim Parker, showing huge technical support at the $470-$480 level. It is days like this that Jim is worth his weight in gold. Too bad he isn?t heavier.
The best execution can be had by placing your bid for the entire spread in the middle market and waiting for the market to come to you. The difference between the bid and the offer on these deep in-the-money spread trades can be enormous. Don?t execute the legs individually or you will end up losing much of your profit.
Keep in mind that these are ballpark prices only. Spread pricing can be very volatile on expiration months further out.
Here are the specific trades you need to execute this position:
Buy 4 February, 2014 (AAPL) $460 calls at????.$50.65
Sell short 4 February, 2014 (AAPL) $490 calls a?$23.80
Net Cost:????????????....??..?.?......$26.85
Profit: $30 - $26.85 = $3.15
($3.15 X 100 X 4) = $1,260 ? 1.26% for the notional $100,000 model portfolio.
00Mad Hedge Fund Traderhttps://madhedgefundtrader.com/wp-content/uploads/2019/05/cropped-mad-hedge-logo-transparent-192x192_f9578834168ba24df3eb53916a12c882.pngMad Hedge Fund Trader2014-01-28 14:25:492014-01-28 14:25:49Follow Up to Trade Alert - (AAPL) January 28, 2014
As a potentially profitable opportunity presents itself, John will send you an alert with specific trade information as to what should be bought, when to buy it, and at what price. This is your chance to ?look over? John Thomas? shoulder as he gives you unparalleled insight on major world financial trends BEFORE they happen.Read more
00Mad Hedge Fund Traderhttps://madhedgefundtrader.com/wp-content/uploads/2019/05/cropped-mad-hedge-logo-transparent-192x192_f9578834168ba24df3eb53916a12c882.pngMad Hedge Fund Trader2014-01-28 13:35:202014-01-28 13:35:20Trade Alert - (AAPL) January 28, 2014
While the Diary of a Mad Hedge Fund Trader focuses on investment over a one week to six-month time frame, Mad Day Trader, provided by Jim Parker, will exploit money-making opportunities over a brief ten minute to three day window. It is ideally suited for day traders, but can also be used by long-term investors to improve market timing for entry and exit points.
While the Diary of a Mad Hedge Fund Trader focuses on investment over a one week to six-month time frame, Mad Day Trader, provided by Jim Parker, will exploit money-making opportunities over a brief ten minute to three day window. It is ideally suited for day traders, but can also be used by long-term investors to improve market timing for entry and exit points.
Featured Trade: (FRIDAY FEBRUARY 14 SYDNEY, AUSTRALIA STRATEGY LUNCH), (WHAT THE MARKETS ARE DOING FROM HERE), (SPY), (QQQ), (IWM), (FXY), (TLT), (TBT), (XLF), (XLY), (TURKEY IS ON THE MENU), ?(TUR), (TKC)
SPDR S&P 500 (SPY)
PowerShares QQQ (QQQ)
iShares Russell 2000 (IWM)
CurrencyShares Japanese Yen Trust (FXY)
iShares 20+ Year Treasury Bond (TLT)
ProShares UltraShort 20+ Year Treasury (TBT)
Financial Select Sector SPDR (XLF)
Consumer Discret Select Sector SPDR (XLY)
iShares MSCI Turkey (TUR)
Turkcell Iletisim Hizmetleri AS (TKC)
https://madhedgefundtrader.com/wp-content/uploads/2019/05/cropped-mad-hedge-logo-transparent-192x192_f9578834168ba24df3eb53916a12c882.png00Mad Hedge Fund Traderhttps://madhedgefundtrader.com/wp-content/uploads/2019/05/cropped-mad-hedge-logo-transparent-192x192_f9578834168ba24df3eb53916a12c882.pngMad Hedge Fund Trader2014-01-28 09:28:492014-01-28 09:28:49January 28, 2014
Legal Disclaimer
There is a very high degree of risk involved in trading. Past results are not indicative of future returns. MadHedgeFundTrader.com and all individuals affiliated with this site assume no responsibilities for your trading and investment results. The indicators, strategies, columns, articles and all other features are for educational purposes only and should not be construed as investment advice. Information for futures trading observations are obtained from sources believed to be reliable, but we do not warrant its completeness or accuracy, or warrant any results from the use of the information. Your use of the trading observations is entirely at your own risk and it is your sole responsibility to evaluate the accuracy, completeness and usefulness of the information. You must assess the risk of any trade with your broker and make your own independent decisions regarding any securities mentioned herein. Affiliates of MadHedgeFundTrader.com may have a position or effect transactions in the securities described herein (or options thereon) and/or otherwise employ trading strategies that may be consistent or inconsistent with the provided strategies.