As a potentially profitable opportunity presents itself, John will send you an alert with specific trade information as to what should be bought, when to buy it, and at what price. Read more
While the Diary of a Mad Hedge Fund Trader focuses on investment over a one week to six-month time frame, Mad Day Trader, provided by Bill Davis, will exploit money-making opportunities over a brief ten minute to three day window. It is ideally suited for day traders, but can also be used by long-term investors to improve market timing for entry and exit points. Read more
Global Market Comments
January 13, 2016
Fiat Lux
Featured Trade:
(THE BLACK SWAN SOLUTION TO OUR ENERGY PROBLEMS),
(USO), (TSLA), (GE),
(THE AMERICAN ONSHORING TREND IS ACCELERATING),
(GE), (TSLA),
(TESTIMONIAL)
United States Oil (USO)
Tesla Motors, Inc. (TSLA)
General Electric Company (GE)

I firmly believe that simple solutions to our energy problems are in the process of coming out of the blue, and are something no one is thinking about now.
Add up the contributions of many small improvements, and the cumulative change will alter our economic future beyond all recognition. Here are two of them.
General Electric (GE) is now mass-producing their ?Smart Energy LED Bulb,? which can screw into a conventional socket and produce the same amount of light as a 60-watt bulb, but consume only nine watts of power.
Some 22% of America?s electric power supply is used for lighting, and this bulb could cut our total consumption by 17.6%.
Other bulb manufacturers are getting into the game, like Philips, Osram, Toshiba, and Panasonic, which are already offering more efficient designs. The downside is that, while they last 25,000 hours, or ten times longer than a conventional incandescent bulb, they will initially cost $15-$25.
Economies of scale are expected to bring costs down dramatically in a few years. The Department of Energy has selected Seattle as the test bed for an all LED (light emitting diode) public lighting system.
Here is another game changer for our energy woes. If you double conventional car engine efficiency, US oil consumption drops by half. This is not so hard to do. The US government has already mandated that US car makers achieve an average fleet mileage of 54.5 miles per gallon by 2025.
They are hoping this will lower the cost of gasoline to $1 a gallon by then. They may get their wish this year instead.
One of the first things you learn in a freshman level physics class is how inefficient an internal combustion engine is, using hundreds of moving parts operating at 500 degrees to convert only 25% of the energy input into to motion.?
Tesla?s (TSLA) entire electric drive train has just 11 moving parts, operate at room temperature, and convert 80% of its energy into motion. When they go to the mass market in two years with the $35,000 Tesla 3, it will have a huge impact on our overall energy picture
Add this in with the surging supplies of American shale oil, and the utter collapse of the price of Texas tea (USO) over the past six months is suddenly starts to make incredible sense.

As a potentially profitable opportunity presents itself, John will send you an alert with specific trade information as to what should be bought, when to buy it, and at what price. This is your chance to ?look over? John Thomas? shoulder as he gives you unparalleled insight on major world financial trends BEFORE they happen. Read more
As a potentially profitable opportunity presents itself, John will send you an alert with specific trade information as to what should be bought, when to buy it, and at what price. Read more
While the Diary of a Mad Hedge Fund Trader focuses on investment over a one week to six-month time frame, Mad Day Trader, provided by Bill Davis, will exploit money-making opportunities over a brief ten minute to three day window. It is ideally suited for day traders, but can also be used by long-term investors to improve market timing for entry and exit points. Read more
Global Market Comments
January 12, 2016
Fiat Lux
SPECIAL VOLATILITY ISSUE
Featured Trade:
(A MAD HEDGE STRATEGY CHANGE),
(SPY), (VIX), (XIV),
(VOLATILITY HERE IS PEAKING),
(VIX), (XIV), (VXX), (SPY)
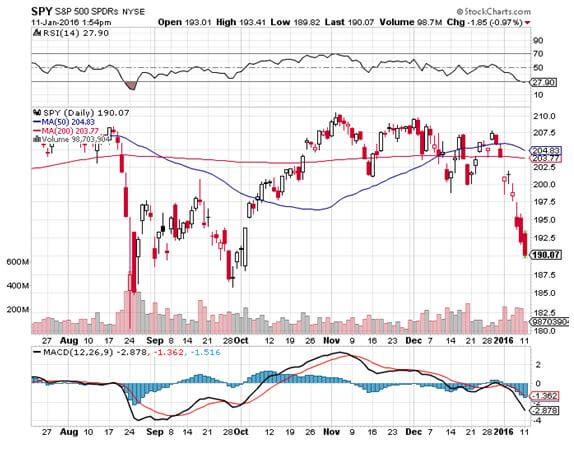
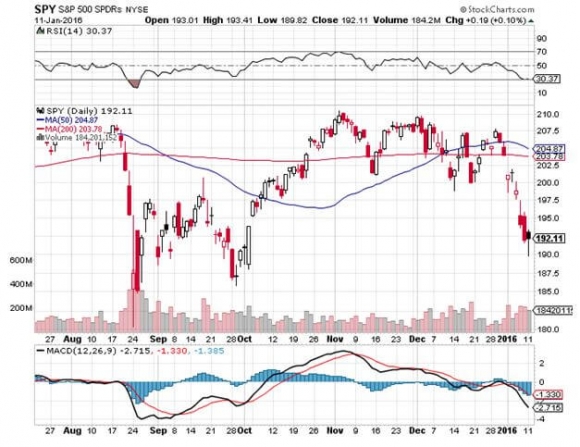
SPDR S&P 500 ETF (SPY)
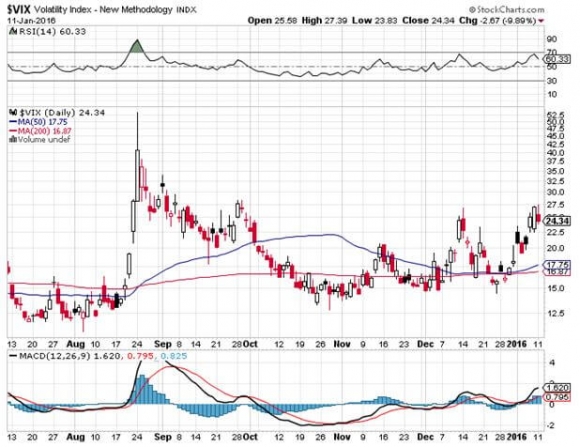
VOLATILITY S&P 500 (^VIX)
VelocityShares Daily Inverse VIX ST ETN (XIV)
iPath S&P 500 VIX ST Futures ETN (VXX)

Followers of my Trade Alert service have noticed some unusual activity during the last two days. Instead of recommending put spreads, I have started advising the purchase of outright puts.
Coming on top of big declines in the S&P 500 (SPY), you may have thought that I have lost my mind, if I hadn?t already done so a long time ago.
My kids would agree with you.
However, there is a method to my madness.
The truly brilliant aspect to the option spread strategy that I have been using for the past four years was that the positions had an embedded short volatility aspect to them.
While you were long volatility with your long leg, this was offset by the short volatility in your short leg.
This gave you a net volatility exposure of close to zero, a great thing to have during a time of secular declining volatility, as we have seen since 2012. Think of the first eight months of 2015, when index prices barely budged.
It also meant that you could achieve your maximum profit when the underlying stock remained unchanged, or moved only a few percent against you.
The nice thing about this low volatility was that it gave time to followers to get in and out of positions before large price changes occurred. Moves of only a few cents before you received trade alerts were common.
By focusing on front month options I also took maximum advantage of accelerated time decay going into each expiration. It was like having a rich uncle write you a check every day.
The low volatility delivered only small changes in the value of your portfolio from the day-to-day movements in the market, tiny enough for the novice investor to live with.
This is what enabled me to produce huge, outsized double digit returns while most other managers were sucking wind.
Since August 24, we have been in a completely different world. The long-term trend in volatility isn?t falling anymore. It has been rising.
What this brought to my trading book was a series of stop outs on options spread positions, whether they were call spreads or put spreads, and painful losses.
This is why I lost money in two out of three months in the recent quarter, a rare event. Having an embedded short volatility position was alas costing me money.
So it is time to adjust our strategy to reflect this brave new, and more volatile world.
So instead of running positions into expiration, I am going to start hedging them with options when a breakdown in the market appears imminent.
This is why I picked up the February $190 puts on Friday to hedge my January $185-$190 calls spread. It is also why I bought the February $187 puts to hedge my January $182-$187 call spread.
Why the mismatch in expirations? It ducks the problem of final week super accelerated time decay with my long puts. It also means I can continue with the short positions after the Friday January expiration, if I choose to do so.
There is one complication with this approach. Individual options are vastly more volatility than option spreads. So it won?t be unusual for an option to move 5%-10% by the time you receive the Trade Alerts. To be forewarned is to be forearmed.
Let?s look at out current positions as examples. For further analysis you have to be familiar with the concept of on option delta. Delta is a letter of the Greek alphabet used by traders to refer to the movement of an option relative to its underlying security.
A delta of 10% means that a $1 move in the underlying produces a 10-cent move in the option, which you see in deep out-of-the-money options. A delta of 90% means that a $1 move in the underlying produces a 90-cent move in the option, which is found with deep-in-the-money options.
The January $185-$190 vertical call debit spread had two legs, and the delta can be calculated as following:
A long January 185 call with a delta of +19%
A short January 190 call with a delta of -39% (negative since you are short)
This gives you a net delta of (39% - 19%) = -20%.
In other words, a $1 move down in the underlying (SPY) index only moves the $185-$190 call spread south by -20 cents.
In the case of the $182-$187 call spread, the net delta is only 14%, giving you a move in the spread of only 14 cents for the $1 (SPY) move.
Let?s say that the market looks like it is going to pieces and I want to hedge my downside exposure. That means I need to buy puts against my long call spread.
Since my net delta is only -20% on the January $185-$190 vertical call debit spread, I only need to buy 20% as many puts to neutralize the position, or 0.2 X 22 = 4.4 options.
To be more aggressive on the downside I increased my put purchase to 13 contracts to also provide extra downside protection of my short volatility (XIV) position. I then repeated this exercise on Monday for the $182-$187 vertical call debit spread.
What we end up with is a portfolio that is profitable at all points with a Friday January 15 (SPY) options expiration between $187-$194. Now you don?t have to touch the position, unless we break out of that range.
This prevents you from attempting to trade every triple digit ratchet in the market between now and then. This is a hopeless exercise. I know because I have tried it many times, to no avail.
Yes, I know this all sounds complicated. But this is how the pros do it. This is how they make money. It?s all about preserving your capital and making incremental profits on top of it. Watch, and learn.
Learn from my errors and prosper.
![Shark]() You Get Used to Them After a While
You Get Used to Them After a While


It is often said that the stock market has discounted 12 out of the last four recessions.
While the market is discounting another recession now, I believe it is one of the many previously forecast that will never happen, a lot like to 18% swoon in the futures markets we saw last summer.
If anything, the reported hard data are showing that the economy is strengthening now, not weakening. The December nonfarm payroll hit a one-year high at 292,000. Christmas sales were off the charts for online merchants.
Auto production topped an 18 million rate. And this is an industry that was bankrupt only seven years ago.
But what else would you expect from a global economy that just has a $2 trillion annual tax cut dumped in its lap, thanks to lower energy prices.
I therefore think we are within days of the final capitulation of this move. That means the Volatility Index (VIX) will peak as well, probably around $30, the top that defined the top of every spike for all of 2015, except for the August 24 flash crash day. That apex is probably only days away.
I am one of those cheapskates who buys Christmas ornaments by the bucket load from Costco in January for ten cents on the dollar, because my eleven month theoretical return on capital comes close to 1,000%.
I also like buying flood insurance in the middle of the summer when the forecast here in California is for endless days of sunshine.
That is what we are facing now with the volatility index (VIX) where premiums have just doubled, from $15 to near $30. Get this one right, and the profits you can realize are spectacular.
Watch carefully for other confirming trends to affirm this trade is unfolding. Those would include a strong dollar, collapsing stocks, and oil in free fall, and a weak Japanese yen, Euro.
I don?t know about you, but I am seeing seven out of seven cross asset confirming price action.
The CBOE Volatility Index (VIX) is a measure of the implied volatility of the S&P 500 stock index, which has been rallying hard since oil began its precipitous slide three weeks ago.
You may know of this from the many clueless talking heads, beginners, and newbies who call this the ?Fear Index?. Long-term followers of my Trade Alert Service profited handsomely after I urged them to sell short this index three years ago with the heady altitude of 47%.
For those of you who have a PhD in higher mathematics from MIT, the (VIX) is simply a weighted blend of prices for a range of options on the S&P 500 index. The formula uses a kernel-smoothed estimator that takes as inputs the current market prices for all out-of-the-money calls and puts for the front month and second month expiration's.
The (VIX) is the square root of the par variance swap rate for a 30 day term initiated today. To get into the pricing of the individual options, please go look up your handy dandy and ever useful Black-Scholes equation. You will recall that this is the equation that derives from the Brownian motion of heat transference in metals. Got all that?
For the rest of you who do not possess a PhD in higher mathematics from MIT, and maybe scored a 450 on your math SAT test, or who don?t know what an SAT test is, this is what you need to know. When the market goes up, the (VIX) goes down. When the market goes down, the (VIX) goes up. End of story. Class dismissed.
The (VIX) is expressed in terms of the annualized movement in the S&P 500, which today is at 1,800. So a (VIX) of $14 means that the market expects the index to move 4.0%, or 72 S&P 500 points, over the next 30 days.
You get this by calculating $14/3.46 = 4.0%, where the square root of 12 months is 3.46. The volatility index doesn?t really care which way the stock index moves. If the S&P 500 moves more than the projected 4.0%, you make a profit on your long (VIX) positions.
Probability statistics suggest that there is a 68% chance (one standard deviation) that the next monthly market move will stay within the 4.0% range. I am going into this detail because I always get a million questions whenever I raise this subject with volatility-deprived investors.
It gets better. Futures contracts began trading on the (VIX) in 2004, and options on the futures since 2006. Since then, these instruments have provided a vital means through which hedge funds control risk in their portfolios, thus providing the ?hedge? in hedge fund.
But wait, there?s more. Now, erase the blackboard and start all over. Why should you care? If you sell short the (VIX) here at $24, you are picking up a derivative at a nice overbought level. Only prolonged, ?buy and hold? bull markets see volatility stay under $14 for any appreciable amount of time. That?s probably what we have now.
If you are a trader you can sell short the (VIX) futures somewhere over $20 and expect an easy profit sometime in the coming weeks. If we get another 5% rally somewhere along that way, that would do it.
If you don?t want to sell the (VIX) futures or options outright, then you can always sell short the iPath S&P 500 VIX Short Term Futures ETN (VXX). Better yet, you can buy a short (VIX) ETN outright, the Velocity Shares Daily Inverse VIX Short Term ETN (XIV).
If you make money on this trade, it will offset losses on other long positions.
No one who buys fire insurance ever complains when their house doesn?t burn down.