While the Diary of a Mad Hedge Fund Trader focuses on investment over a one week to six-month time frame, Mad Day Trader, provided by Bill Davis, will exploit money-making opportunities over a brief ten minute to three day window. It is ideally suited for day traders, but can also be used by long-term investors to improve market timing for entry and exit points. Read more
While the Diary of a Mad Hedge Fund Trader focuses on investment over a one week to six-month time frame, Mad Day Trader, provided by Bill Davis, will exploit money-making opportunities over a brief ten minute to three day window. It is ideally suited for day traders, but can also be used by long-term investors to improve market timing for entry and exit points. Read more
Global Market Comments
June 8, 2018
Fiat Lux
Featured Trade:
(LAST CHANCE TO ATTEND THE TUESDAY, JUNE 12, 2018,
NEW ORLEANS, LA, GLOBAL STRATEGY LUNCHEON),
(JUNE 6 BIWEEKLY STRATEGY WEBINAR Q&A),
(TLT), (TTT), (TBT), (AMLP), (IBB),
(SPY), (SDS), (SH), (GS), (BAC)
Come join me for lunch at the Mad Hedge Fund Trader's Global Strategy Update, which I will be conducting in New Orleans, LA, on Tuesday, June 12, 2018. An excellent meal will be followed by a wide-ranging discussion and an extended question-and-answer period.
I'll be giving you my up-to-date view on stocks, bonds, currencies, commodities, precious metals, and real estate. And to keep you in suspense, I'll be throwing a few surprises out there, too. Tickets are available for $268.
I'll be arriving at 11:30 AM, and leaving late in case anyone wants to have a one-on-one discussion, or just sit around and chew the fat about the financial markets.
The lunch will be held at an exclusive downtown restaurant. The precise location will be emailed with your purchase confirmation.
I look forward to meeting you and thank you for supporting my research.
To purchase tickets for the luncheon, click on our online store.

Below please find subscribers' Q&A for the Mad Hedge Fund Trader June 6 Global Strategy Webinar with my guest and co-host Bill Davis of the Mad Day Trader.
As usual, every asset class long and short was covered. You are certainly an inquisitive lot, and keep those questions coming!
Q: What does the coming Kim Jong-un summit with North Korea mean for the market?
A: It means absolutely nothing for the market. The entire North Korean threat has been wildly exaggerated as a distraction from the chaos in Washington. So, you may get a one- or two-day rally if it's successful. If it's not expect a one- or two-day sell-off, but no more. Whatever North Korea agrees to, we will not see any follow through; they won't buy the Libyan model of denuclearizing North Korea for fear of their leader meeting the same end as Libya's Khadafy (i.e. being hunted and shot in a storm drain.) North Korea will never give up its nuclear weapons.
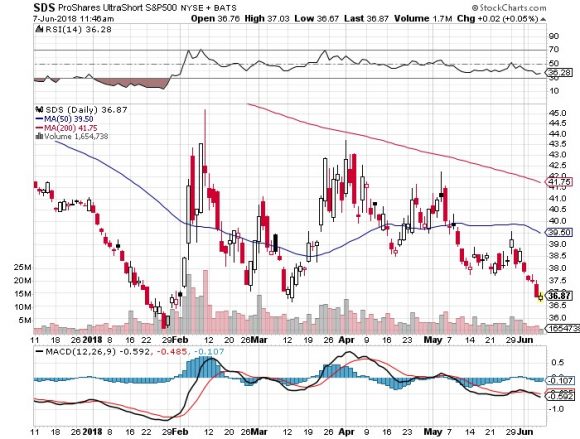
Q: What do you do at market tops?
A: Well, hopefully if you're reading this letter you're long up the wazoo, so you sell everything you have. Then, wait for a double top in the market (which is clear as day) and falling volume. You start looking at things like the ProShares Ultra Short S&P 500 ETF (SDS). That's the -2X version (there's the (SH), which is the -1X short S&P 500) and you just start buying outright puts on a lot of different things, particularly the overbought sectors of the market, which are generally pretty obvious. It's also good to look for a stock that has made a new high and has negative money flow.
Q: Why are the banks doing so poorly?
A: I believe they fully discounted all of this year's interest rate hikes last year when the stocks nearly doubled. We just talked about a technical setup; Goldman Sachs (GS), Bank of America (BAC), and other stocks had those bear setups. At this point, I believe they're coming down to a place of support and probably getting a decent dead cat bounce. They've had their sell-off, they had their run, and it was triggered by one of the best technical short setup patterns you'll see.
Q: Would you buy financials here?
A: Absolutely not. It's unclear why they're doing so badly, but I would not buy it with anyone's money. Their earnings growth is nowhere what you see with technology stocks.
Q: Is crude oil poised for the next leg up?
A: No, it's not. The oil game may be over if they rush to overproduce once again. It's clearly been artificially boosted to get the Saudi Aramco IPO done. After the end of the quota system, you can get oil back down to the $50s easily. I don't want to touch it here; if anything, I'm more inclined to buy it if we get down to the $50s, which would essentially be the February low.
Q: Is the U.S. dollar overbought here?
A: Yes. The dollar has had a great run all year, which is evident from the rising interest rates. It's done a 10% move up in a fairly short time, which is a lot for the foreign exchange market. It's way overbought; you could easily get a round of profit taking in the dollar, either going into or right after the next Fed interest rate hike in two weeks. I'm staying away from the currencies. There are too many better fish to fry in the equities.
Q: Can you expect Tech to keep going up after this next run?
A: Yes, I expect us to break out to a new high and give back some ground in a retest of the old high. The old high will then hold and then I expect a sort of slow grind up. Tech could well go up for the rest of 2018.
Q: If the S&P 500 is in a trading range, would you sell any rally?
A: Yes, but I'm going to wait for the rally to come to me; I'm not going to reach for any marginal trades. When the (SPY) gets to $280, I'll be looking very closely at the $285-$290 vertical bear put spread one or two months out. So, that peak should hold for the summer and you can make a good 25%-30% on that kind of spread.
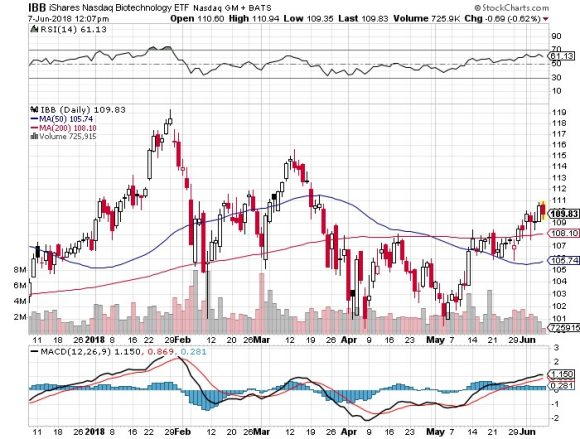
Q: Would you buy Biotech here?
A: Yes, the chart setup here is looking very positive, and it's natural for people to rotate out of Tech to Biotech because the earnings growth is so dramatic. That's why I sent out a Trade Alert to buy the NASDAQ Biotechnology ETF (IBB) yesterday. They have been unfairly held back by fears of drug pricing regulation, which has nothing to do with biotech, but it affects their share prices anyway. But so far, it has been all talk from Trump and no action. I think he's busy with North Korea and the trade wars anyway.
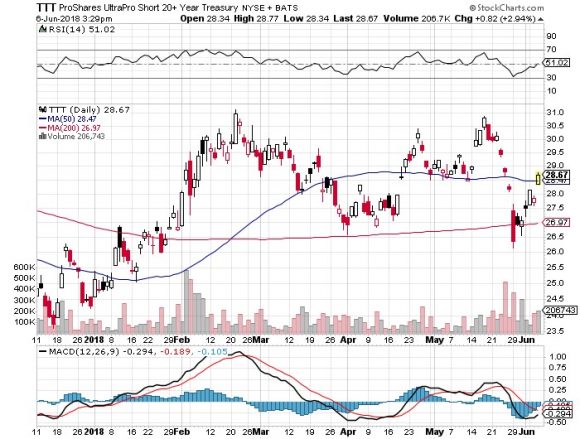
Q: My custodian won't let me sell short the United States Treasury Bond Fund (TLT) so I bought the ProShares Ultra Pro Short 20+ Treasury Fund (TTT). Is that alright?
A: You definitely want to be short the Treasury bonds market for the next several years going forward, so you have the right idea. If the 10-year U.S. Treasury bond yield jumps from 2.95% today to 4% in a year as I expect, that takes the (TLT) down from $119 to $97. If you can't make money shorting bonds in that environment you should consider another line of work.
The problem with these 3X leveraged funds is that the cost of carry is very high. In the case of the (TTT) it is three times the 3.0% 10-year bond coupon you are shorting plus a 1% management fee for a total of 10% a year. For that reason, the 3X funds are really only good for day trading. You run into a similar problem with the 2X (TBT). This is why I use non-leveraged put spreads or outright puts for this asset class.
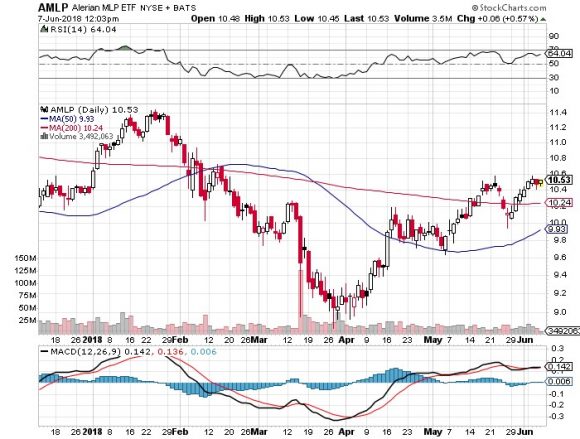
Q: Why are we seeing strength in the Alerian master limited partnership (AMLP) when oil prices are falling, and interest rates are rising? Shouldn't it be going the other way?
A: How about more buyers than sellers? There are so many retirees out there desperate for yield they will take on inordinate amounts of risk to get it. With an 8.0% dividend yield you always have an underlying bid for this ETF. That's why we have been recommending this since April. An 8% dividend can cover up a lot of sins, even when interest rates are rising and oil prices are falling. Also, the U.S. is infrastructure constrained now that production is approaching 11 million barrels a day. That is great for the kind of energy projects (AMLP) finances.
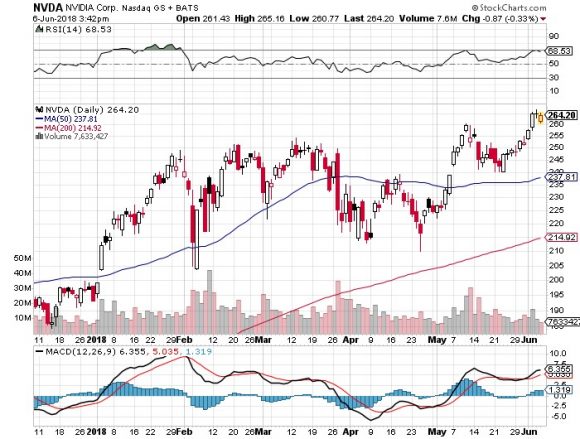
Q: What's the next support price for NVIDIA (NVDA)?
A: With the stock going straight up there is little need for support. Our 2018 target is $300. If you recall, we have been recommending this cutting-edge GPU manufacturer since $68, and people have made fortunes. Those who bought long dated deep out-of-the-money leaps $100 out made 1,000% on this Trade Alert 18 months ago. That said, the 200-day moving average at $213 looks rock solid.
Good luck and good trading to all.
John Thomas
CEO & Publisher
Diary of a Mad Hedge Fund Trader

Mad Hedge Technology Letter
June 8, 2018
Fiat Lux
Featured Trade:
(WILL SYNBIO SAVE OR DESTROY THE WORLD?),
(XLV), (XPH), (XBI), (MON), (IBM), (GOOG), (AAPL), (CSCO)

While the Diary of a Mad Hedge Fund Trader focuses on investment over a one week to six-month time frame, Mad Day Trader, provided by Bill Davis, will exploit money-making opportunities over a brief ten minute to three day window. It is ideally suited for day traders, but can also be used by long-term investors to improve market timing for entry and exit points. Read more
Global Market Comments
June 7, 2018
Fiat Lux
Featured Trade:
(LAST CHANCE TO ATTEND THE MONDAY, JUNE 11, 2018, FORT WORTH, TEXAS, GLOBAL STRATEGY LUNCHEON),
(WHY THE STOCK MARKET WILL PEAK ON MAY 10, 2019, AT 4:00 PM EST),
(A COW-BASED ECONOMICS LESSON)
Come join me for lunch at the Mad Hedge Fund Trader's Global Strategy Update, which I will be conducting in Fort Worth, Texas, on Monday, June 11, 2018. An excellent meal will be followed by a wide-ranging discussion and an extended question-and-answer period.
I'll be giving you my up-to-date view on stocks, bonds, currencies, commodities, precious metals, and real estate. And to keep you in suspense, I'll be throwing a few surprises out there, too. Tickets are available for $248.
I'll be arriving at 11:30 AM, and leaving late in case anyone wants to have a one-on-one discussion, or just sit around and chew the fat about the financial markets.
The lunch will be held at an exclusive downtown private club. The precise location will be emailed with your purchase confirmation.
I look forward to meeting you and thank you for supporting my research.
To purchase tickets for the luncheon, click here.


This prediction is not as absurd as it sounds.
There is in fact a logical mathematical path that gets us precisely there.
If there is one question I get asked more than any other as a 50-year market veteran, it is "When will stocks peak out?"
You can blame recent memory.
Those who followed my advice, bailed at the market 2008 top, and then heavily shorted bank shares laughed all the way to the bank.
Nonbelievers who didn't got slaughtered, questioning whether they'd ever touch another stock again.
We're about to replay that movie.
By now, the reasons behind the runaway bull market are familiar to all.
Even my gardener, cleaning lady, and shoeshine boy know by now.
They are also asking if they should be buying bitcoin, after it has made the move from $1 to $6,000.
So let me tell you how I get to such a precise top in the current move.
This time it WON'T be different.
The Fed will definitely trigger the next recession.
But it will be different in that the next recession will be prompted by a much lower interest rate spike than seen at past market tops.
Blame deflation.
We already know that stock markets accelerate their appreciation at the beginning of every tightening cycle.
So far, so good.
Assume that the Fed continues "normalizing" interest rates by raising 25 basis points a quarter for the next five quarters.
That takes the overnight Fed funds rate up to a 2.50% to 2.75% range by December 2018.
This will create an inverted yield curve whereby short-term rates are higher than the present 2.38% 10- year Treasury bond yield.
Bond yield will also rise and prices fall, but not by much.
There is just too much money around.
Over the past 100 years, inverted yield curves have had an average life of 14 months, within a range of nine to 19 months.
At first, rising interest rates INCREASE borrowing dramatically, as investors scramble to beat the move.
This enables them to make up for shrinking profit margins caused by higher rates by increasing size.
This is already happening in a major way.
When the return finally turns negative, they then dump EVERYTHING, causing interest rates to explode, igniting a recession.
That's when 10-year Treasury bonds spike to 4%, or even 5%.
This has a recession beginning 14 months after the December 15, 2018 Fed meeting, or February 2020.
Historically, stock markets peak exactly 7.2 months before a recession, so this takes us back to August 2019.
Back out three more months for a "Sell in May and go away" effect.
Bear markets usually begin on Mondays (remember the many Black Mondays of our careers?) because investors are prone to digest deteriorating market technicals and fundamentals over a weekend and then panic at the first opportunity.
I expected the Dow Average to plunge at least 400 points at the following that Monday opening.
Add all this together, and you arrive at my target market peak of Friday, May 10, 2019 at 4:00 PM EST. Look for a final spike into the close.
You may catch me gingerly stepping out of the market a few weeks or months before that.
As my late mentor Barton Biggs used to say, "Always leave the last 10% of a move for the next guy."
Remember also that once stocks start to go in reverse, liquidity will completely vaporize right when numerous risk protection algorithms simultaneously kick in.
So the bigger institutions will start scaling out of major positions well before then. This, by the way, helps set up the negative technicals that create the top.
Of course, any number of black swans can move this timetable forward, which I have covered in previous letters (North Korea, impeachment, no tax cuts, etc.).
So I may be making necessary adjustments to my market top target date along the way.
And here's the scary part.
Stock markets could rise another 20% to 25% before they peak out. That takes the Dow Average to a neat 28,750.
So despite knowing the blowup day well in advance, you're still going to have to stay in the market, lest you lose all your clients.
After all, they don't pay fat fees for us to hide in a cave somewhere and sit on our hands.
So, you wanted to be in show business?
When a client asks you the favorite question of the day, he will be suitably impressed when you provide him with the above answer, as he should be.
In fact, he will probably give you more money to manage.
As he should do.
Remember that date, May 10, 2019 at 4:00 PM EST!
I have already marked it on my calendar.
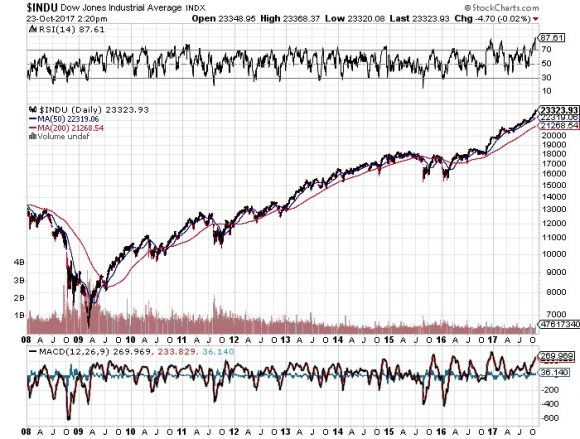

Picking a Market Top is Simple Logic