When John identifies a strategic exit point, he will send you an alert with specific trade information as to what security to sell, when to sell it, and at what price. Most often, it will be to TAKE PROFITS, but, on rare occasions, it will be to exercise a STOP LOSS at a predetermined price to adhere to strict risk management discipline.Read more
https://www.madhedgefundtrader.com/wp-content/uploads/2016/02/Alert-e1457452190575.jpg135150Mad Hedge Fund Traderhttps://madhedgefundtrader.com/wp-content/uploads/2019/05/cropped-mad-hedge-logo-transparent-192x192_f9578834168ba24df3eb53916a12c882.pngMad Hedge Fund Trader2020-02-26 10:30:022020-02-26 10:43:22Trade Alert - (AAPL) February 26, 2020 - BUY
When John identifies a strategic exit point, he will send you an alert with specific trade information as to what security to sell, when to sell it, and at what price. Most often, it will be to TAKE PROFITS, but, on rare occasions, it will be to exercise a STOP LOSS at a predetermined price to adhere to strict risk management discipline.Read more
https://www.madhedgefundtrader.com/wp-content/uploads/2016/02/Alert-e1457452190575.jpg135150Mad Hedge Fund Traderhttps://madhedgefundtrader.com/wp-content/uploads/2019/05/cropped-mad-hedge-logo-transparent-192x192_f9578834168ba24df3eb53916a12c882.pngMad Hedge Fund Trader2020-02-26 10:29:122020-02-26 10:29:12Trade Alert - (AMZN) February 26, 2020 - BUY
==While the Diary of a Mad Hedge Fund Trader focuses on investment over a one week to a six-month time frame, Mad Day Trader, provided by Bill Davis, will exploit money-making opportunities over a brief ten minute to three-day window. It is ideally suited for day traders, but can also be used by long-term investors to improve market timing for entry and exit points.Read more
https://madhedgefundtrader.com/wp-content/uploads/2019/05/cropped-mad-hedge-logo-transparent-192x192_f9578834168ba24df3eb53916a12c882.png00Mad Hedge Fund Traderhttps://madhedgefundtrader.com/wp-content/uploads/2019/05/cropped-mad-hedge-logo-transparent-192x192_f9578834168ba24df3eb53916a12c882.pngMad Hedge Fund Trader2020-02-26 09:21:512020-02-26 09:21:51February 26, 2020 - MDT Pro Tips A.M.
With global stock markets in free fall and interest rates everywhere headed to zero, the outlook for gold has gone from strength to strength.
Shunned as the pariah of the financial markets for years, the yellow metal has suddenly become everyone’s favorite hedge.
Now that gold is back in fashion, how high can it really go?
The question begs your rapt attention, as the Coronavirus has suddenly unleashed a plethora of new positive fundamentals for the barbarous relic.
It turns out that gold is THE deflationary asset to own. Who knew?
I was an unmitigated bear on the price of gold after it peaked in 2011. In recent years, the world has been obsessed with yields, chasing them down to historically low levels across all asset classes.
But now that much of the world already has, or is about to have negative interest rates, a bizarre new kind of mathematics applies to gold ownership.
Gold’s problem used to be that it yielded absolutely nothing, cost you money to store, and carried hefty transactions costs. That asset class didn’t fit anywhere in a yield-obsessed universe.
Now we have a horse of a different color.
Europeans wishing to put money in a bank have to pay for the privilege to do so. Place €1 million on deposit on an overnight account, and you will have only 996,000 Euros in a year. You just lost 40 basis points on your -0.40% negative interest rate.
With gold, you still earn zero, an extravagant return in this upside-down world. All of a sudden, zero is a win.
For the first time in human history, that gives you a 40-basis point yield advantage by gold over Euros. Similar numbers now apply to Japanese yen deposits as well.
As a result, the numbers are so compelling that it has sparked a new gold fever among hedge funds and European and Japanese individuals alike.
Websites purveying investment grade coins and bars crashed multiple times last week, due to overwhelming demand (I occasionally have the same problem). Some retailers have run out of stock.
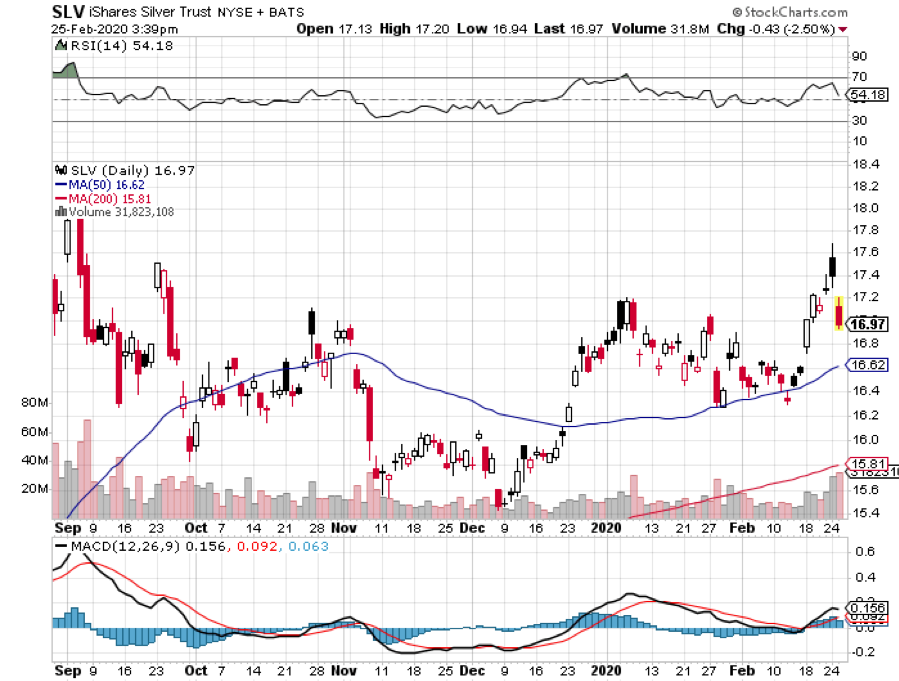
And last week, the virus went pandemic as silver rocketed 8.6% and others like Palladium (PALL) were also frenetically bid.
So I’ll take this opportunity to review a short history of the gold market (GLD) for the young and the uninformed.
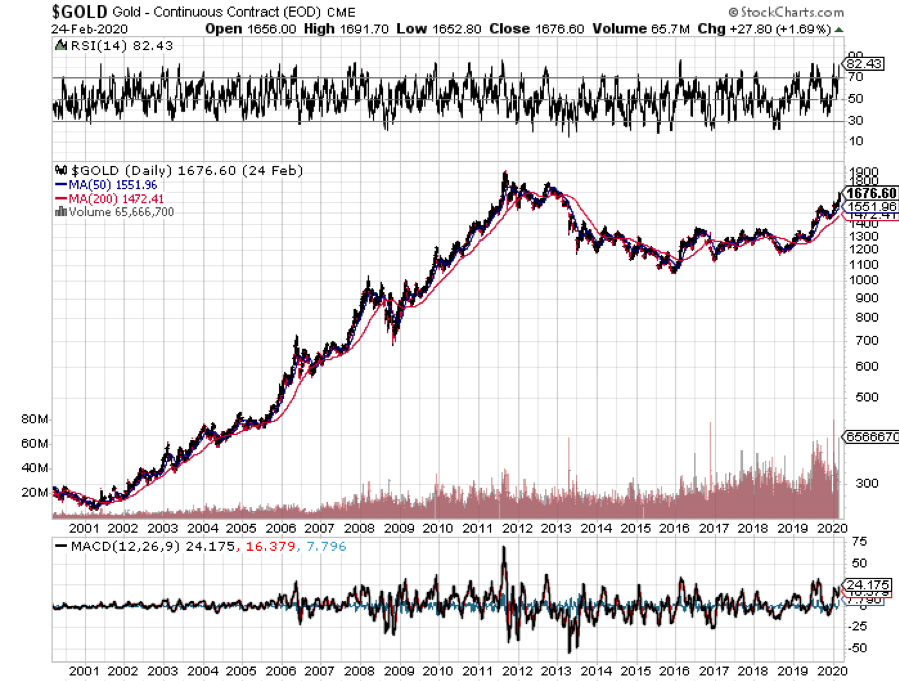
Since it last peaked in the summer of 2011 at $1,927 an ounce, the barbarous relic was beaten like the proverbial red-headed stepchild, dragging silver (SLV) down with it. It faced a perfect storm.
Gold was traditionally sought after as an inflation hedge. But with economic growth weak, wages stagnant, and much work still being outsourced abroad, deflation became rampant.
The biggest buyers of gold in the world, the Indians, have seen their purchasing power drop by half, thanks to the collapse of the rupee against the US dollar. The government increased taxes on gold in order to staunch precious capital outflows.
Chart gold against the Shanghai index, and the similarity is striking, until negative interest rates became widespread in 2016.
In the meantime, gold supply/demand balance was changing dramatically.
While no one was looking, the average price of gold production soared from $5 in 1920 to $1,400 today. Over the last 100 years, the price of producing gold has risen four times faster than the underlying metal.
It’s almost as if the gold mining industry is the only one in the world which sees real inflation, since costs soared at a 15% annual rate for the past five years.
This is a function of what I call “peak gold.” They’re not making it anymore. Miners are increasingly being driven to higher risk, more expensive parts of the world to find the stuff.
You know those tires on heavy dump trucks? They now cost $200,000 each, and buyers face a three-year waiting list to buy one.
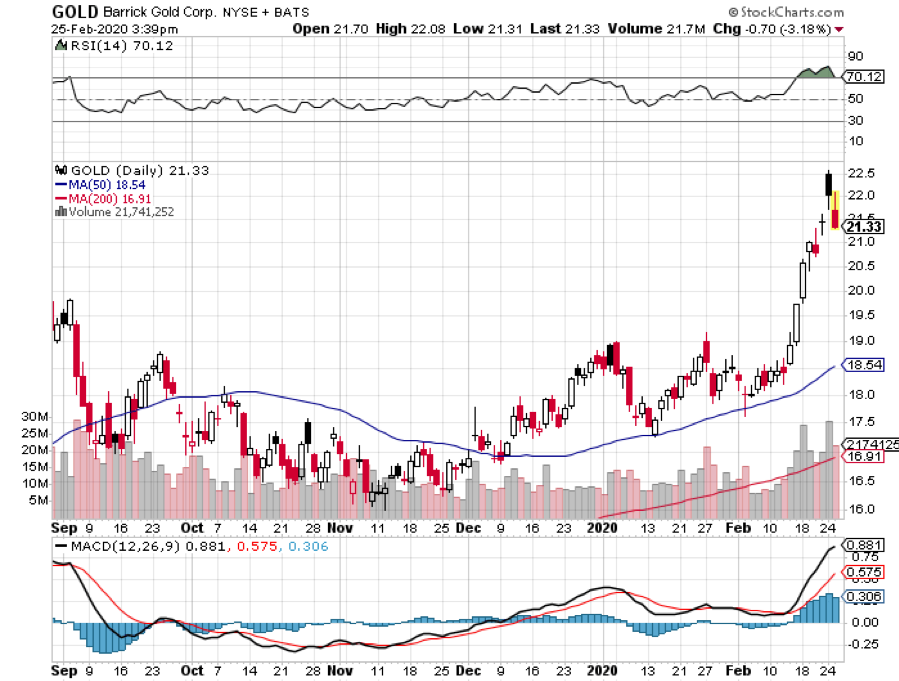
Barrick Gold (GOLD), the world’s largest gold miner, didn’t try to mine gold at 15,000 feet in the Andes, where freezing water is a major problem, because they like the fresh air.
What this means is that when the spot price of gold fell below the cost of production, miners simply shut down their most marginal facilities, drying up supply. That has recently been happening on a large scale.
Barrick Gold, a client of the Mad Hedge Fund Trader, can still operate, as older mines carry costs that go all the way down to $600 an ounce.
No one is going to want to supply the sparkly stuff at a loss. So, supply disappeared.
I am constantly barraged with emails from gold bugs who passionately argue that their beloved metal is trading at a tiny fraction of its true value, and that the barbaric relic is really worth $5,000, $10,000, or even $50,000 an ounce (GLD).
They claim the move in the yellow metal we are seeing now is only the beginning of a 30-fold rise in prices, similar to what we saw from 1972 to 1979, when it leapt from $32 to $950.
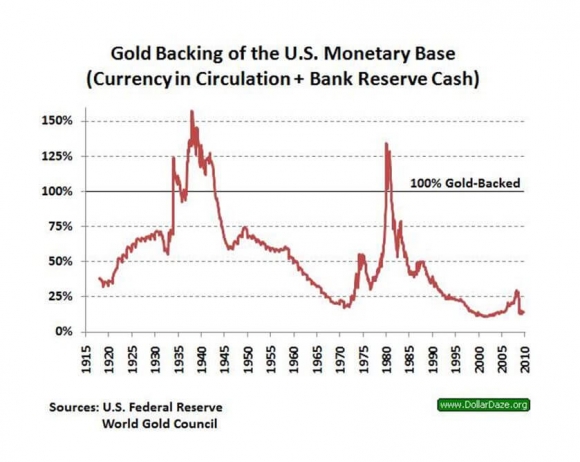
So, when the chart below popped up in my inbox showing the gold backing of the US monetary base, I felt obligated to pass it on to you to illustrate one of the intellectual arguments these people are using.
To match the gain seen since the 1936 monetary value peak of $35 an ounce, when the money supply was collapsing during the Great Depression, and the double top in 1979 when gold futures first tickled $950, this precious metal has to increase in value by 800% from the recent $1,050 low. That would take our barbarous relic friend up to $8,400 an ounce.
To match the move from the $35/ounce, 1972 low to the $950/ounce, 1979 top in absolute dollar terms, we need to see another 27.14 times move to $28,497/ounce.
Have I gotten your attention yet?
I am long term bullish on gold, other precious metals, and virtually all commodities for that matter. But I am not that bullish. These figures make my own $2,300/ounce long-term prediction positively wimp-like by comparison.
The seven-year spike up in prices we saw in the seventies, which found me in a very long line in Johannesburg, South Africa to unload my own Krugerrands in 1979, was triggered by a number of one-off events that will never be repeated.
Some 40 years of unrequited demand was unleashed when Richard Nixon took the US off the gold standard and decriminalized private ownership in 1972. Inflation then peaked around 20%. Newly enriched sellers of oil had a strong historical affinity with gold.
South Africa, the world’s largest gold producer, was then a boycotted international pariah and teetering on the edge of disaster. We are nowhere near the same geopolitical neighborhood today, and hence, my more subdued forecast.
But then again, I could be wrong.
In the end, gold may have to wait for a return of real inflation to resume its push to new highs. The previous bear market in gold lasted 18 years, from 1980 to 1998, so don’t hold your breath.
What should we look for? The surprise that your friends get out of the blue pay increase, the largest component of the inflation calculation.
This is happening now in technology and is slowly tricking down to minimum wage workers. When I visit open houses in my neighborhood in San Francisco, half the visitors are thirty-somethings wearing hoodies offering to pay cash.
It could be a long wait for real inflation, possibly into the mid-2020s, when shocking wage hikes spread elsewhere.
I’ll be back playing gold again, given a good low-risk, high-return entry point.
You’ll be the first to know when that happens.
As for the many investment advisor readers who have stayed long gold all along to hedge their clients' other risk assets, good for you.
You’re finally learning!
https://www.madhedgefundtrader.com/wp-content/uploads/2014/07/John-Thomas-Gold-e1455831491219.jpg297400DougDhttps://madhedgefundtrader.com/wp-content/uploads/2019/05/cropped-mad-hedge-logo-transparent-192x192_f9578834168ba24df3eb53916a12c882.pngDougD2020-02-26 08:04:052020-05-11 14:24:36The Super Bull Argument for Gold
The world finally cared about the coronavirus and this meant the spreading of it from Chinese soil to other regions of the world with meaningful foreign death tolls.
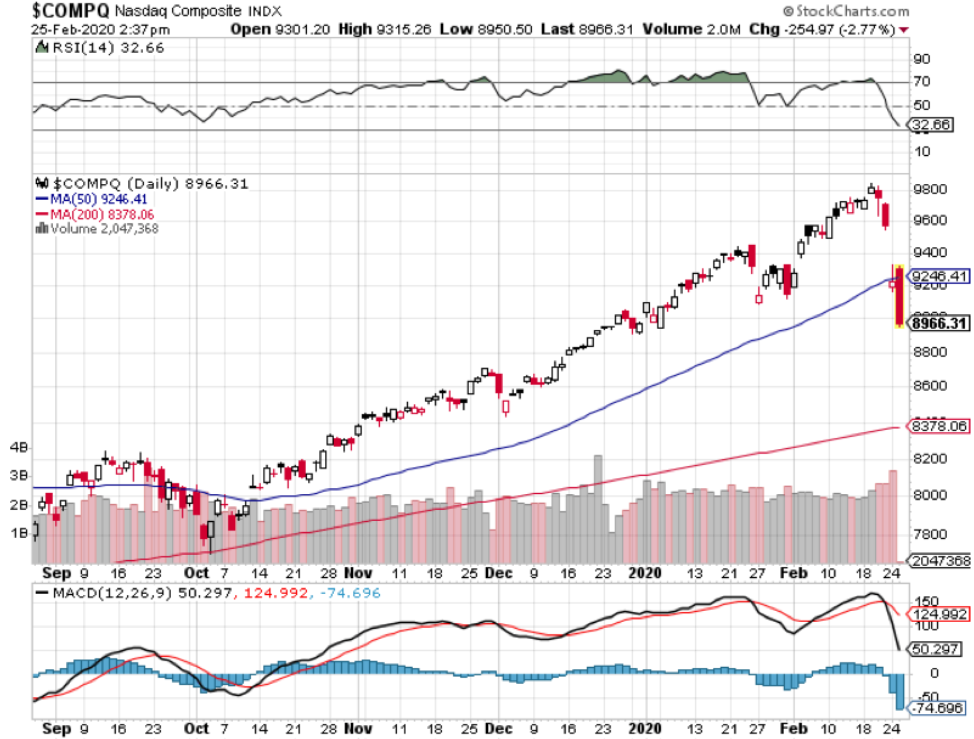
Tech shares, for a time, became the de facto safe haven for coronavirus investors to hide out until Iran and South Korea reported an explosion of cases on the same day.
Tech shares bore the brunt of the carnage in the markets and have experienced one of the worst 2-day performances in the history of the technology-dominated Nasdaq index.
Global supply chains are in a state of paralysis as the Middle Kingdom has turned into 1.4 billion homesitters.
Even worse, the rapid spread of the virus hits home the fact that other parts of the world could enter an imminent lockdown on business.
This is bearish for not only the standard tech multinational, but all global operations and economy.
Many tech traders were wiped out unable to sell in the frantic sell-off.
We will get the lowdown on how some tech-based hedge funds went bust shortly because more than a few bet on a quick coronavirus solution.
Well, this is not a 1-day fix and Mr. Market is always correct.
The truth is that this virus is sowing economic uncertainty across the globe and there are really 2 ways from here, will it get worse or better?
If further meaningful contagion is prevented in the next few days, there could be a massive rally in many of the best in show that tech has to offer.
However, that seems implausible.
If new cases vanish from the headlines for a few days, a relief rally will be on our hands, but there are reports as we speak from Austria, Spain, and Romania.
Investors are waiting for bullish crumbs like a Central Bank announcement or vaccine development to help, but that likely won’t stem the negative momentum or come in time.
The virus also destroys any potential tech IPOs this year such as Airbnb, and they will most likely shelve their IPO and wait for the virus and its fallout to dissipate.
The debt market will also be hesitant to give the benefit of the doubt to major loss-makers like Lyft and Uber who have poor unit economics.
Apple, Facebook, Amazon, Microsoft and Google-parent Alphabet comprise over 20% of the S&P and lost a combined $250 billion in one trading day then backed that up with an even worse loss.
Then there is the pending situation of if the Chinese economy isn’t up and running soon, “millions” of local businesses could go bust in the second biggest economy.
So even if a consensus thesis of stock markets usually powering through pandemics is still valid, the economic damage could be too hideous to ignore sending markets even lower.
One of the ironic winners of this horrid virus has been Bitcoin which has seen a price rise 15% in the last one month.
A global pandemic strengthens the use case for this “digital gold” almost signaling that the current governing status quo and monetary system are unfit for operation.
Now is not the time to dive in and bet the ranch.
The likelihood of the coronavirus halting tech’s ability to operate grows higher by the hour.
Risks are currently skewed to the downside with the market pricing into tech shares that the coronavirus will spread inside the U.S. and affect tech firms’ profitability for the rest of 2020 and even perhaps bring forward a global tech recession.
A tech recession is not yet off the table, and the policy response will be vital if the contagion spirals out of control.
The Mad Hedge Technology Letter is 100% in cash and readers should wait for the dip to bottom out.
https://madhedgefundtrader.com/wp-content/uploads/2019/05/cropped-mad-hedge-logo-transparent-192x192_f9578834168ba24df3eb53916a12c882.png00Mad Hedge Fund Traderhttps://madhedgefundtrader.com/wp-content/uploads/2019/05/cropped-mad-hedge-logo-transparent-192x192_f9578834168ba24df3eb53916a12c882.pngMad Hedge Fund Trader2020-02-26 08:02:142020-05-11 13:13:19What's Behind the Tech Meltdown
“A.I. is probably the most important thing humanity has ever worked on.” – Said Alphabet CEO Sundar Pichai
https://www.madhedgefundtrader.com/wp-content/uploads/2020/02/pichai.png208229Mad Hedge Fund Traderhttps://madhedgefundtrader.com/wp-content/uploads/2019/05/cropped-mad-hedge-logo-transparent-192x192_f9578834168ba24df3eb53916a12c882.pngMad Hedge Fund Trader2020-02-26 08:00:542020-02-26 07:49:46February 26, 2020 - Quote of the Day
When John identifies a strategic exit point, he will send you an alert with specific trade information as to what security to sell, when to sell it, and at what price. Most often, it will be to TAKE PROFITS, but, on rare occasions, it will be to exercise a STOP LOSS at a predetermined price to adhere to strict risk management discipline.Read more
https://www.madhedgefundtrader.com/wp-content/uploads/2016/02/Alert-e1457452190575.jpg135150Mad Hedge Fund Traderhttps://madhedgefundtrader.com/wp-content/uploads/2019/05/cropped-mad-hedge-logo-transparent-192x192_f9578834168ba24df3eb53916a12c882.pngMad Hedge Fund Trader2020-02-25 11:06:342020-02-25 23:13:36Trade Alert - (PYPL) February 25, 2020 - SELL-STOP LOSS
==While the Diary of a Mad Hedge Fund Trader focuses on investment over a one week to a six-month time frame, Mad Day Trader, provided by Bill Davis, will exploit money-making opportunities over a brief ten minute to three-day window. It is ideally suited for day traders, but can also be used by long-term investors to improve market timing for entry and exit points.Read more
https://madhedgefundtrader.com/wp-content/uploads/2019/05/cropped-mad-hedge-logo-transparent-192x192_f9578834168ba24df3eb53916a12c882.png00Mad Hedge Fund Traderhttps://madhedgefundtrader.com/wp-content/uploads/2019/05/cropped-mad-hedge-logo-transparent-192x192_f9578834168ba24df3eb53916a12c882.pngMad Hedge Fund Trader2020-02-25 10:42:402020-02-26 00:09:58February 25, 2020 - MDT Pro Tips A.M.
Legal Disclaimer
There is a very high degree of risk involved in trading. Past results are not indicative of future returns. MadHedgeFundTrader.com and all individuals affiliated with this site assume no responsibilities for your trading and investment results. The indicators, strategies, columns, articles and all other features are for educational purposes only and should not be construed as investment advice. Information for futures trading observations are obtained from sources believed to be reliable, but we do not warrant its completeness or accuracy, or warrant any results from the use of the information. Your use of the trading observations is entirely at your own risk and it is your sole responsibility to evaluate the accuracy, completeness and usefulness of the information. You must assess the risk of any trade with your broker and make your own independent decisions regarding any securities mentioned herein. Affiliates of MadHedgeFundTrader.com may have a position or effect transactions in the securities described herein (or options thereon) and/or otherwise employ trading strategies that may be consistent or inconsistent with the provided strategies.