• support@madhedgefundtrader.com
  • Member Login
Mad Hedge Fund Trader
  • Home
  • About
  • Store
  • Luncheons
  • Testimonials
  • Contact Us
  • Click to open the search input field Click to open the search input field Search
  • Menu Menu
april@madhedgefundtrader.com

July 31, 2024

Tech Letter

Mad Hedge Technology Letter
July 31, 2024
Fiat Lux


Featured Trade:

(CONSOLIDATION TIME)
(MSFT), (PINS), (NVDA)

https://madhedgefundtrader.com/wp-content/uploads/2019/05/cropped-mad-hedge-logo-transparent-192x192_f9578834168ba24df3eb53916a12c882.png 0 0 april@madhedgefundtrader.com https://madhedgefundtrader.com/wp-content/uploads/2019/05/cropped-mad-hedge-logo-transparent-192x192_f9578834168ba24df3eb53916a12c882.png april@madhedgefundtrader.com2024-07-31 14:04:282024-07-31 14:21:45July 31, 2024
april@madhedgefundtrader.com

Consolidation Time

Tech Letter

The Nasdaq experiencing a big dip is in fact healthy for the tech sector long term.

Shaking out the weak hands is necessary a few times per year.

It doesn’t hurt that tech stocks boast the higher growth rates in the entire stock market.

The price action has suggested a winner-take-all mentality with winners like Nvidia and other big tech companies experiencing outsized gains.

Chip stocks have been recent victors while smaller software stocks have been pounded.

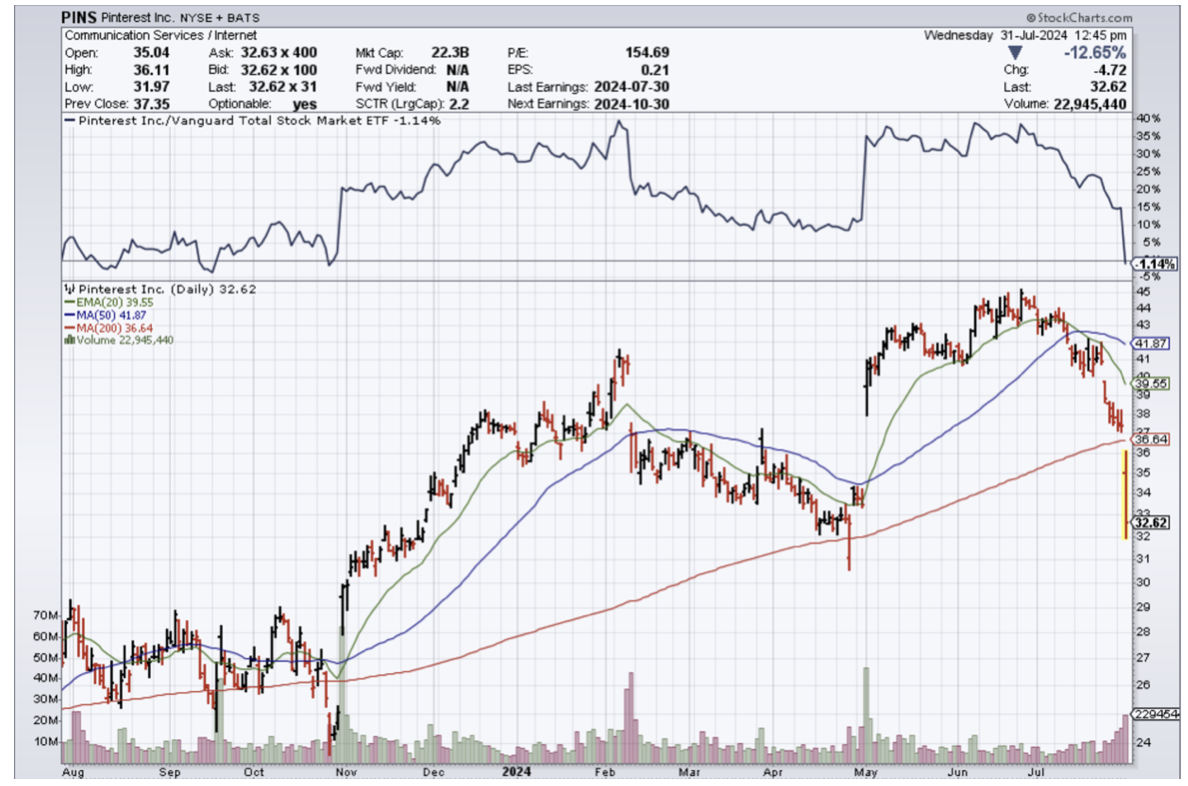
Just take a look at social media stock Pinterest (PINS) which is down over 12% on a weak forecast.

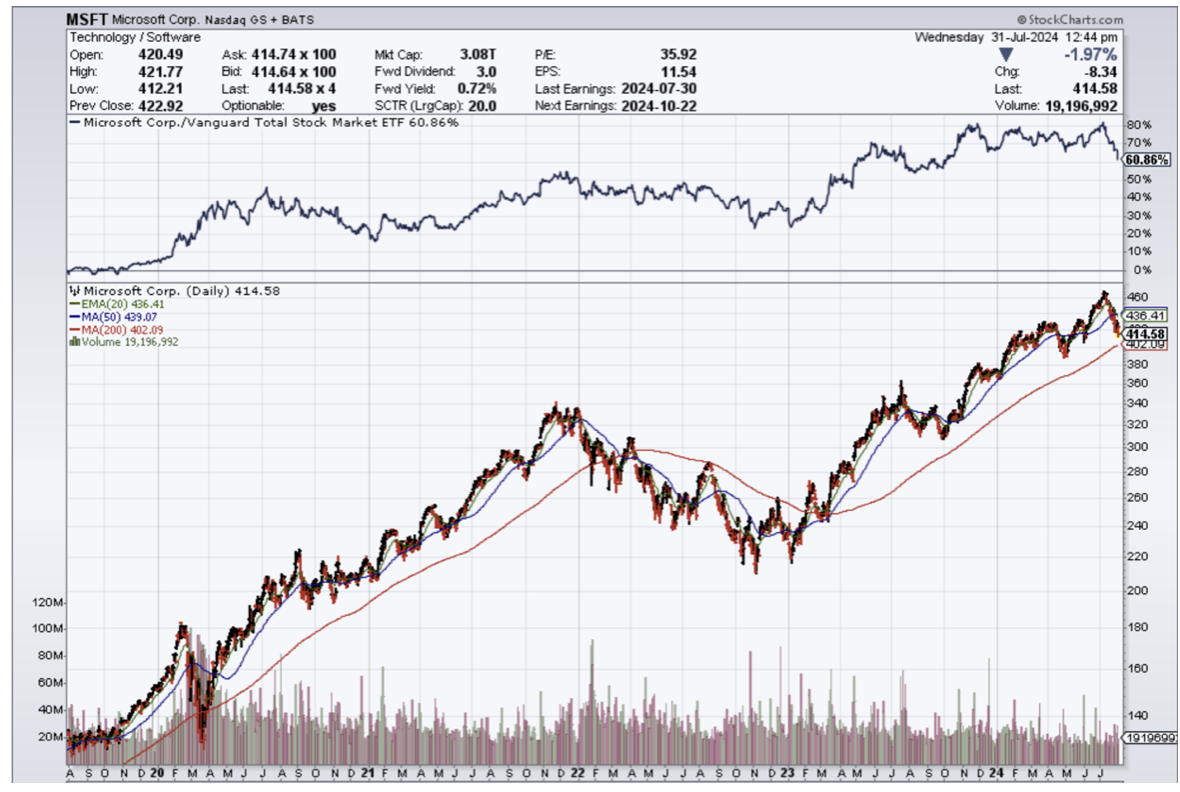
At the top end, Microsoft (MSFT) is the perennial flag bearer of cloud growth but this time it was different.

The stock sold off hard after earnings because the company missed cloud revenue expectations.

Cloud has been MSFTs bread and butter for years.

Even the CEO Satya Nadella came from the cloud division to grab the title of CEO.

Microsoft's overall cloud revenue came in at $36.8 billion, in line with expectations of $36.8 billion, but the company's Intelligent Cloud revenue, which includes its Azure services, fell short, coming in at $28.5 billion versus expectations of $28.7 billion.

While Microsoft's cloud business missed expectations, overall revenue still rose 21% year over year. Intelligent Cloud revenue, meanwhile, increased 19% year over year. What's more, Microsoft said AI services contributed 8 percentage points of growth to its Azure and other cloud services revenue, which increased by 29%.

The most consistent theme in this round of checks was the number of customers and partners that cited share gains by Microsoft resulting from its early lead on the AI front.

During Alphabet’s earnings call, CFO Ruth Porat said the company spent $13 billion on capital expenditures, up from $12 billion in the prior quarter, adding that the vast majority of that spending is going toward AI.

There are data points showing that growing the cloud is becoming something more similar to stealing rival clients from Google or Amazon.

That is a worrying sign because total addressable cloud revenue has been going up for a whole generation.

The cloud industry has never seen a scarcity mentality.

In the earnings rhetoric, the management talked as if growth is harder to come by in 2024.

I would be hard-pressed to find anyone who disagrees with that opinion.

The overall consensus starting to form is that these growing expenses related to AI won’t produce the blockbuster revenue projected so quickly.

The more likely case is that revenue from AI comes online in late 2025 or 2026 or maybe not at all.

The delay in the benefits of AI will mean shareholders pulling back temporarily and offer AI stocks a “prove it” period to show if they are legit or not.

Before winter, I do expect a consolidation phase in tech and in AI stocks that will set the stage for a Santa Claus rally.

MSFT stock is up over 200% in the past 5 years, and although this 11% or so dip in the past month is very unlike MSFT, this is a healthy and orderly dip.

I am still bullish MSFT in the long term.


https://madhedgefundtrader.com/wp-content/uploads/2019/05/cropped-mad-hedge-logo-transparent-192x192_f9578834168ba24df3eb53916a12c882.png 0 0 april@madhedgefundtrader.com https://madhedgefundtrader.com/wp-content/uploads/2019/05/cropped-mad-hedge-logo-transparent-192x192_f9578834168ba24df3eb53916a12c882.png april@madhedgefundtrader.com2024-07-31 14:02:382024-07-31 14:21:34Consolidation Time
april@madhedgefundtrader.com

July 31, 2024

Jacque's Post


(EXAMINING THE TECHNICALS IN NVIDIA (NVDA) AS WE NAVIGATE THE MID-SUMMER STOCK SWOON)

July 31, 2024


Hello everyone,

The long-awaited summer vacation has arrived for the stock market.   Stocks are at the mercy of investors who decided one day that they wanted to own something different rather than just technology stocks.  So, the sell button was decidedly pushed en mass, and funds then poured into a variety of other sectors, most notably small caps, and interest-sensitive sectors, which include home builders, health, and energy stocks. Of course, this movement has a lot to do with rate cuts that are not too far away.

But also, the tech sector is taking a healthy break.  This sector has run very hard at what seemed like 12-cylinder horsepower. Eventually, a rest is needed.  We are witnessing a broadening of the market as we head into the final months before the U.S. election takes place.

One of the stock favorites in the tech sector is Nvidia (NVDA).  It is one stock that has definitely been on a sprint to the stars and is now taking a much-needed rest.   Using Inside Edge Capital charts, let’s take a deeper dive into how that stock looks from a technical perspective, and where we might see significant support levels.

Firstly, let’s look at the 200-day moving average, shown in the dotted blue line in the chart below.   You will notice that it is trending higher, and the stock price is still well above the 200-day MA.    The stock is still in a well-established up trend.  Since it broke above the MA in January 2023 NVDA is still around 540% higher since that move even after the recent sell-off.


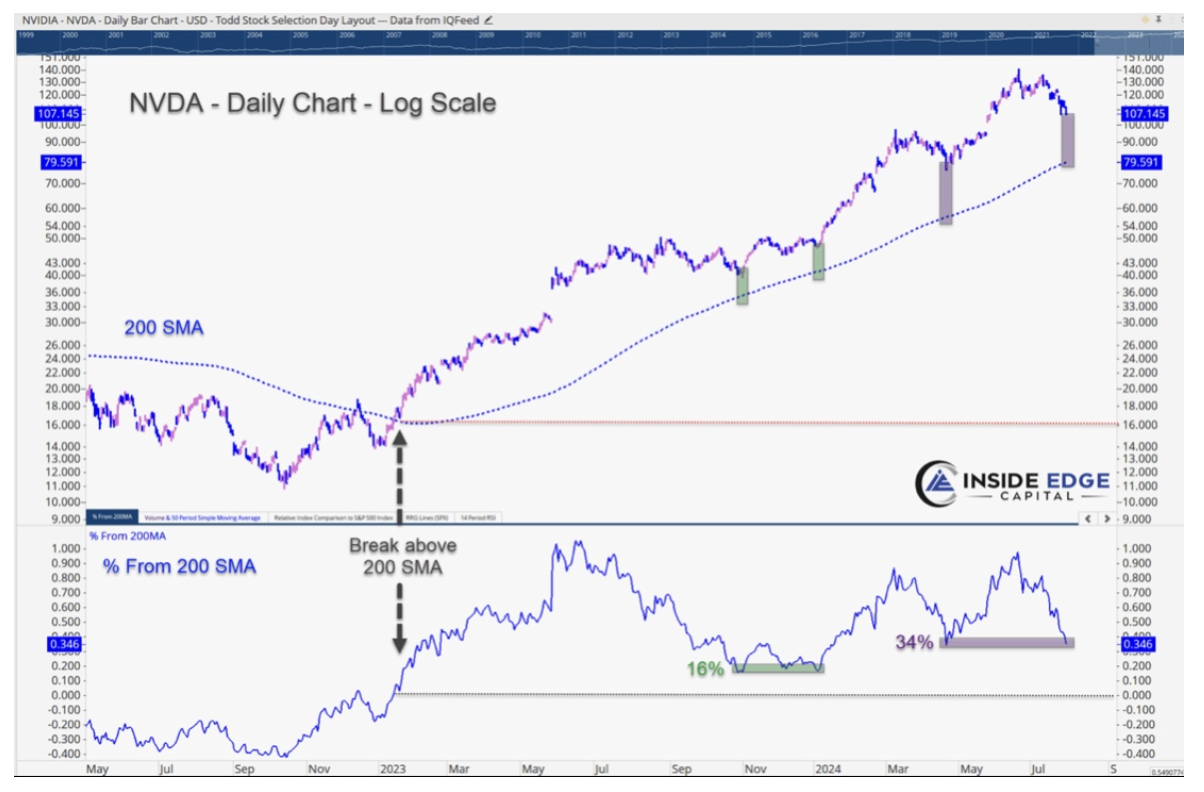
There is a possibility that NVDA falls into a consolidation pattern as we wait for earnings at the end of August, which would allow the moving average to trend higher closing the gap.


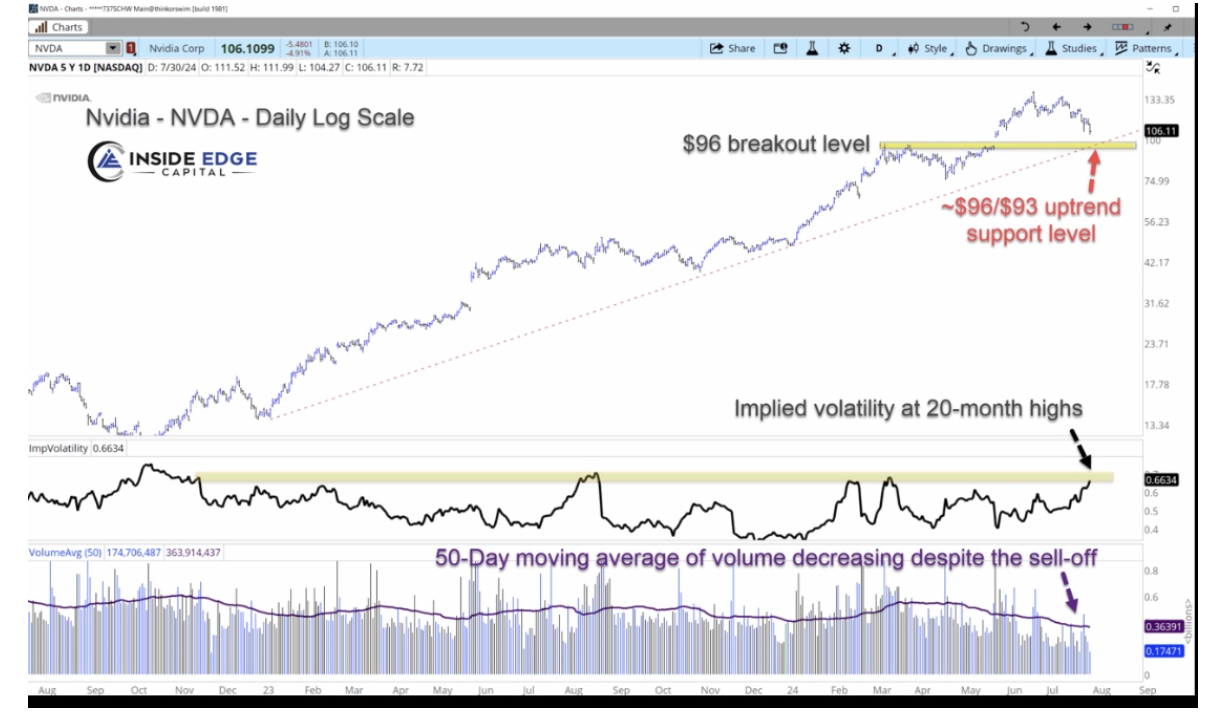
The uptrend support line (red-dashed) should intersect the stock price at around $96-$93 depending on the continued rate of share price decline.  $96 is also this year’s break-out level, and it should now offer support.

Let’s not forget volume.  This identifies the seller’s conviction in this sell-off.  The 50-day MA of the daily volume totals is clearly in a decline since April.  In other words, the urgency of selling is waning.

Based on the fundamental outlook of continued strong earnings growth and the technical outlook, the stock should not get too far below the mid-$90s before the low is found.


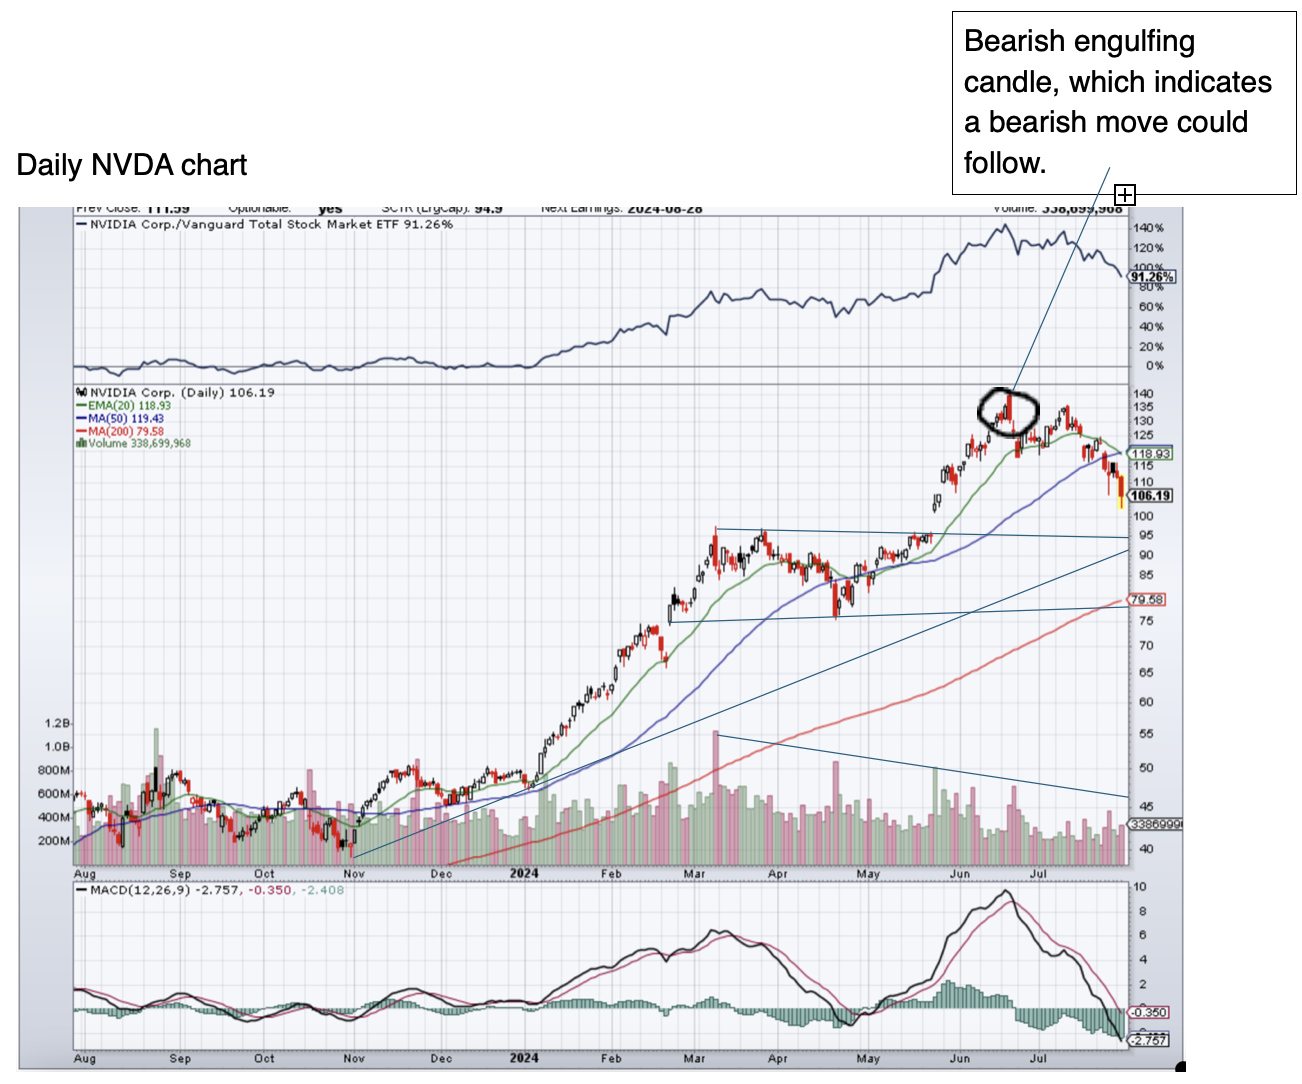
On this chart, I have drawn support and trend lines, showing where the stock price may find lows.  I have also drawn the trend line showing declining volume since March 2024.
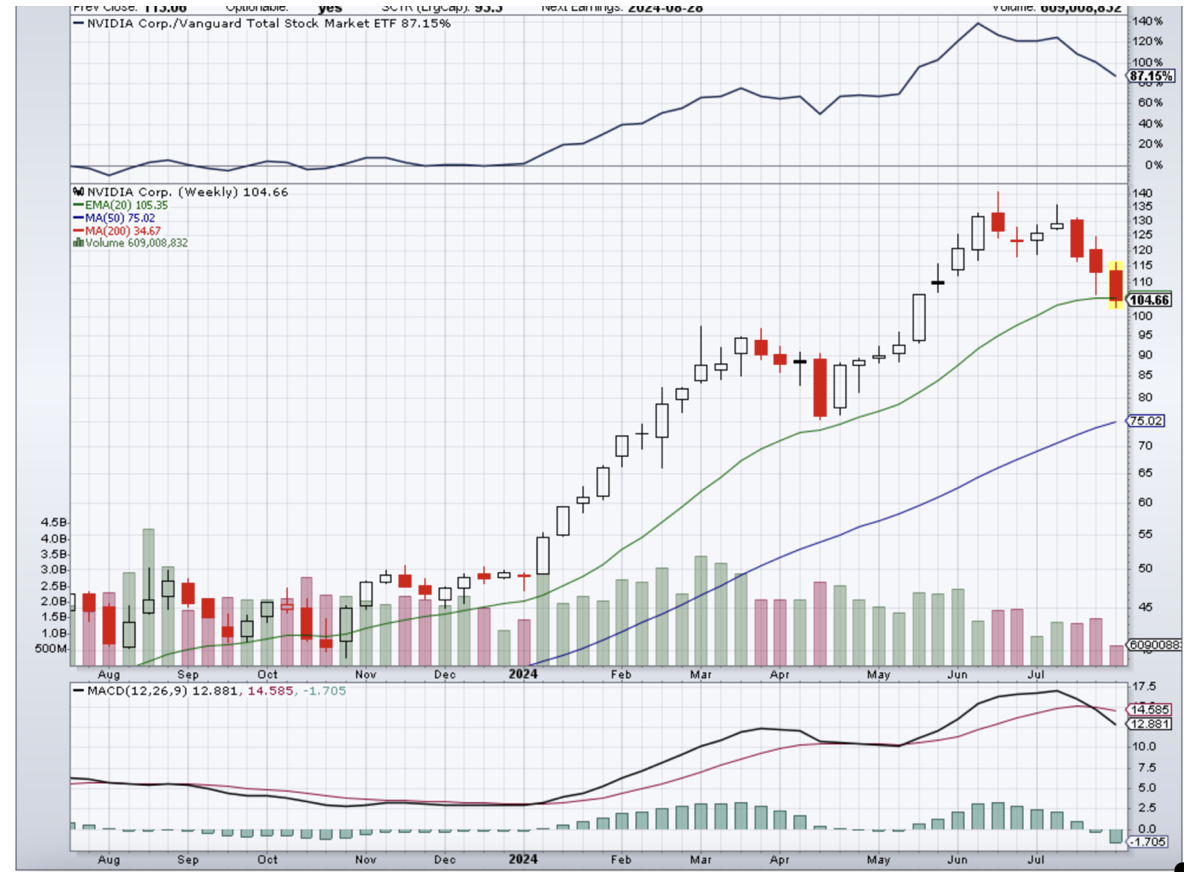
 

Weekly NVDA chart


Cheers,

Jacquie

https://madhedgefundtrader.com/wp-content/uploads/2019/05/cropped-mad-hedge-logo-transparent-192x192_f9578834168ba24df3eb53916a12c882.png 0 0 april@madhedgefundtrader.com https://madhedgefundtrader.com/wp-content/uploads/2019/05/cropped-mad-hedge-logo-transparent-192x192_f9578834168ba24df3eb53916a12c882.png april@madhedgefundtrader.com2024-07-31 12:00:562024-07-31 14:06:13July 31, 2024
april@madhedgefundtrader.com

Trade Alert - (NVDA) July 31, 2024 - TAKE PROFITS - SELL

Trade Alert

When John identifies a strategic exit point, he will send you an alert with specific trade information as to what security to sell, when to sell it, and at what price. Most often, it will be to TAKE PROFITS, but, on rare occasions, it will be to exercise a STOP LOSS at a predetermined price to adhere to strict risk management discipline. Read more

https://www.madhedgefundtrader.com/wp-content/uploads/2016/02/Alert-e1457452190575.jpg 135 150 april@madhedgefundtrader.com https://madhedgefundtrader.com/wp-content/uploads/2019/05/cropped-mad-hedge-logo-transparent-192x192_f9578834168ba24df3eb53916a12c882.png april@madhedgefundtrader.com2024-07-31 09:17:572024-07-31 09:17:57Trade Alert - (NVDA) July 31, 2024 - TAKE PROFITS - SELL
april@madhedgefundtrader.com

July 31, 2024

Diary, Newsletter, Summary

Global Market Comments
July 31, 2024
Fiat Lux


Featured Trade:

(HOW TO READ THE MAD HEDGE DAILY POSITION SHEET)

https://madhedgefundtrader.com/wp-content/uploads/2019/05/cropped-mad-hedge-logo-transparent-192x192_f9578834168ba24df3eb53916a12c882.png 0 0 april@madhedgefundtrader.com https://madhedgefundtrader.com/wp-content/uploads/2019/05/cropped-mad-hedge-logo-transparent-192x192_f9578834168ba24df3eb53916a12c882.png april@madhedgefundtrader.com2024-07-31 09:04:452024-07-31 11:34:07July 31, 2024
april@madhedgefundtrader.com

How to Read the Mad Hedge Daily Position Sheet

Diary, Newsletter

We have recently had a large influx of new subscribers. Perhaps it is because they possess the same vision as I, that we are in an extended bull market driven by hyper-accelerating technology that could continue for another five years, and that we will likely see the S&P 500 above 6,000 by yearend.

Therefore, I am offering a refresher course on how to use the Mad Hedge Daily Position Sheet which is included with your subscription. But first, let me dive back into the deep and dark primordial history of the Mad Hedge Fund Trader to learn its origins.

Because I missed the thrill and adrenalin of the financial markets, I started to launch a new hedge fund back in 2007. I had just spent six years in the oil & gas industry developing the new fracking technology and it was just too slow and sedentary for me. Weeks were spent landing drilling rights in some of the most remote, dry, and desolate parts of the US and some of the people you had to deal with you didn’t necessarily want to introduce to your mother.

So I took the software and spreadsheets developed by the hedge fund I ran and eventually sold during the 1990s, modernized them, added sophisticated new algorithms, and started raising money for a brand new hedge fund from high-net-worth individuals and institutions.

Then the 2008 financial crisis hit. Everyone to a man pulled out of my proposed fund, some losing their entire fortunes in the ensuing crash. One even gave me his place in line to buy the new Tesla Model S, which ended up becoming chassis number 125 off the assembly line in Fremont.

My new hedge fund would have to wait.

Then I wondered whether individual retail investors would have any interest in my services. My goal was to make available sophisticated trading strategies to individuals usually only available to the wealthy with $5 million minimum investments in large hedge funds.

I took the updated software I created for my new hedge fund and offered it as the Mad Hedge Fund Trader in February 2008. It turned out that the public interest was overwhelming, and the rest is history.

The Diary of a Mad Hedge Fund Trader proved so exhilarating that I never did get around to launching that new hedge fund. It turns out there is far more satisfaction in turning $50,000 into $500,000 than converting a millionaire into a billionaire.

I promise to tell the rest of the story in a future letter.

In order to access the Mad Hedge Daily Position Sheet, do the following:

1) log into your account at www.madhedgefundtrader.com by clicking on “Member Login” in the upper right corner.

2) Type in your email address and password in the white boxes in the lower left corner.

3) A page with “Welcome Back” appears. Hover your cursor over the blue “My Account” text in the upper right section. A drop-down menu appears listing all of the Mad Hedge Services you have purchased.

4) Click on GLOBAL TRADING DISPATCH.

5) Eight Blue and Red boxes will appear. Click on the Current Positions blue box.

6) In the lower-left corner you will find a piece of blue hypertext called “Download in Excel (XLSX) Updated for (today’s date). Click on this.

7) The new spreadsheet will appear in your “Downloads” folder. And here you have it to play with as you want.

Well, that was easy! You can now analyze your own positions, run your own market scenarios, adopt different assumptions, and so on. It’s yours to keep until tomorrow or the next trading day when you get a new one.

Now that you’re in, there’s a lot here to digest. You are now officially a pro! At least a semi-pro.

First of all, make sure you have the correct Date in cell C2. We usually post an updated spreadsheet 30 minutes after the New York Stock Exchange closes at 4:00 PM EST (or 6:00 AM Sydney time the next day), but sometimes there are delays caused by chasing down errors.

If you are like me, the next cell you will want to jump to is the Month-to-Date Performance in cell F15. This determines whether you’ll be taking your wife or girlfriend out to an expensive dinner that night or spending the night tossing and turning in bed. Usually, it’s the former but occasionally it’s the latter.

It's an easy leap there to Year-to-Date Performance in Cell F19 and Performance since the December 8 2010 Inception in Cell F9.

Next, you will want to check my Asset Class Breakdown that starts in cell A11 to make sure you haven’t missed anything. Life happens, the Internet goes down, or emails can end up in SPAM folders, so it’s best to crosscheck my trading book with yours. These are divided into Risk On and Risk Off positions. Risk On means that my global team’s exhaustive research has informed me that the underlying stock will rise. Risk Off means it will fall.

In an ideal world, Risk On and Risk Off balance each out generating a net risk of zero percent. This doesn’t actually happen very often (only in neutral market conditions which are rare).

In reality, I am very heavy Risk On positions at market bottoms and very heavy Risk Off positions at market tops. And when the risk/reward is overwhelmingly terrible, I will have no positions at all, as was the case at the end of June 2024. That is what you want. Always let the other guy unnecessarily stick their neck out.

Cell B35 will show the Total Net Position of all your longs and shorts. Cell B38 shows you the Total Aggregate Position or the number of positions you have added up. That way you know exactly how much free cash you have to spend on new positions.

To the right of the Asset Class Breakdown, you will see a multicolored pie chart showing the weightings of each individual position.

Next, we go to the Current Positions in cell C43. Here is where you find the details of each individual position. Since I believe that the low-hanging fruit in the financial market is still in options spreads, where the risk-reward is overwhelmingly in your favor, these positions are presented in long and short pairs.

Column A – Date Opened
Column B – Date Closed
Column C – ticker symbol, maturity month, and option strike price
Column D – Asset Class
Column E – long or short
Column F – Underlying stop loss price
(where you bail on a losing position)
Column G – Notional Cost
Column H – Current Market Price
Column I – Profit & Loss for the individual position
Column J - Profit & Loss for the spread pair of positions

Column K – Risk Weighting Metrics
Column L – Leverage

Column M – Portfolio Net Exposure
Column N – I keep open for future custom Algorithmic Analysis
Column O - I keep open for future custom Algorithmic Analysis

Column P – Number of options contracts per position. Negative numbers are short positions

In Cell C83, you will find a listing of all trades executed in 2023 along with their individual profit & loss. From Cell C156, you find a listing of all trades executed in 2024. We actually have records going back to 2010, but nobody cares about that except the SEC.

Well, that’s about it. 

Welcome to the Mad Hedge Fund Trader community and I look forward to working with all of you. If you have any questions, please direct them to support@madhedgefundtrader.com

John Thomas
CEO & Publisher
The Diary of a Mad Hedge Fund Trader


https://www.madhedgefundtrader.com/wp-content/uploads/2024/07/John-thomas-in-Alaska.png 854 1138 april@madhedgefundtrader.com https://madhedgefundtrader.com/wp-content/uploads/2019/05/cropped-mad-hedge-logo-transparent-192x192_f9578834168ba24df3eb53916a12c882.png april@madhedgefundtrader.com2024-07-31 09:02:412024-07-31 11:33:35How to Read the Mad Hedge Daily Position Sheet
april@madhedgefundtrader.com

July 30, 2024

Biotech Letter

Mad Hedge Biotech and Healthcare Letter
July 30, 2024
Fiat Lux


Featured Trade:

(RETAIL THERAPY, MEET RETAIL RX)

(HUM), (WMT), (WBA), (UNH), (CVS), (TDOC)

https://madhedgefundtrader.com/wp-content/uploads/2019/05/cropped-mad-hedge-logo-transparent-192x192_f9578834168ba24df3eb53916a12c882.png 0 0 april@madhedgefundtrader.com https://madhedgefundtrader.com/wp-content/uploads/2019/05/cropped-mad-hedge-logo-transparent-192x192_f9578834168ba24df3eb53916a12c882.png april@madhedgefundtrader.com2024-07-30 12:02:132024-07-30 12:09:54July 30, 2024
april@madhedgefundtrader.com

Retail Therapy, Meet Retail RX

Biotech Letter

In my years of covering the markets, from the trading floors of Tokyo to the halls of power in Washington, I've seen my fair share of unexpected partnerships.

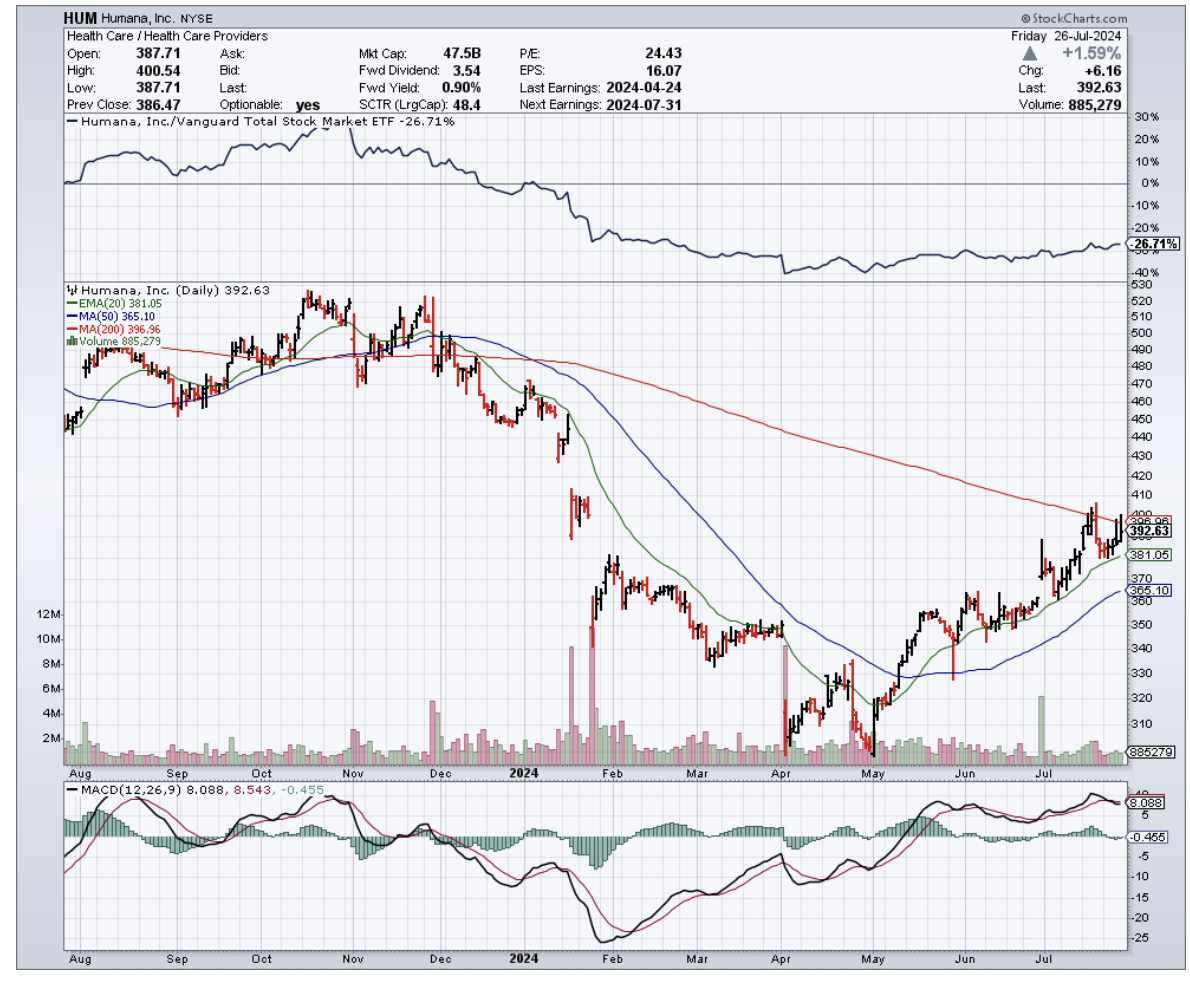
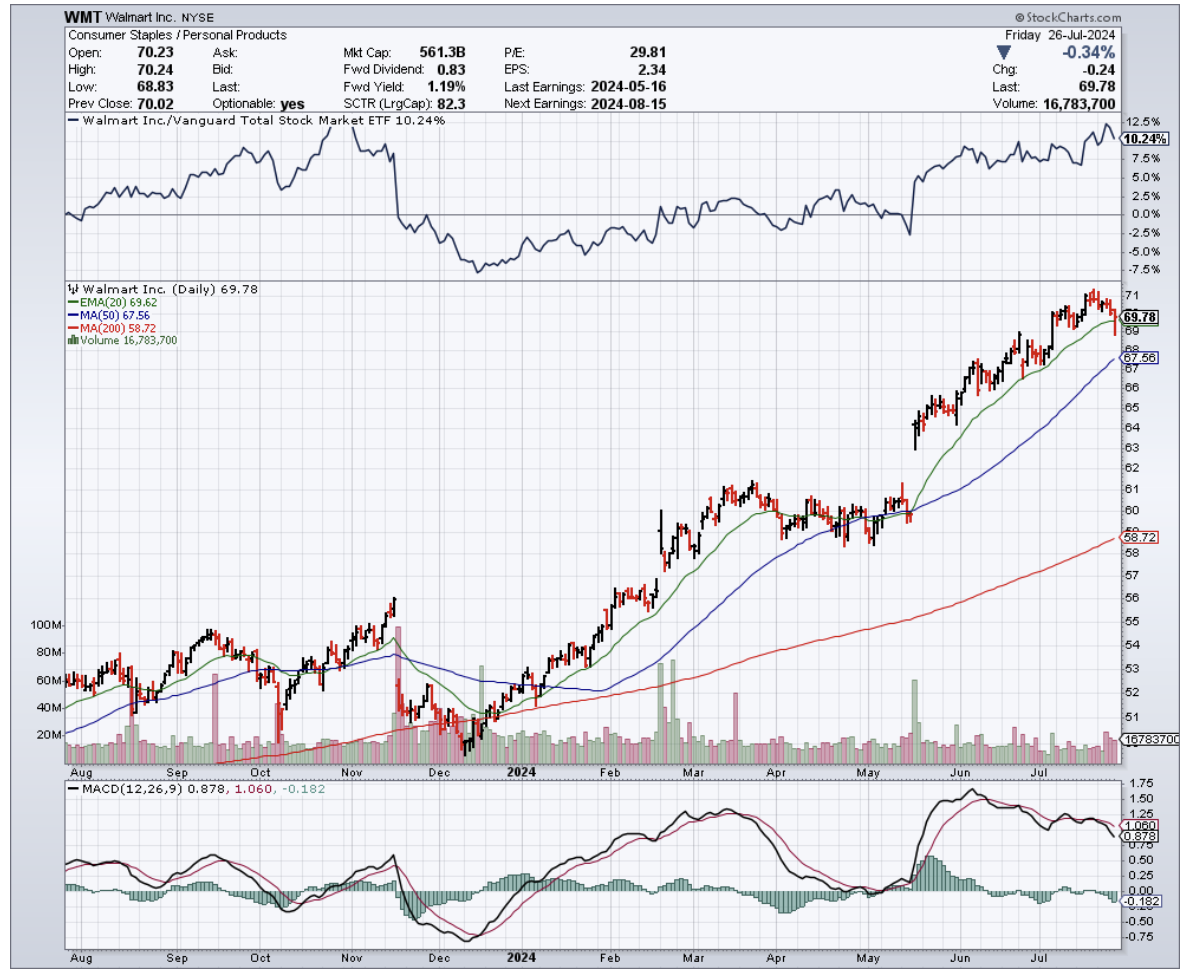
But the recent tie-up between Walmart (WMT) and Humana (HUM) has me sitting up and paying attention.

That’s right. Walmart, the king of rollbacks and home of the $1 hot dog, has found a new tenant for the vacant spaces that used to house its healthcare business: Humana's CenterWell health clinics.

Humana, as you know, is one of the biggest players in the Medicare Advantage game, and is setting up shop in 23 Walmart Supercenters across Florida, Georgia, Missouri, and Texas.

And they're not just dipping their toes in the water – they're diving in headfirst, with plans to have these clinics up and running by the first half of 2025.

Now, I know what you're thinking. "John, why should I care about some dusty old retail giant like Walmart getting into bed with a health insurance company?"

Let me tell you why.

Humana's Q1 2024 earnings were nothing to sneeze at, with revenues growing 11% year-over-year to a whopping $29.6 billion.

And while the company did revise its full-year EPS guidance downward, it maintained its outlook for adjusted EPS and even revised its membership growth in MA plans upward.

This is a big deal, folks. Medicare Advantage plans have been the bread and butter of Humana's business model, underpinning the company's phenomenal share price gains from $25 per share in 2010 to over $550 in late 2022.

With the population aging faster than fine wine, the demand for senior-focused healthcare services will only grow.

But Humana isn't the only one benefiting from this partnership.

For Walmart, renting out these spaces to CenterWell allows them to recoup some of the infrastructure investments they made in building out their 51 Walmart Health clinics, which they recently shut down due to profitability challenges.

It's like finding a roommate to help pay the rent after your startup goes belly up.

But the healthcare industry is like a giant game of Jenga, with players constantly pulling out blocks and hoping the whole thing doesn't come crashing down.

Just look at Walgreens Boots Alliance (WBA), another retail giant that recently announced the closure of 150 of its in-store clinics due to profitability challenges. It's a stark reminder of how difficult it can be to make a buck in this business.

That's why Walmart's pivot to a partnership model with Humana is so intriguing.

By leasing out pre-equipped facilities to CenterWell, Walmart is essentially letting Humana handle the nitty-gritty of patient care while still maintaining a presence in the rapidly growing primary care industry.

It's like having your cake and eating it too, without having to worry about the pesky details of actually baking the cake.

As expected, Walmart and Humana aren't the only ones making moves in the healthcare space.

CVS Health (CVS) and UnitedHealth Group (UNH) are also betting big on primary care, with CVS acquiring Oak Street Health for $10.6 billion and UnitedHealth's Optum division going on an acquisition spree to expand its network of physicians and healthcare providers.

Then, there’s the meteoric rise of telehealth during the pandemic. Companies like Teladoc Health (TDOC) saw their revenues skyrocket as patients turned to virtual care in droves.

While growth has slowed down since the height of the pandemic, telehealth is still a force to be reckoned with and could potentially disrupt traditional brick-and-mortar clinics.

So, what does all this mean for us?

Well, if you're an investor looking to get in on the action, you've got plenty of options. From established players like Humana and UnitedHealth to up-and-comers like Oak Street Health and Teladoc, there's no shortage of companies vying for a piece of the healthcare pie.

With an aging population, rising healthcare costs, and a growing focus on preventative care and chronic disease management, the demand for innovative healthcare solutions is only going to increase in the coming years.

And who knows, maybe one day we'll all be getting our annual check-ups at the local Walmart, with a side of low-priced toilet paper and a jumbo bag of Cheetos.

Stranger things have happened in the wild world of healthcare.


https://madhedgefundtrader.com/wp-content/uploads/2019/05/cropped-mad-hedge-logo-transparent-192x192_f9578834168ba24df3eb53916a12c882.png 0 0 april@madhedgefundtrader.com https://madhedgefundtrader.com/wp-content/uploads/2019/05/cropped-mad-hedge-logo-transparent-192x192_f9578834168ba24df3eb53916a12c882.png april@madhedgefundtrader.com2024-07-30 12:00:142024-07-30 12:09:22Retail Therapy, Meet Retail RX
april@madhedgefundtrader.com

Trade Alert - (SLV) July 30, 2024 - STOP LOSS - SELL

Trade Alert

When John identifies a strategic exit point, he will send you an alert with specific trade information as to what security to sell, when to sell it, and at what price. Most often, it will be to TAKE PROFITS, but, on rare occasions, it will be to exercise a STOP LOSS at a predetermined price to adhere to strict risk management discipline. Read more

https://www.madhedgefundtrader.com/wp-content/uploads/2016/02/Alert-e1457452190575.jpg 135 150 april@madhedgefundtrader.com https://madhedgefundtrader.com/wp-content/uploads/2019/05/cropped-mad-hedge-logo-transparent-192x192_f9578834168ba24df3eb53916a12c882.png april@madhedgefundtrader.com2024-07-30 10:36:152024-07-30 10:43:08Trade Alert - (SLV) July 30, 2024 - STOP LOSS - SELL
april@madhedgefundtrader.com

Trade Alert - (AMZN) July 30, 2024 - BUY

Trade Alert

When John identifies a strategic exit point, he will send you an alert with specific trade information as to what security to sell, when to sell it, and at what price. Most often, it will be to TAKE PROFITS, but, on rare occasions, it will be to exercise a STOP LOSS at a predetermined price to adhere to strict risk management discipline. Read more

https://www.madhedgefundtrader.com/wp-content/uploads/2016/02/Alert-e1457452190575.jpg 135 150 april@madhedgefundtrader.com https://madhedgefundtrader.com/wp-content/uploads/2019/05/cropped-mad-hedge-logo-transparent-192x192_f9578834168ba24df3eb53916a12c882.png april@madhedgefundtrader.com2024-07-30 09:58:162024-07-30 09:58:16Trade Alert - (AMZN) July 30, 2024 - BUY
Page 1 of 15123›»

tastytrade, Inc. (“tastytrade”) has entered into a Marketing Agreement with Mad Hedge Fund Trader (“Marketing Agent”) whereby tastytrade pays compensation to Marketing Agent to recommend tastytrade’s brokerage services. The existence of this Marketing Agreement should not be deemed as an endorsement or recommendation of Marketing Agent by tastytrade and/or any of its affiliated companies. Neither tastytrade nor any of its affiliated companies is responsible for the privacy practices of Marketing Agent or this website. tastytrade does not warrant the accuracy or content of the products or services offered by Marketing Agent or this website. Marketing Agent is independent and is not an affiliate of tastytrade. 

Legal Disclaimer

There is a very high degree of risk involved in trading. Past results are not indicative of future returns. MadHedgeFundTrader.com and all individuals affiliated with this site assume no responsibilities for your trading and investment results. The indicators, strategies, columns, articles and all other features are for educational purposes only and should not be construed as investment advice. Information for futures trading observations are obtained from sources believed to be reliable, but we do not warrant its completeness or accuracy, or warrant any results from the use of the information. Your use of the trading observations is entirely at your own risk and it is your sole responsibility to evaluate the accuracy, completeness and usefulness of the information. You must assess the risk of any trade with your broker and make your own independent decisions regarding any securities mentioned herein. Affiliates of MadHedgeFundTrader.com may have a position or effect transactions in the securities described herein (or options thereon) and/or otherwise employ trading strategies that may be consistent or inconsistent with the provided strategies.

Copyright © 2025. Mad Hedge Fund Trader. All Rights Reserved. support@madhedgefundtrader.com
  • Privacy Policy
  • Disclaimer
  • FAQ
Scroll to top