Global Market Comments
December 30, 2024
Fiat Lux
Featured Trade:
(MY OLD PAL, LEONARDO FIBONACCI),
(TESTIMONIAL)

Global Market Comments
December 30, 2024
Fiat Lux
Featured Trade:
(MY OLD PAL, LEONARDO FIBONACCI),
(TESTIMONIAL)
(BLOK), (MSTR), (LEGR), (JD), (BIDU), (BABA), (AMD)
There's an old Wall Street saying that the market has a way of turning exuberance into experience. After decades of trading, I've watched this play out more times than I can count, and these days that wisdom is ringing in my ears like a persistent trading reminder.
Just last week, I watched the S&P 500 touch $5,994.89 (up another 0.3%) while the Nasdaq Composite flirted with $20,000, sitting pretty at $19,886.60 (up 0.6%). Feels a bit like déjà vu, doesn't it?
Let's rewind the tape to November 30, 2022. While most folks were arguing about whether to serve turkey or ham for the holidays, OpenAI quietly dropped ChatGPT into our laps. Talk about a stealth bomber.
Since then, the S&P 500 has rocketed up 49%, while the tech-heavy Nasdaq has left Earth's orbit entirely with a 75% gain. And that's not a typo, folks - I triple-checked those numbers.
Full disclosure: I've been around this rodeo circuit long enough to see a few "next big things" come and go. Remember blockchain? (If you're wincing right now, you probably bought some crypto at the top). Let me share a little story about that particular circus.
Take the Amplify Transformational Data Sharing ETF (BLOK) - a name that probably took longer to create than some blockchain projects lasted.
This fund has actually kept pace with the Nasdaq and outperformed the S&P 500 since 2018. Impressive, right? Well, hold onto your hardware wallets, because here's where it gets interesting.
Peek under the hood, and you'll find MicroStrategy (MSTR), a company that's up nearly 3,000% since January 2018. But here's the kicker - they didn't get there by revolutionizing blockchain.
They basically turned themselves into a publicly traded Bitcoin piggy bank. It's like entering a marathon and winning by taking an Uber to the finish line. Technically effective, but not exactly what the prospectus advertised.
And don't get me started on the First Trust Indxx Innovative Transaction & Process ETF (LEGR). Despite having tech heavyweights like JD.com (JD), Baidu (BIDU), and Alibaba (BABA) in its portfolio, most of these stocks have been underwater since 2018.
The fund's saving grace? AMD's (AMD) 1,200% moonshot, powered by - plot twist - artificial intelligence, not blockchain.
So what does this tell us about AI stocks heading into 2025? Well, the Nasdaq's got an interesting story to tell.
Since 1971 (yes, I've been watching it that long), it's only had back-to-back losing years twice. The last time was over two decades ago. It's like that friend who keeps failing upward - somehow, it just works.
But here's my two cents after decades in the trenches: investing in megatrends is like trying to pick the next Beatles at a high school talent show. Sure, somebody in that auditorium might be the next Paul McCartney, but good luck figuring out who.
Want my advice? If you're itching to play the AI game, stick to the established players or passive index funds. You know, the ones that actually have revenue and aren't just PowerPoint presentations with "AI" slapped on them.
It's like I always tell newer traders - sometimes the safest way to join a gold rush isn't by prospecting, but by selling picks and shovels to the miners.
After all, history and my battle-scarred portfolio suggest that while markets should keep climbing in 2025, not every AI company is going to be sending champagne to their shareholders.
Sometimes the smartest play isn't trying to outsmart the market - it's just making sure you've got a seat at the table when the feast begins.
And speaking of feasts, did I mention I owned MicroStrategy back when they were actually a software company? But that's a story for another day...

Mad Hedge Technology Letter
December 27, 2024
Fiat Lux
Featured Trade:
(THE TRUTH ABOUT AUTOMATION AND BANKING)
(SQ), (PYPL), (APPL), (AMZN)

Automation is taking place at warp speed, displacing employees from all walks of life.
According to a recent report, the U.S. financial industry will depose of 400,000 workers in the next decade because of automating efficiencies.
Yes, humans are going the way of the dodo bird, and banking will effectively become algorithms working for a handful of executives and engineers.
The x-factor in this equation is the $150 billion annually that banks spend on technological development in-house, which is higher than any other industry.
Welcome to the world of lower costs, shedding wage bills, and boosting performance rates.
We forget to realize that employee compensation eats up 50% of bank expenses.
The 400,000 job trimmings would result in 20% of the U.S. banking sector getting axed.
The hyped-up “golden age of banking” should deliver extraordinary savings and premium services to the customer at no extra cost.
This iteration of mobile and online banking has delivered functionality that no generation of customers has ever seen.
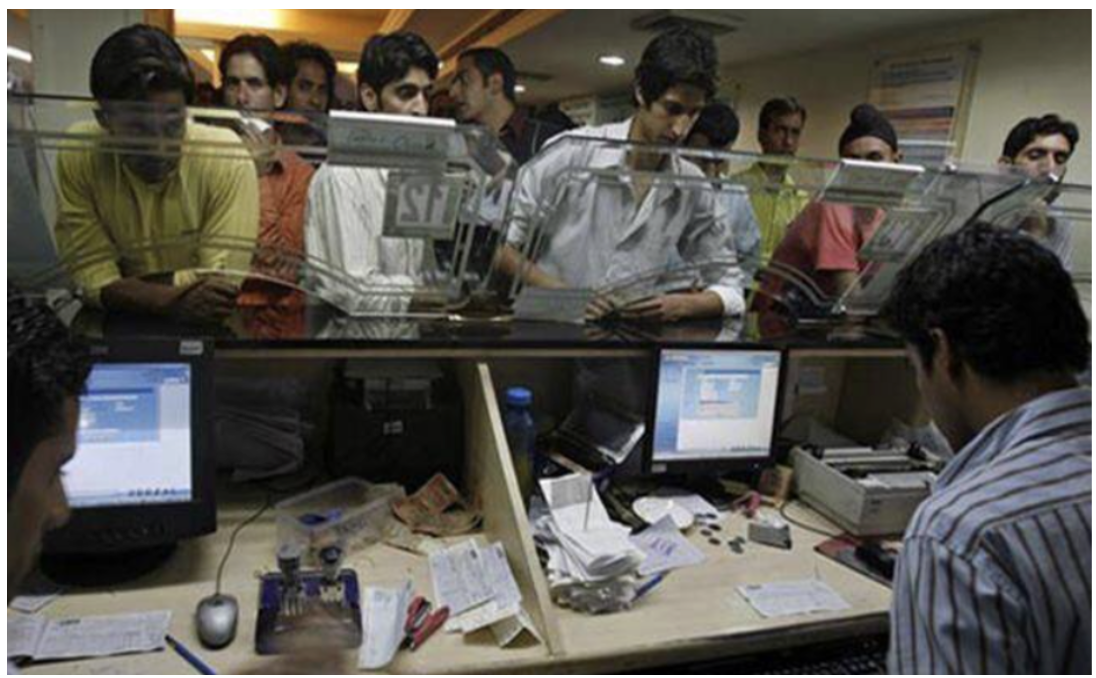
The most gutted part of banking jobs will naturally occur in the call centers because they are the low-hanging fruit for automated chatbots.
A few years ago, chatbots were suboptimal, even spewing out arbitrary profanity, but they have slowly crawled up in performance metrics to the point where some customers are unaware that they are communicating with an artificial engineered algorithm.
The wholesale integration of automating the back-office staff isn’t the end of it, the front office will experience a 30% drop in numbers, sullying the predated ideology that front-office staff are irreplaceable heavy hitters.
Front-office staff has already felt the brunt of downsizing, with purges carried out from 2022 representing a twelfth year of continuous decline.
Front-office traders and brokers are being replaced by software engineers as banks follow the wider trend of every company transitioning into a tech company.
The infusion of artificial intelligence will lower mortgage processing costs by 30%, and the accumulation of hordes of data will advance the marketing effort into a smart, multi-pronged, hybrid cloud-based, and hyper-targeted strategy.
The last two human bank hiring waves are a distant memory.
The most recent spike came in the 7 years after the dot com crash of 2001 until the sub-prime crisis of 2008, adding around half a million jobs on top of the 1.5 million that existed then.
After the subsidies wear off from the pandemic, I do believe that the banking sector will quietly put in the call to trim even more.
The longest and most dramatic rise in human bankers was from 1935 to 1985, a 50-year boom that delivered over 1.2 million bankers to the U.S. workforce.
This type of human hiring will likely never be seen again in the U.S. financial industry.
Recomposing banks through automation is crucial to surviving as fintech companies like PayPal (PYPL) and Square (SQ) are chomping at the bit, and even tech companies like Amazon (AMZN) and Apple (AAPL) have started tinkering with new financial products.
And if you thought that this phenomenon was limited to the U.S., think again, Europe is by far the biggest culprit by already laying off 102,000 employees in 2021, more than 10x higher the number of U.S. financial job losses, and that has continued in 2022, 2023 and 2024.
In a sign of the times, the European outlook has turned demonstrably negative, with Deutsche Bank announcing layoffs of 40,000 employees as it scales down its investment banking business.
Don’t tell your kid to get into banking because they will most likely be feeding on scraps at that point.
THE LAST STAGE OF HUMAN-FACING BANK SERVICES IS NOW!

(THE LONG-TERM INFLATION TARGET MAY BE 2%, BUT THE REALITY WILL LIKELY BE QUITE DIFFERENT)
December 27, 2024
Hello everyone
The era of stable inflation is over.
Yes, the Fed might get inflation down to close to 2%, but I believe they will struggle to keep it there.
Let’s check out the reasons why here.
First, demographics.
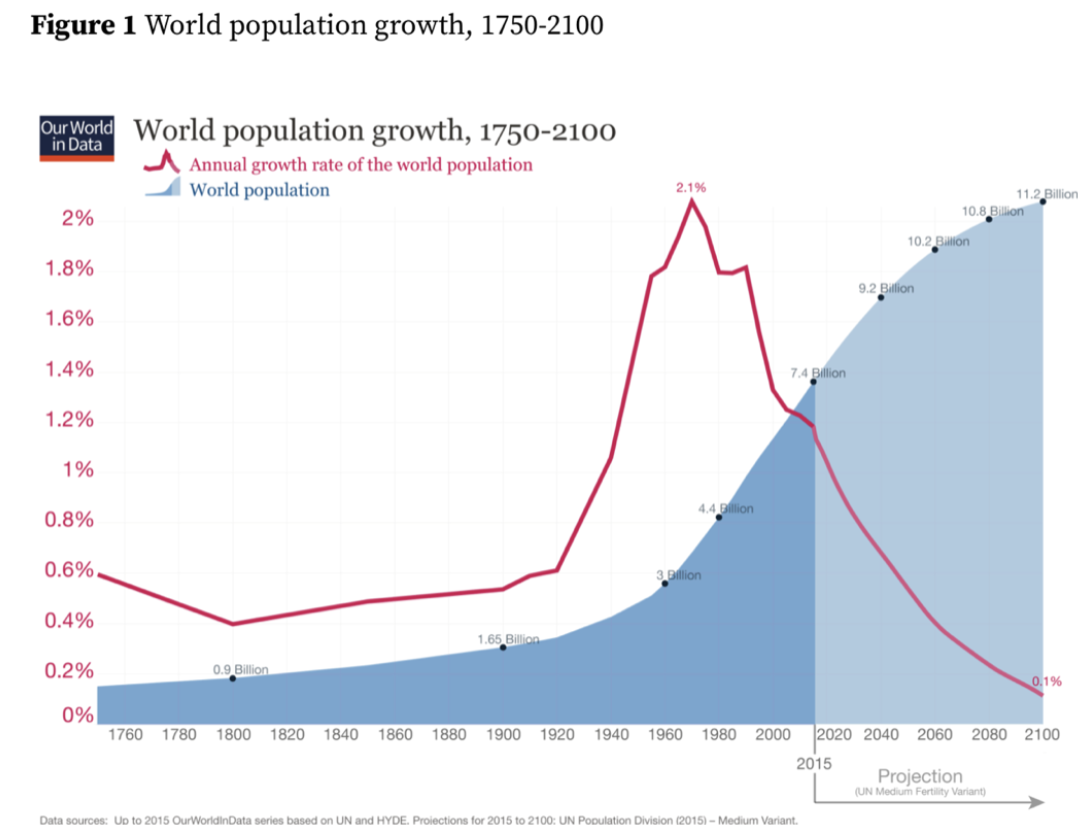
The U.S. and other Western industrial countries – even China – are facing declining populations that will result in a persistent shortage of labour. Tight labour markets in turn will keep upward pressure on wages as businesses compete for workers.
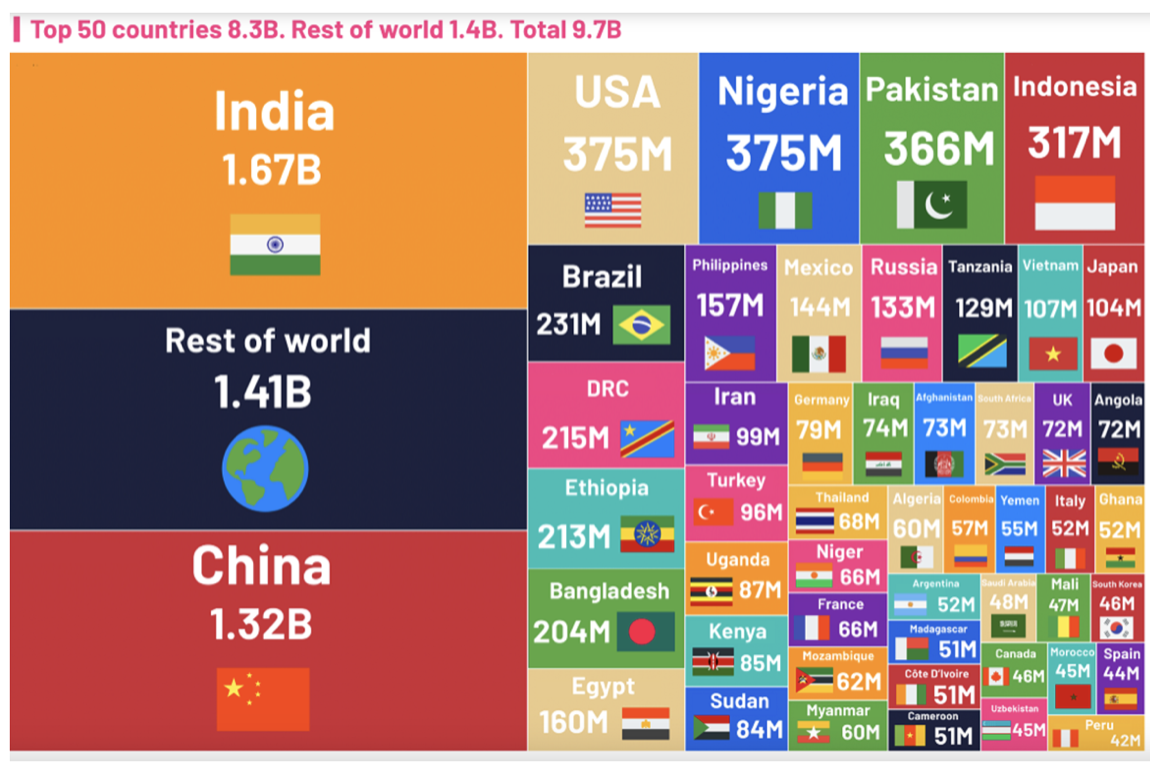
AND THESE ARE THE TOP 50 COUNTRIES WITH THE LARGEST POPULATION IN 2050.
And then there is the era of global free trade, which is taking a backseat to security concerns in the wake of the Russian war on Ukraine and Western tensions with China after the pandemic. Any tensions between the U.S. and China tend to be costly.
The growing government deficit – does anyone really think about this and its consequences? – is also fuel for inflation. The U.S. has been running trillion-dollar deficits since the pandemic and the national debt is expected to continue to grow by leaps and bounds.
The importance of greening the economy is a concept we all appear to accept. But this is another potential inflation accelerator. And what about the implications here? The U.S. would need to spend trillions of dollars to modernize its electric grid and feed the insatiable appetite of emerging technologies such as artificial intelligence. Lots of older, valuable assets such as coal-or gas-fired could also get stranded.
2% inflation has gone by the wayside for the long term? We’re probably looking at a 3% inflation world.
The only way to get to 2% long term would be to drive up unemployment and collapse the economy. Hands up who thinks the Fed is going to do that?
Cheers
Jacquie
Global Market Comments
December 27, 2024
Fiat Lux
Featured Trade:
(HOW MY MAD HEDGE AI MARKET TIMING ALGORITHM WORKS)

Mad Hedge Biotech and Healthcare Letter
December 26, 2024
Fiat Lux
Featured Trade:
(PHASE 2 OR NOT PHASE 2: THAT'S NOT EVEN A QUESTION IN 2025)
(LLY), (NVO)

I had dinner with a veteran biotech investor at San Francisco's Waterbar earlier this month, watching the Bay Bridge lights while discussing what's coming for biotech in 2025.
"The game is changing," he said, picking at his salmon. "It's not about platform promises anymore. Show me the Phase 2 data, or don't show up at all."
He's nailed what I've been seeing in my recent travels through the biotech corridors of Boston, San Diego, and Basel. The days of throwing money at shiny new platforms are ending.
That means that by 2025, we'll see venture capital concentrate in fewer but larger deals, especially in companies with solid Phase 2 data.
Let me break down what this means for our portfolio next year. First, North America will dominate in advanced biologics and AI-driven drug discovery. I've toured enough labs recently to see that our capabilities in these areas are leaving others in the dust.
Europe's doubling down on sustainable manufacturing and rare diseases - smart move given their regulatory environment. Asia? They're positioning to own generics and biologics manufacturing, with India making particularly interesting moves in antibody-drug conjugates.
The money's following these regional specialties. If you're investing in biotech companies that don't align with their region's strengths, you might find yourself waiting longer for returns than a Red Sox fan waiting for another World Series.
My contacts in several major VC firms confirm they're already adjusting their 2025 strategies around these regional strengths.
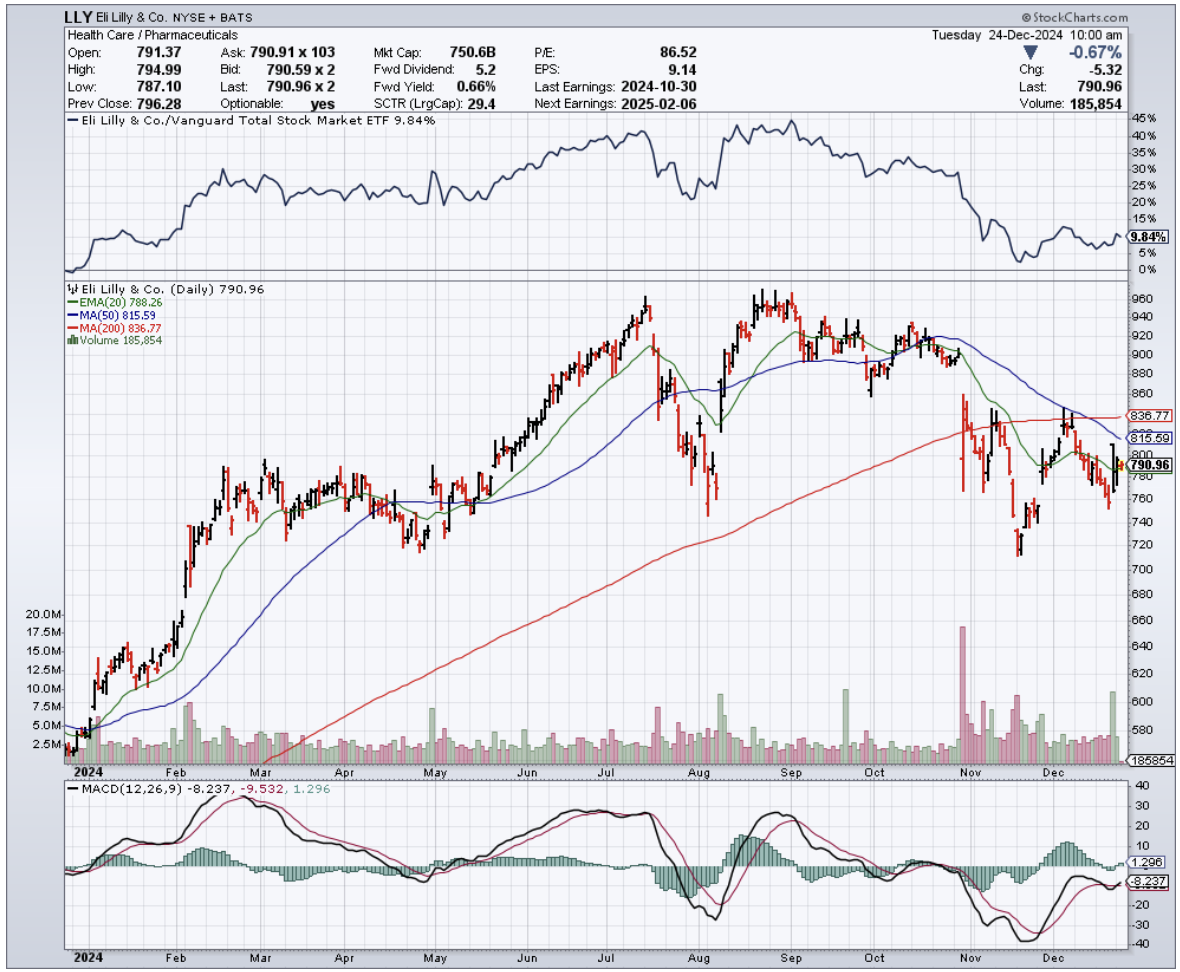
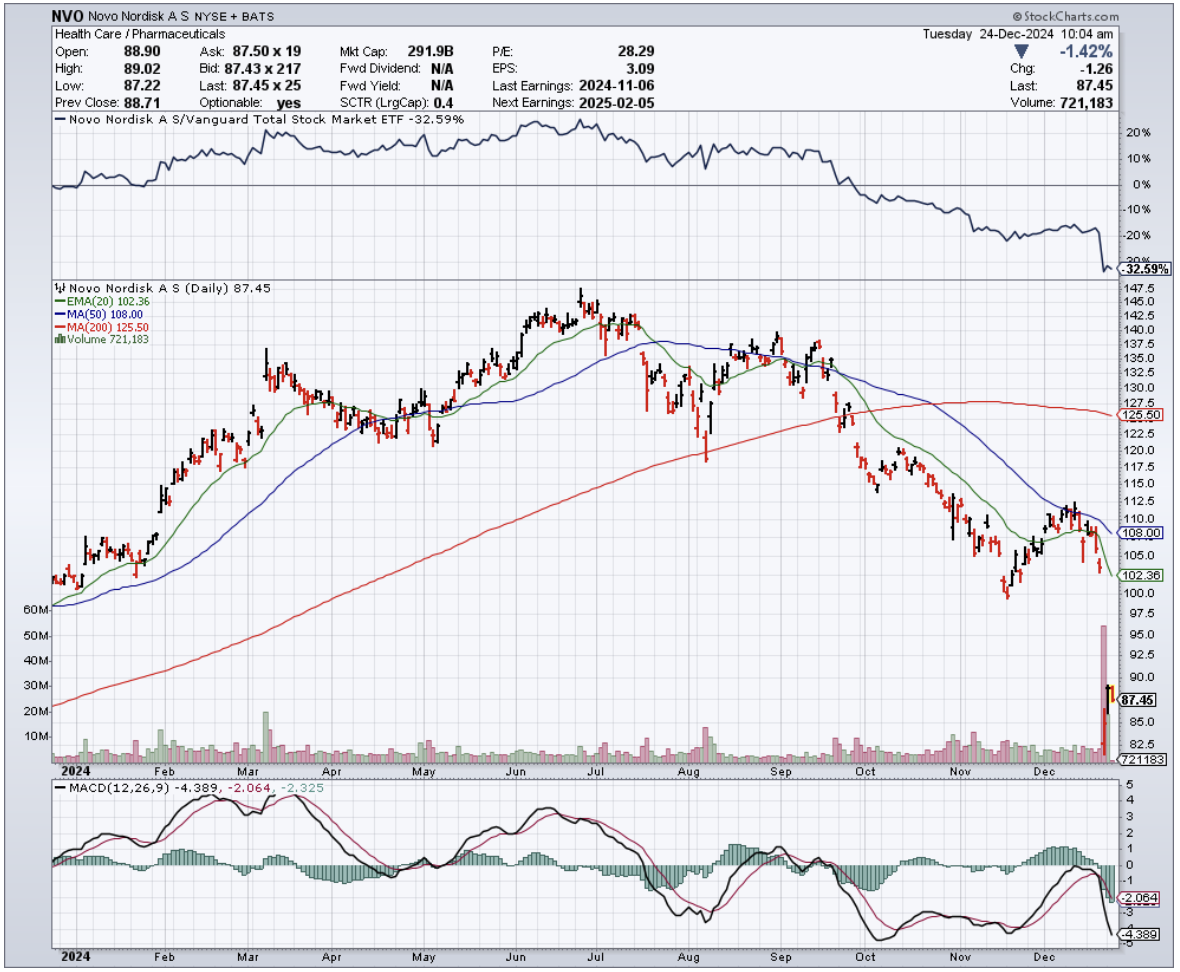
Here's what's really interesting: obesity and GLP-1 drugs are the exception to every rule. After watching Eli Lilly (LLY) and Novo Nordisk's (NVO) recent success, everyone wants a piece of this action.
Even early-stage obesity plays are attracting serious capital, bucking the trend toward late-stage investments.
But remember this about 2025 - being picky about Phase 2 data isn't just smart, it's survival. We're heading into a market where strong clinical validation will matter more than ever.
I've seen enough biotech cycles to know that when the market gets selective, you want to be where the data is solid.
The numbers back this up. Looking at the trends, Phase 2 companies have consistently captured the highest deal sizes, except for that brief period in 2023 when obesity deals sent Phase 1 valuations through the roof.
By 2025, expect this preference for Phase 2 assets to become even more pronounced. Phase 3 investments have been declining - dropping from $4.2 billion in 2021 to $1.7 billion in 2024 - partly because companies with strong Phase 2 data are getting snatched up through partnerships or acquisitions before they even get to Phase 3.
Speaking of partnerships, watch Big Pharma's moves carefully in 2025. They're increasingly hungry for de-risked assets, and strong Phase 2 data is their favorite meal.
I had lunch with a Big Pharma exec last week who told me they've completely restructured their BD team to focus on Phase 2 assets in their regional sweet spots.
As for AI platforms? They'll still get funded - companies like Xaira and Generate:Biomedicines are proving that. But by 2025, they'll need to show more than just fancy algorithms. The market's going to demand real clinical validation.
I recently visited an AI-driven drug discovery company where the CEO proudly showed me their latest neural network. "That's great," I told him, "but show me your clinical data." The silence was deafening.
So, what’s the play here? Well, I'm keeping my own biotech portfolio focused on companies with strong Phase 2 assets heading into 2025, especially in regional sweet spots.
And yes, I've got a position in the obesity space - sometimes a trend is too strong to ignore, even for an old contrarian like me.
One final thought: keep an eye on those time gaps between funding rounds. They're getting longer, and by 2025, companies that don't fit neatly into regional specialties or lack solid clinical data might find themselves in the financial equivalent of a Phase 2 trial that never ends.
Now, if you'll excuse me, I've got a call with a German biotech CEO about their sustainable manufacturing process. These regional specialties aren't going to research themselves.
Global Market Comments
December 26, 2024
Fiat Lux
SPECIAL ISSUE ABOUT THE FAR FUTURE
Featured Trade:
(PEAKING INTO THE FUTURE WITH RAY KURZWEIL),
(GOOG), (INTC), (AAPL), (TXN)

Mad Hedge Biotech and Healthcare Letter
December 24, 2024
Fiat Lux
Featured Trade:
(THE LAB RESULTS ARE IN)
(GILD), (TSLA), (WVE), (EDIT), (CRSP), (LLY), (NVO), (WMT), (CVS), (CCCC), (RHHBY)