I like to start out my day by calling readers on the US East Coast and Europe, asking how they like the service, are there any ways I can improve the service, and what topics they would like me to write about.
After all, at 5:00 AM Pacific time, they are the only ones around.
You’d be amazed at how many great ideas I pick up this way, especially when I speak to industry specialists or other hedge fund managers.
Even the 25-year-old day trader operating out of his mother’s garage has been known to educate me about something.
So when I talked with a gentleman from Tennessee this morning, I heard a common complaint. Naturally, I was reminded of my former girlfriend, Cybil, who owns a mansion on top of the levee in nearby Memphis overlooking the great Mississippi River.
As much as he loved the service, he didn’t have the time or the inclination to execute my market-beating Trade Alerts.
I said, “Don’t worry. There is an easier way to do this.”
Only about a quarter of my followers actually execute my Trade Alerts. The rest rely on my research to correctly guide them in the management of the IRAs, 401(k) s, pension funds, or other retirement assets.
There is also another, easier way to use the Trade Alert service. Think of it as “Trade Alert light.” Do the following.
1) Only focus on the four best of the S&P 500’s 101 sectors. I have listed the ticker symbols below.
2) Wait for the chart technicals to line up. Bullish long-term “Golden crosses” are setting up for several sectors.
3) Use a macroeconomic tailwind, like the ramp up from a -31% GDP growth rate to +31% we are currently seeing.
4) Shoot for a microeconomic sweet spot, companies, and sectors that enjoy special attention.
5) Increase risk when the calendar is in your favor, such as from November to May.
6) Use a modest amount of leverage in the lowest risk bets, but not much. 2:1 will do.
7) Scale in, buying a few shares every day on down days. Don’t hold out for an absolute bottom. You will never get it.
The goal of this exercise is to focus your exposure on a small part of the market with the greatest probability of earning a profit at the best time of the year. This is what grown-up hedge funds do all day long.
Sounds like a plan. Now, what do we buy?
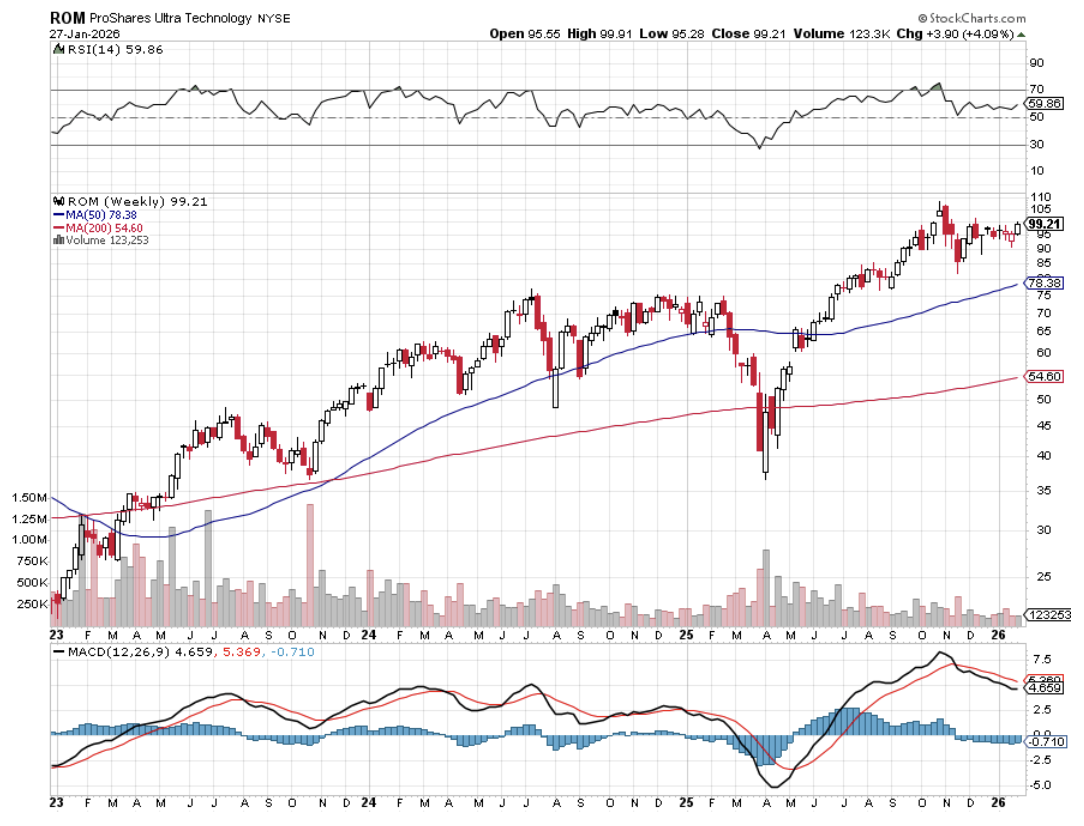
(ROM) – ProShares Ultra Technology 2X Fund – Gives you a double exposure to what will be the top-performing sector of the market for the next six months, and probably the rest of your life. Click here for details and the largest holdings.
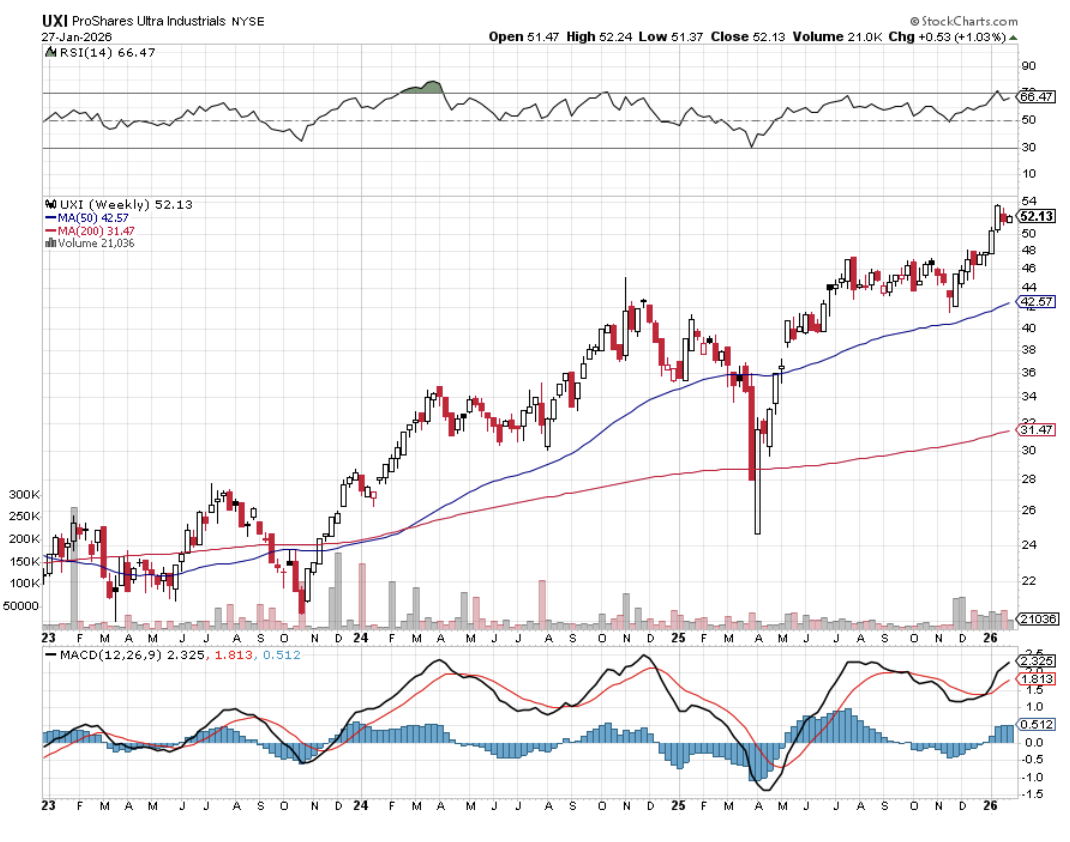
(UXI) – ProShares Ultra Industrial Fund 2X – Is finally rebounding off the back of a dollar that will slow down its ascent once the first interest rate hike is behind us. Onshoring and incredibly cheap valuations are other big tailwinds here. For details and largest holdings, click here.
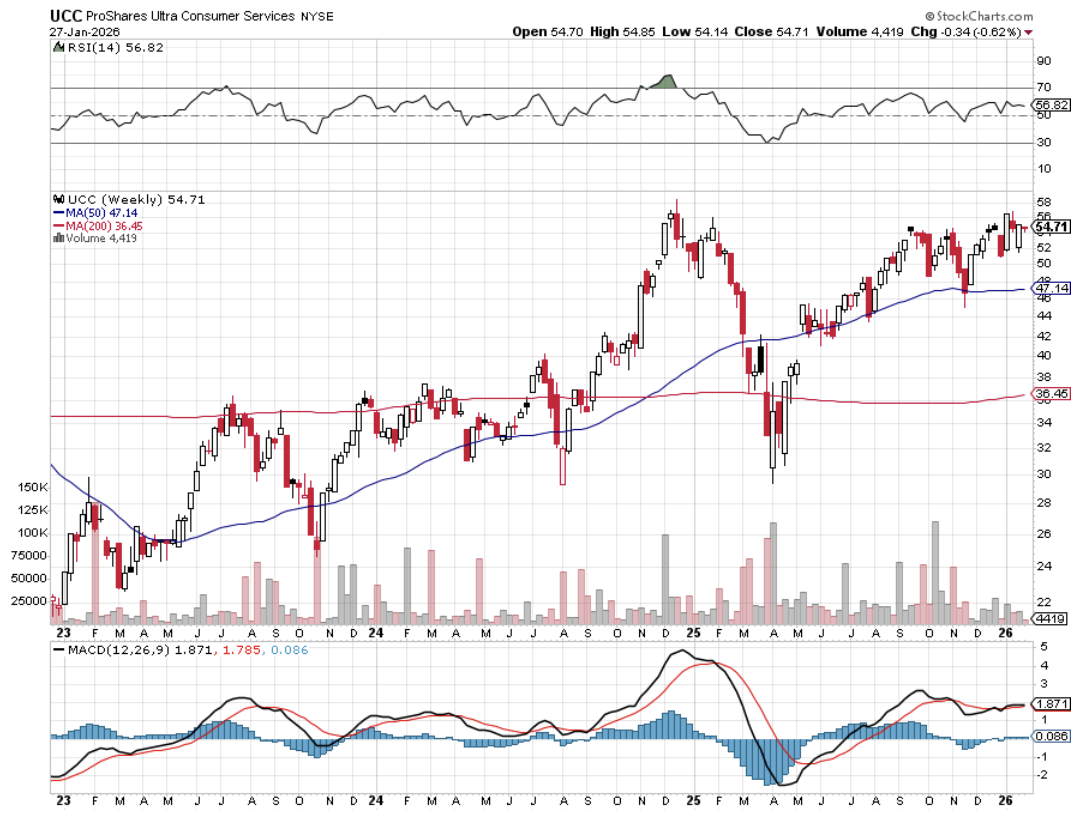
(UCC) – ProShares Ultra Consumer Services 2X Fund – Is a sweet spot for the economy, as tight-fisted consumers finally start to spend their gasoline savings now that it no longer appears to be a temporary windfall. This is also a great play on a housing market that is on fire. It contains favorites like Home Depot (HD) and Walt Disney (DIS), which we know and love. For details and largest holdings, click here.
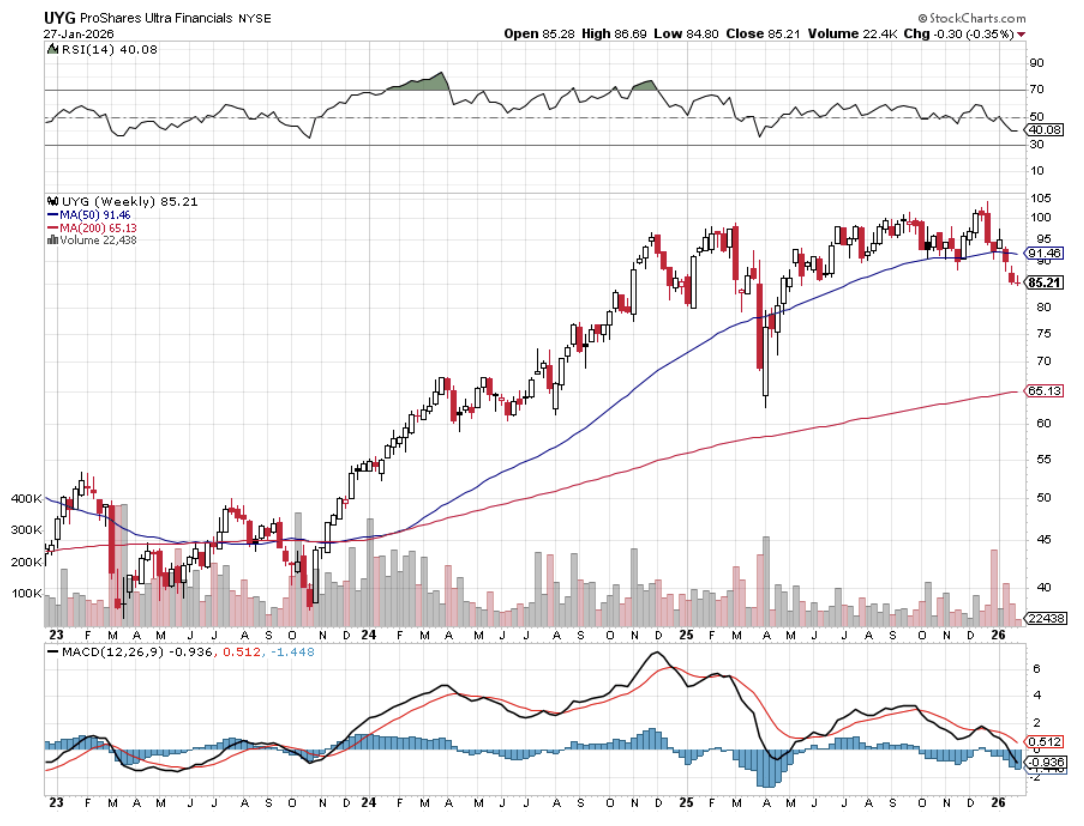
(UYG) – ProShares Ultra Financials 2X Fund – Yes, after six years of false starts, interest rates are finally going up, with a December rate hike by the Fed a certainty. My friend, Janet, is handing out her Christmas presents early this year. This instantly feeds into wider profit margins for financials of every stripe. For details and largest holdings, click here.
Of course, you’ll need to keep reading my letter to confirm that the financial markets are proceeding according to the script. You will also have to read the Trade Alerts, as we include a ton of deep research in the Updates.
You can then unload your quasi-trading book with hefty profits in the spring, just when markets are peaking out. “Sell in May and Go Away?” I bet it works better than ever in 2021.
For Those Who Invest at Their Leisure
https://www.madhedgefundtrader.com/wp-content/uploads/2018/07/John-Thomas-nov19.png350410MHFTRhttps://madhedgefundtrader.com/wp-content/uploads/2019/05/cropped-mad-hedge-logo-transparent-192x192_f9578834168ba24df3eb53916a12c882.pngMHFTR2026-01-28 09:02:192026-01-28 10:47:47Trading for the Non-Trader
Lately, I have spent my free time trolling the worst slums of Oakland, CA.
No, I’m not trying to score a drug deal, hook up with some ladies of ill repute, or get myself killed.
I was looking for the best-performing investment for the next 30 years.
Yup, I was looking for new homes to buy.
As most of you know, I try to call all of my readers at least once a year and address their individual concerns.
Not only do I pick up some great information about regions, industries, businesses, and companies, but I also learn how to rapidly evolve the Diary of a Mad Hedge Fund Trader service to best suit my voracious, profit-seeking readers.
So when a gentleman asked me the other day to reveal to him the top-performing asset of the next 30 years, I didn’t hesitate: your home equity.
He was shocked.
I then went into the economics of the Oakland trade with him.
West Oakland was built as a working-class neighborhood in the late 1890s because it was a short hop on the ferry to San Francisco. Many structures still possess their original Victorian gingerbread designs and fittings.
Today, it is a 5-minute BART ride under the Bay to the San Francisco financial district.
A one three-bedroom, two-bath home I saw was purchased a year ago for $450,000, with a $50,000 down payment, and a 6.5% loan on the balance.
The investor quickly poured $50,000 into the property, with new paint, heating, hot water, windows, a kitchen, bathrooms, and flooring.
A year later, he listed it for sale at $650,000, and the agent said there was a bidding war on that would probably take the final price up to $700,000.
Excuse me, gentlemen, but that is a 400% return on a 50,000 investment in 12 months.
As Oakland rapidly gentrifies, the next buyer will probably see a doubling in the value of this home in the next five years.
Try doing that in the stock market.
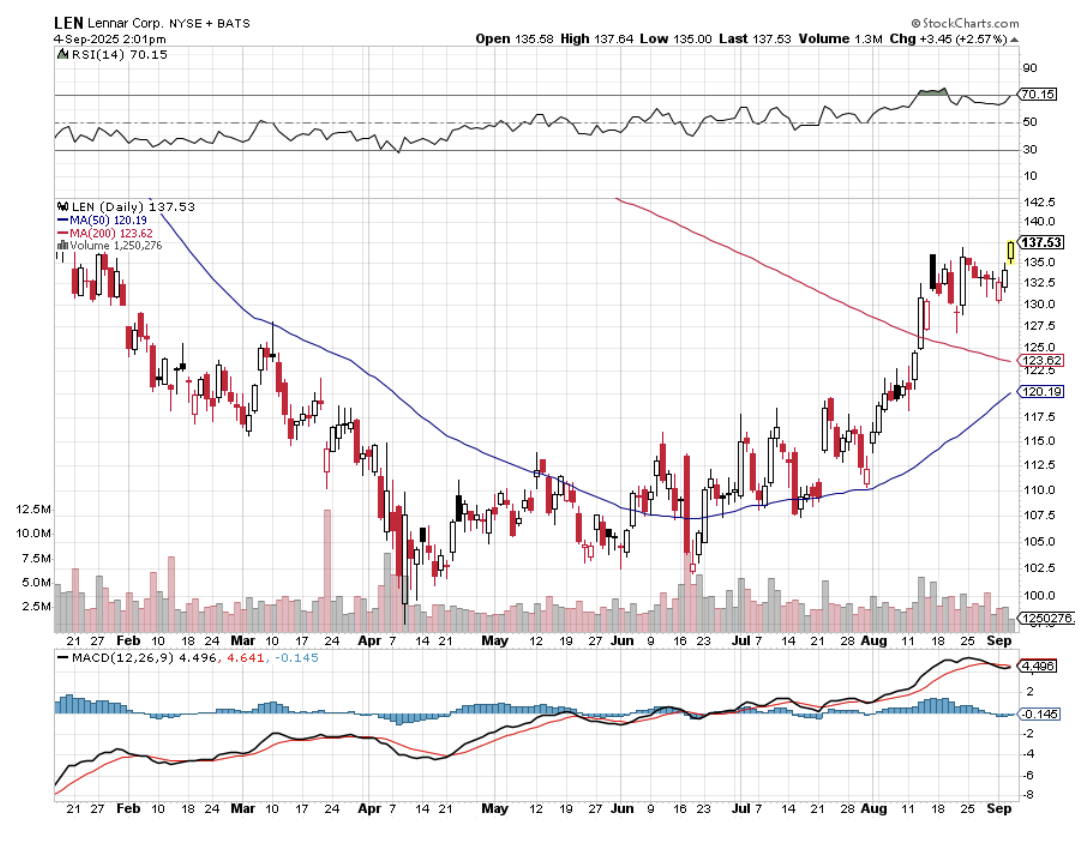
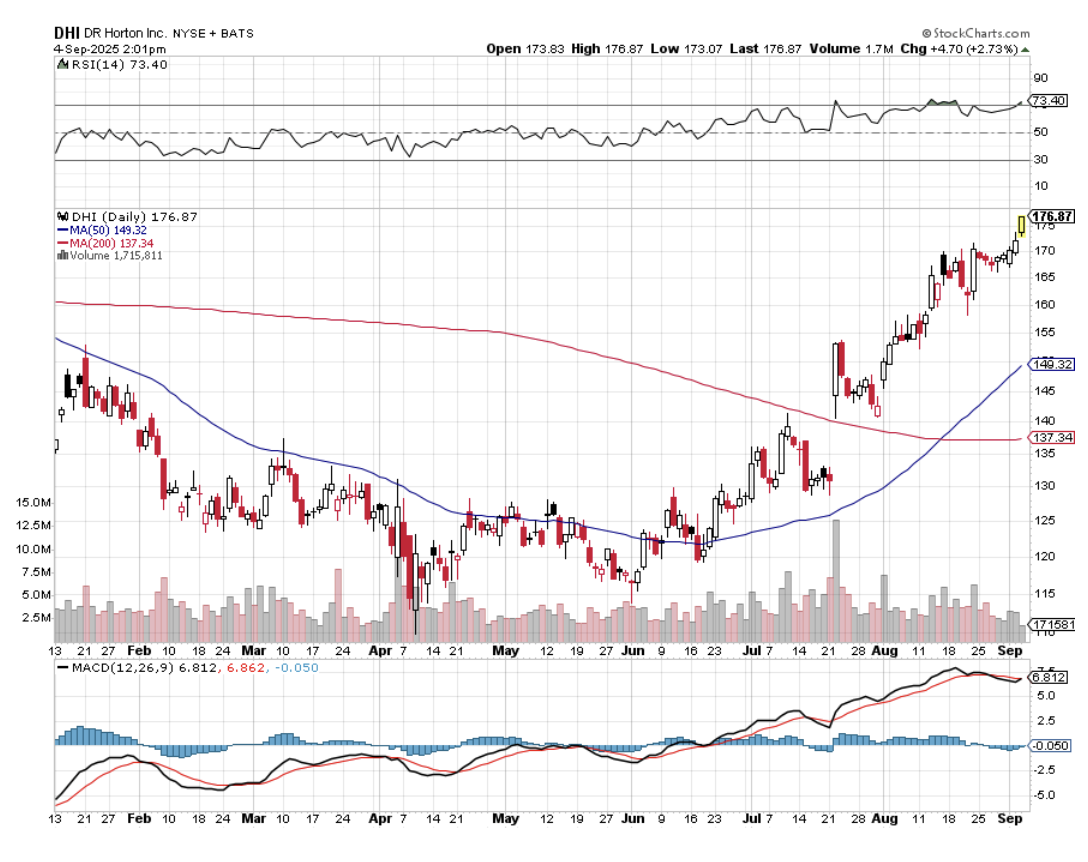
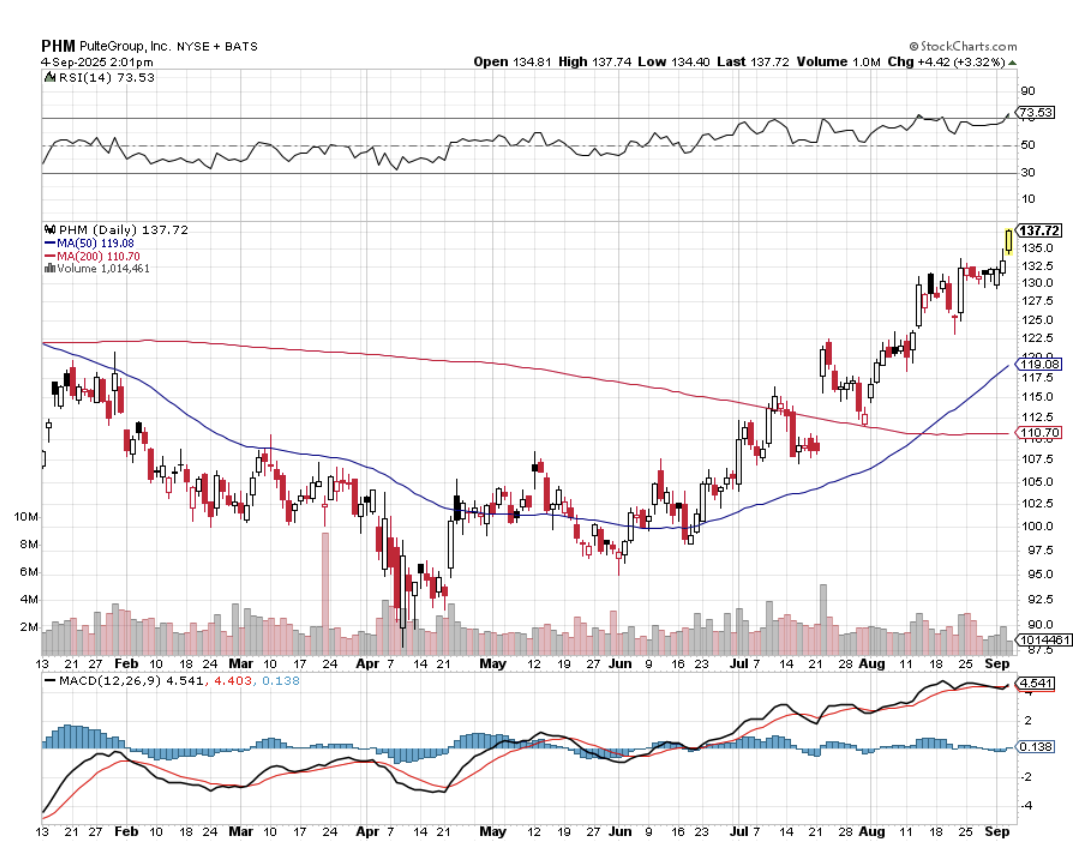
Needless to say, housing stocks like Lennar Homes (LEN), D.R. Horton (DHI), and Pulte Homes (PHM) need to be at the core of any long-term stock portfolio.
I then proceeded to list off to my amazed subscriber the many reasons why residential housing is just entering a Golden Age that will drive prices up tenfold, if not 100-fold, in the decades to come. After all, over the last 60 years, the value of my parents’ home in LA went up 100-fold and the equity 1,000-fold.
1) Demographics. The last decade started out as the hard decade for housing, when 80 million downsizing baby boomers unloaded their homes for greener pastures at retirement condos and assisted living facilities.
The 65 million Gen Xers who followed were not only far fewer in number, but earned much less, thanks to globalization and hyper-accelerating technology.
All of this conspired to bring us a real estate crash that bottomed out in 2011.
During the 2020s, the demographics math reverses.
That’s when 85 million millennials start chasing the homes owned by 65 million Gen Xers.
And as they age, this group will be earning a lot more disposable income, thanks to a labor shortage.
2) Population Growth
If you think it's crowded now, you haven’t seen anything yet.
Over the next 30 years, the US population is expected to soar from 335 million today to 450 million. California alone will rocket from 38 million to 50 million.
That means housing for 115 million new Americans will have to come from somewhere. It sets up a classic supply/demand squeeze.
That’s why megaprojects like the San Francisco to Los Angeles bullet train, which may seem wasteful and insane today, might be totally viable by the time they are finished.
3) They’re Not Building Them Anymore
Or at least not as much as they used to.
Total housing starts for 2024 were 1.55 million, a 3% decline from the 1.60 million total from 2023. Single-family starts in 2023 totaled 1.01 million, down 10.6% from the previous year. That means they are producing half of peak levels.
The home building industry has to more than triple production just to meet current demand.
Builders blame import taxes (tariffs) for materials like lumber (Canada) and drywall (Mexico), regulation, zoning, the availability of buildable land, lack of financing, and labor shortages.
The reality is that the companies that survived the 2008 crash are a much more conservative bunch than they used to be. They are looking for profits, not market share. They are targeting a specific return on capital for their business, probably 20% a year pretax.
It is no accident that new homebuilders like Lennar (LEN), Pulte Homes (PHM) and (DHI) make a fortune when building into rising prices and restricted supply. Their share prices have been on an absolute tear lately, and that is with a heartbreaking 6.5% mortgage rate.
This strategy is creating a structural shortage of 10 million new homes in this decade alone.
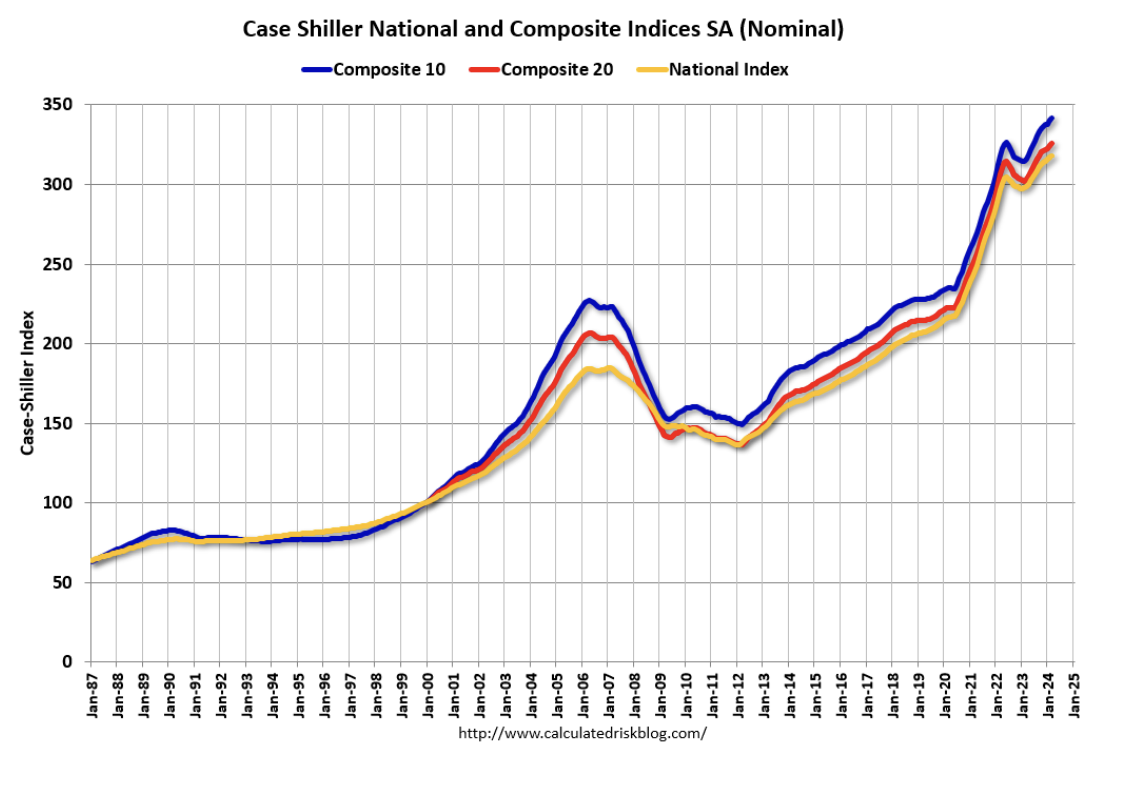
4) The Rear View Mirror
The Case Shiller CoreLogic National Home Price Index (see below) has started to fall after decades of increases. This will finally start to address affordability, one of the most daunting issues facing the market today.
Unless you have a new Internet start-up percolating in your garage, it is going to be very hard to beat your own home’s net return.
5) The Last Leverage Left
A typical down payment on a new home these days is 25%. That gives you leverage of 4:1. So in a market that is rising by 5.0% a year, your increase in home equity is really 20% a year.
Pay a higher interest rate, and down payments as low as 10% are possible, bringing your annual increase in home equity to an eye-popping 50%.
And if you qualify for an FHA loan up to $633,000, only a 3.5% deposit is required.
There are very few traders who can make this kind of return, even during the most spectacular runaway bull market. And to earn this money on your house, all you have to do is sleep in it at night.
6) The Tax Breaks are Great
The mortgage interest on loans up to $750,000 is deductible on your Form 1040, Schedule “A”, with a $40,000 limitation.
You can duck the capital gains entirely if the profit is less than $500,000, you’re married, and have lived in the house for 2 years or more.
Any gains above that are taxed at only a maximum 20% rate. These are the best tax breaks you can get anywhere without being a member of the 1%. Profits can also be deducted on the sale of a house if you buy another one at the equivalent value within 18 months.
7) There is No Overbuilding Anywhere
You know those forests of cranes that blighted the landscape in 2020? They are nowhere to be seen.
The other signs of excess speculation, liar’s loans, artificially high appraisals, and rapid flipping no longer exist. Much of this is now illegal, thanks to new regulations.
No bubble means no crash. Prices should just continue grinding upwards in a very boring, non-volatile way.
So the outlook is pretty rosy for individual homeownership for the foreseeable future.
Just don’t forget to sell by 2030 when the demographics reverse.
That's when the next round of trouble begins.
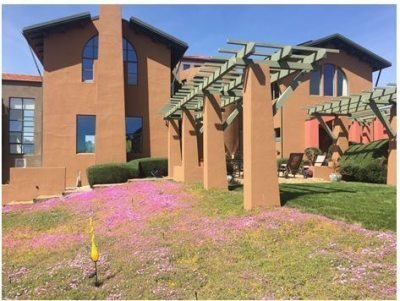
For Sale
https://www.madhedgefundtrader.com/wp-content/uploads/2016/11/Johns-House.jpg356473MHFTFhttps://madhedgefundtrader.com/wp-content/uploads/2019/05/cropped-mad-hedge-logo-transparent-192x192_f9578834168ba24df3eb53916a12c882.pngMHFTF2025-09-04 09:02:022025-09-04 16:04:53This Will Be Your Best Performing Asset for the Next 30 Years
At some point in 2024, we are going to need to SELL. Maybe there will be an economic slowdown, a surprise election outcome, or a flock of black swans. However, there is selling and then there is selling.
I have a new training video on how to execute a vertical bear put debit spread. You can watch the full 34-minute video by clicking here.
The last one was made seven years ago.
Since then, we have learned a lot from customer questions. The nature of the options markets has also changed. I recommend watching it on full screen so you can read all the numbers on my options trading platform.
I am normally a pretty positive person.
For me, the glass is always half full, not half empty, and it’s always darkest just before the dawn. After all, over the past 100 years, markets have risen 80% of the time, and that includes the Great Depression.
However, every now and then, conditions arise where it is prudent to sell short or make a bet that a certain security will fall in price.
This could happen for myriad reasons. The economy could be slowing down. Companies might disappoint on earnings. “Sell in May, and go away?" It works….sometimes. Oh, and new pandemic variants can strike at any time.
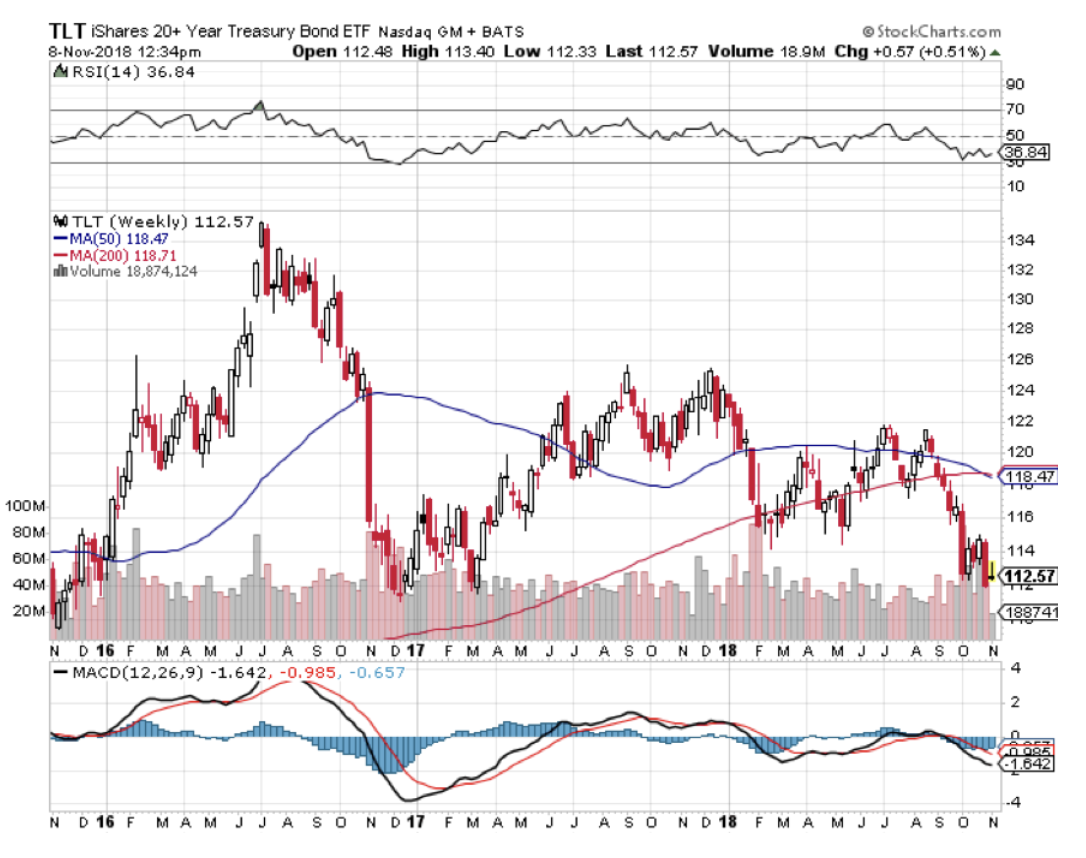
Other securities have long-term structural challenges, like the US Treasury bond market (TLT). Exploding deficits as far as the eye can see assure that government debt of every kind will be a perennial short for years to come.
Once you identify a short candidate, you can be an idiot and just buy put options on the security involved. Chances are that you will overpay and that accelerated time decay will eat up all your profits, even if you are right and the security in question falls. All you are doing is making some options trader rich at your expense.
For outright put options to work, your stock has to fall IMMEDIATELY, like in a couple of days. If it doesn’t, then the sands of time run against you very quickly. Something like 80% of all options issued expire unexercised.
And then there’s the right way to play the short side, i.e., MY way. You go out and buy a deep-in-the-money vertical bear put debit spread.
This is a matched pair of positions in the options market that will be profitable when the underlying security goes down, sideways, or up small in price over a defined, limited period of time. It is called a “debit spread” because you have to pay money to buy the position instead of receiving a cash credit.
It is the perfect position to have on board during a bear market, which we will almost certainly see by late 2019 or 2020. As my friend Louis Pasteur used to say, “Chance favors the prepared.”
I’ll provide an example of how this works with the United States Treasury Bond Fund (TLT,) which we have been selling short nearly twice a month since the bond market peaked in July 2016.
On October 23, 2018, I sent out a Trade Alert that read like this:
Trade Alert - (TLT) - BUY
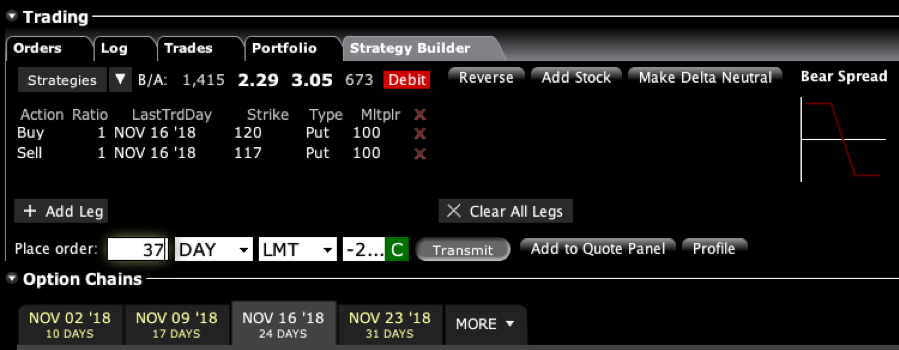
BUY the iShares Barclays 20+ Year Treasury Bond Fund (TLT) November 2018 $117-$120 in-the-money vertical BEAR PUT spread at $2.60 or best.
At the time, the (TLT) was trading at $114.64. To add the position, you had to execute the following positions:
Buy 37 November 2018 (TLT) $120 puts at…….………$5.70
Sell short 37 November 2018 (TLT) $117 puts at…….$3.10
Net Cost:………………………….………..………….…..........$2.60
Potential Profit: $3.00 - $2.30 = $0.40
(37 X 100 X $0.40) = $1,480 or 11.11% in 18 trading days.
Here’s the screenshot from my personal trading account:
This was a bet that the (TLT) would close at or below $117 by the November 16 options expiration day.
The maximum potential value of this position at expiration can be calculated as follows:
+$120 puts -$117 puts
+$3.00 profit
This means that if the (TLT) stays below $117, the position you bought for $2.60 will become worth $3.00 by November 16.
As it turned out, that was a prescient call. By November 2, or only eight trading days later, the (TLT) had plunged to $112.28. The value of the iShares Barclays 20+ Year Treasury Bond Fund (TLT) November 2018 $117-$120 in-the-money vertical BEAR PUT spread had risen from $2.60 to $2.97.
With 92.5% of the maximum potential profit in hand (37 cents divided by 40 cents), the risk/reward was no longer favorable to carry the position for the remaining ten trading days just to make the last three cents.
I, therefore, sent out another Trade Alert that said the following:
Trade Alert - (TLT) – TAKE PROFITS
SELL the iShares Barclays 20+ Year Treasury Bond Fund (TLT) November 2018 $117-$120 in-the-money vertical BEAR PUT spread at $2.97 or best
In order to get out of this position, you had to execute the following trades:
Sell 37 November 2018 (TLT) $120 puts at……………........…$7.80
Buy to cover short 37 November 2018 (TLT) $117 puts at….$4.83
Net Proceeds:………………………….………..…………...........…....$2.97
Profit: $2.99 - $2.60 = $0.37
(37 X 100 X $0.37) = $1,369 or 14.23% in 8 trading days.
Of course, the key to making money in vertical bear put spreads is market timing. To get the best and most rapid results, you need to buy these at market tops.
If you’re useless at identifying market tops, don’t worry. That’s my job. I’m right about 90% of the time and send out a STOP LOSS Trade Alert very quickly when I’m wrong.
With a recession and bear market just ahead of us, understanding the utility of the vertical bear put debit spread is essential. You’ll be the only guy making money in a falling market. The downside is that your friends will expect you to pick up every dinner check.
But only if they know.
Understanding Bear Put Spreads is Crucial in Falling Markets
https://www.madhedgefundtrader.com/wp-content/uploads/2019/08/Playing-the-Short-Side-with-Vertical-Bear-Put-Debit-Spreads.jpg400400MHFTFhttps://madhedgefundtrader.com/wp-content/uploads/2019/05/cropped-mad-hedge-logo-transparent-192x192_f9578834168ba24df3eb53916a12c882.pngMHFTF2025-07-23 09:02:122025-07-23 10:06:33Playing the Short Side with Vertical Bear Put Debit Spreads
One of the most fascinating things I learned when I first joined the equity trading desk at Morgan Stanley during the early 1980s was how to parallel trade.
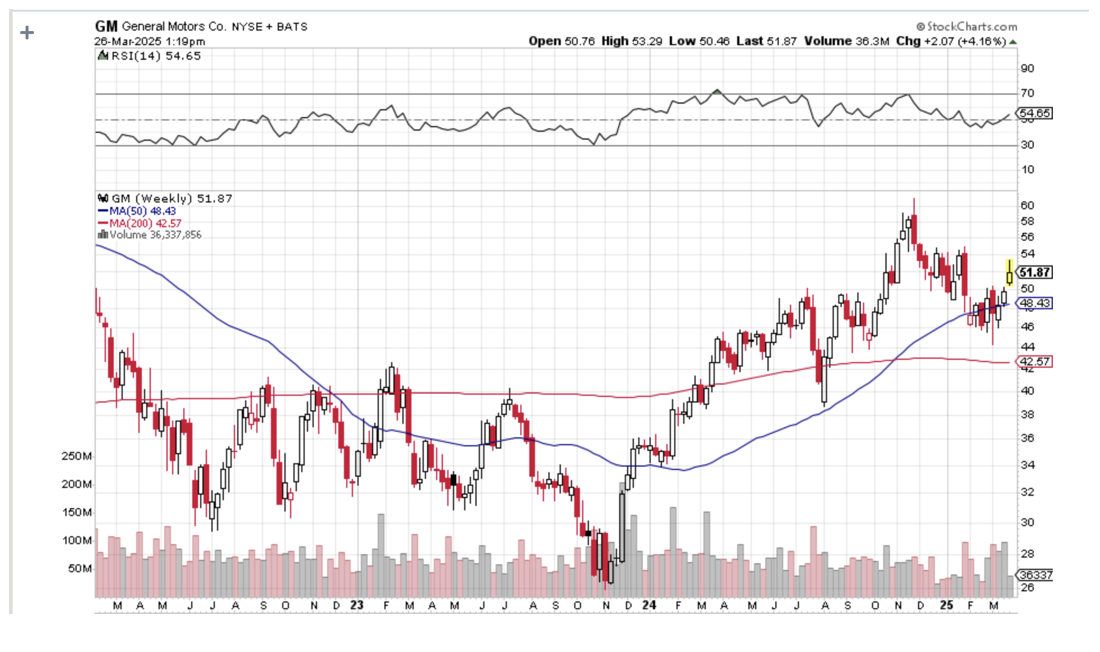
A customer order would come in to buy a million shares of General Motors (GM), and what did the in-house proprietary trading book do immediately?
It loaded the boat with the shares of Ford Motors (F).
When I asked about this tactic, I was taken away to a quiet corner of the office and read the riot act.
“This is how you legally front-run a customer,” I was told.
Buy (GM) in front of a customer order, and you will find yourself in Sing Sing shortly.
Ford (F), Toyota (TM), Nissan (NSANY), Daimler Benz (DDAIF), BMW (BMWYY), and Volkswagen (VWAPY), were all fair game.
The logic here was very simple.
Perhaps the client completed an exhaustive piece of research concluding that (GM) earnings were about to rise.
Or maybe a client's old boy network picked up some valuable insider information.
(GM) doesn’t do business in isolation. It has thousands of parts suppliers for a start. While whatever is good for (GM) is good for America, it is GREAT for the auto industry.
So through buying (F) on the back of a (GM) might not only match the (GM) share performance, it might even exceed it.
This is known as a Primary Parallel Trade.
This understanding led me on a lifelong quest to understand Cross Asset Class Correlations, which continues to this day.
Whenever you buy one thing, you buy another related thing as well, which might do considerably better.
I eventually made friends with a senior trader at Salomon Brothers while they were attempting to recruit me to run their Japanese desk.
I asked if this kind of legal front-running happened on their desk.
“Absolutely,” he responded. But he then took Cross Asset Class Correlations to a whole new level for me.
Not only did Salomon’s buy (F) in that situation, they also bought palladium (PALL).
I was puzzled. Why palladium?
Because palladium is the principal metal used in catalytic converters, it removes toxic emissions from car exhaust and has been required for every U.S.-manufactured car since 1975.
Lots of car sales, which the (GM) buying implied, ALSO meant lots of palladium buying.
And here’s the sweetener.
Palladium trading is relatively illiquid.
So, if you catch a surge in the price of this white metal, you would earn a multiple of what you would make on your boring old parallel (F) trade.
This is known in the trade as a Secondary Parallel Trade.
A few months later, Morgan Stanley sent me to an investment conference to represent the firm.
I was having lunch with a trader at Goldman Sachs (GS) who would later become a famous hedge fund manager, and asked him about the (GM)-(F)-(PALL) trade.
He said I would be an IDIOT not to take advantage of such correlations. Then he one-upped me.
You can do a Tertiary Parallel Trade here by buying mining equipment companies such as Caterpillar (CAT), Cummins (CMI), and Komatsu (KMTUY).
Since this guy was one of the smartest traders I ever ran into, I asked him if there was such a thing as a QuaternaryParallel Trade.
He answered “Abso******lutely,” as was his way.
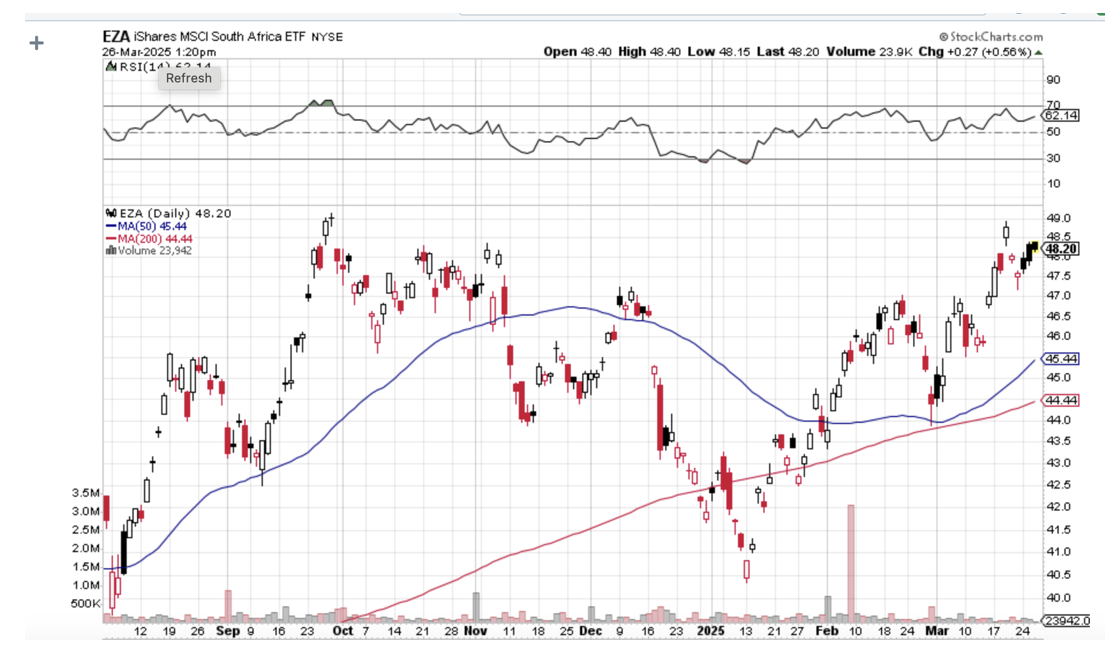
But the first thing he always did when searching for Quaternary Parallel Trades would be to buy the country ETF for the world’s largest supplier of the commodity in question.
In the case of palladium, that would be South Africa (EZA).
Since then, I have discovered hundreds of what I call Parallel Trading Chains and have been actively making money off of them. So have you, you just haven’t realized it yet.
I could go on and on.
If you ever become puzzled or confused about a trade alert I am sending out (Why on earth is he doing THAT?), there is often a parallel trade in play.
Do this for decades as I have and you learn that some parallel trades break down and die. The cross relationships no longer function.
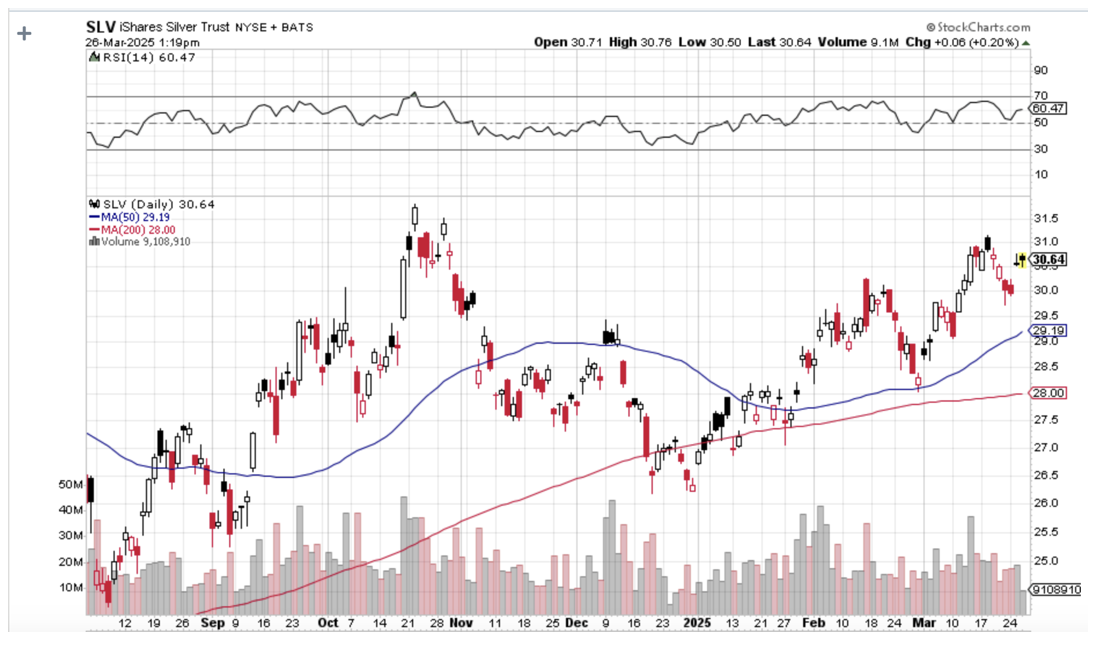
The best example I can think of is the photography/silver connection. When the photography business was booming, silver prices rose smartly.
Digital photography wiped out this trade, and silver-based film development is still only used by a handful of professionals and hobbyists.
Oh, and Eastman Kodak (KODK) went bankrupt in 2012.
However, it seems that whenever one Parallel Trading Chain disappears, many more replace it.
You could build chains a mile long simply based on how well Apple (AAPL) or NVIDIA (NVDA) is doing.
And guess what? There is a new parallel trade in silver developing. Whenever someone builds a solar panel anywhere in the world, they use a small amount of silver for the wiring. Build several tens of millions of solar panels and that can add up to quite a lot of silver.
What goes around comes around.
Suffice it to say that parallel trading is an incredibly useful trading strategy.
Ignore it at your peril.
https://madhedgefundtrader.com/wp-content/uploads/2019/05/cropped-mad-hedge-logo-transparent-192x192_f9578834168ba24df3eb53916a12c882.png00MHFTRhttps://madhedgefundtrader.com/wp-content/uploads/2019/05/cropped-mad-hedge-logo-transparent-192x192_f9578834168ba24df3eb53916a12c882.pngMHFTR2025-03-27 09:02:392025-03-27 10:43:53How to Gain an Advantage with Parallel Trading
There is no doubt that the “underground” economy is growing.
No, I’m not talking about violent crime, drug dealing, or prostitution.
Those are all largely driven by demographics, which right now are at a low ebb.
I’m referring to the portion of the economy that the government can’t see and therefore is not counted in its daily data releases.
This is a big problem.
Most investors rely on economic data to dictate their trading strategies.
When the data is strong, they aggressively buy stocks, assuming that a healthy economy will boost corporate profits.
When data is weak, we get the flip side, and investors bail on equities. They also sell commodities, precious metals, and oil, and plow their spare cash into the bond market.
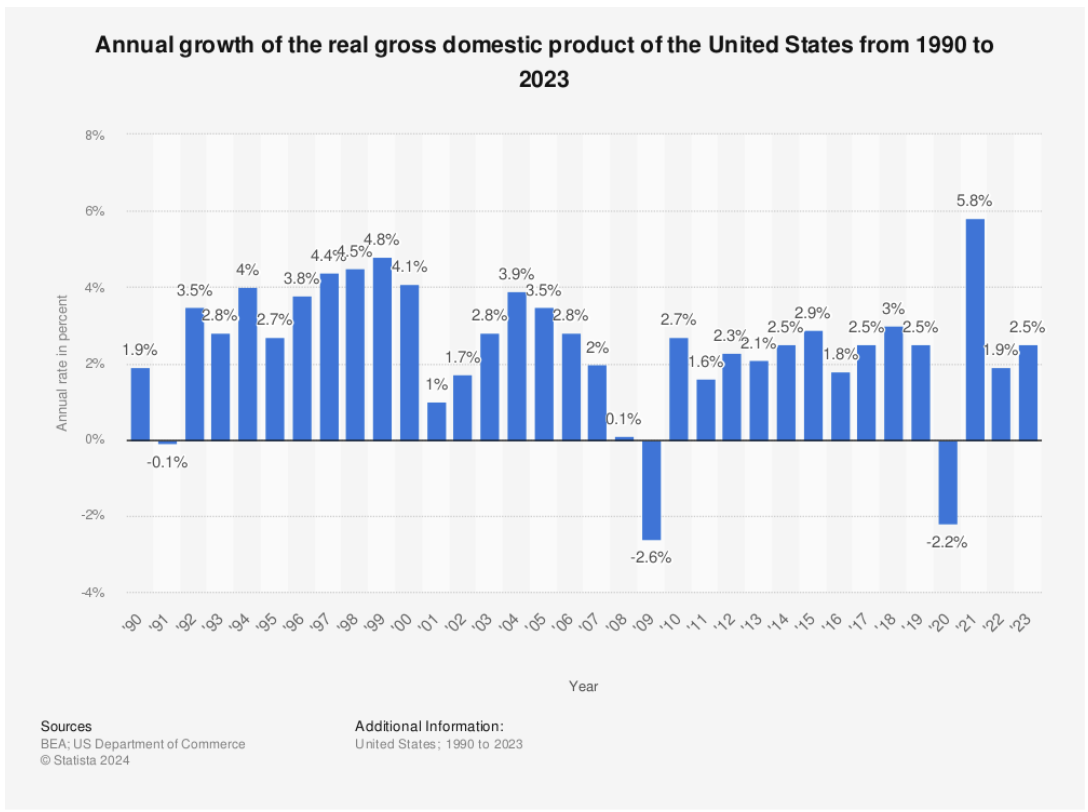
We are now halfway through a decade that has delivered unrelentingly low annual GDP growth, around the 2% to 2.5% level.
We all know the reasons. Retiring baby boomers, some 85 million of them, are a huge drag on the system, as they save and don’t spend.
Generation X-ers do spend, but there are only 58 million of them. And many Millennials are still living in their parents’ basements—broke and unable to land paying jobs in this ultra-cost-conscious world.
But what if these numbers were wrong? What if the Feds were missing a big part of the picture?
I believe this is, in fact, what is happening.
I think the economy is now evolving so fast, thanks to the simultaneous hyper-acceleration of multiple new technologies that the government is unable to keep up.
Further complicating matters is the fact that many new Internet services are FREE, and therefore are invisible to government statisticians.
They are, in effect, reading from a playbook that is decades or more old.
What if the economy was really growing at a 3% to 4% pace, but we just didn’t know it?
I’ll give you a good example.
The government’s Consumer Price Index is a basket of hundreds of different prices for the things we buy. But the Index rarely changes, while we do.
The figure the Index uses for Internet connections hasn’t changed in 20 years.
Gee, do you think that the price of broadband has risen in a decade, with the 1,000-fold increase in speeds?
In the early 2000s, you could barely watch a snippet of video on YouTube without your computer freezing up.
Now, I can live stream a two-hour movie in High Definition on my Comcast Xfinity 1 terabyte per second business line. And many people now watch movies on their iPhones. I see them in rush-hour traffic and on planes.
I’ll give you another example of the burgeoning black economy: Me.
My business shows up nowhere in the government economic data because it is entirely online. No bricks and mortar here!
Yet, I employ 15 people, provide services to thousands of individuals, institutions, and governments in 140 countries, and take in millions of dollars in revenues in the process.
I pay a lot of American taxes, too.
How many more MEs are out there? I would bet millions.
If the government were understating the strength of the economy, what would the stock market look like?
It would keep going up every year like clockwork, as ever-rising profits feed into stronger share prices.
But multiples would never get very high (now at 20 times earnings) because no one believed in the rally, since the visible economic data was so weak.
That would leave them constantly underweight equities in a bull market.
Stocks would miraculously and eternally climb a wall of worry, as they did until February.
On the other hand, bonds would remain strong as well, and interest rates low, because so many individuals and corporations were plowing excess, unexpected profits into fixed-income securities.
Structural deflation would also give them a big tailwind.
If any of this sounds familiar, please raise your hand.
I have been analyzing economic data for a half-century, so I am used to government statistics being incorrect.
It was a particular problem in emerging economies, like Japan and China, which were just getting a handle on what comprised their economies for the first time.
But to make this claim about the United States government, which has been counting things for 240 years, is a bit like saying the emperor has no clothes.
Sure, there has always been a lag between the government numbers and reality.
In the old days, they used horses to collect data, and during the Great Depression, numbers were kept on 3” X 5” index cards filled out with fountain pens.
But today, the disconnect is greater than it ever has been, by a large margin, thanks to technology.
Is this unbelievable?
Yes, but you better get used to the unbelievable.
There May Be More Here Than Meets the Eye
https://www.madhedgefundtrader.com/wp-content/uploads/2017/06/no-clothes.jpg392561MHFTRhttps://madhedgefundtrader.com/wp-content/uploads/2019/05/cropped-mad-hedge-logo-transparent-192x192_f9578834168ba24df3eb53916a12c882.pngMHFTR2025-03-26 09:02:472025-03-26 10:13:32Why The "Underground" Economy is Growing So Fast
Let’s say you absolutely love a stock but despise the currency of the country it comes from.
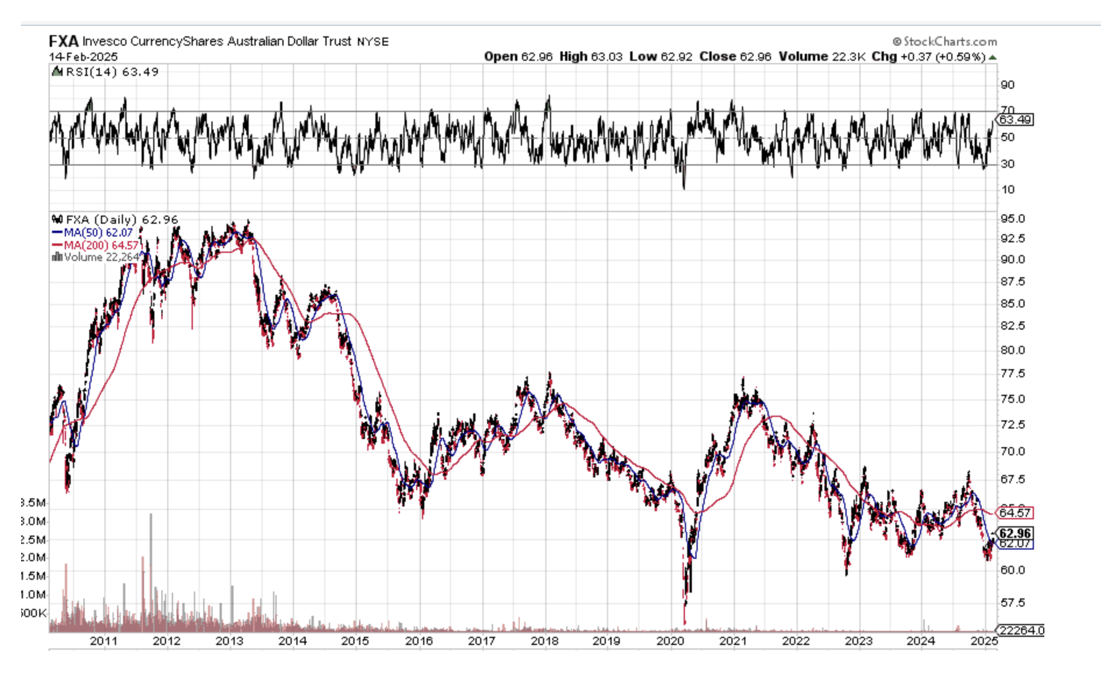
The United States comes to mind. The US Federal Reserve is about to commence with a policy of cutting interest rates that could last a year. That means the greenback is about to become the weakest currency in the world. Look at the ten-year chart below, and you’ll see that a major double bottom for the Aussie may be taking place.
Most American technology stocks are likely to gain 30% or more over the next two years. However, it’s entirely possible that the US dollar declines by 30% or more against the Australian (FXA) and Canadian (FXC) dollars during the same period. Making 30% and then losing 30% leaves you with precisely zero profit.
There is a way to avoid this dilemma that would vex Solomon. Simply hedge out your currency risk. I’ll use the example of the Australian dollar, as we have recently had a large influx of new subscribers from the land down under.
Let’s say you want to buy AUS$100,000 worth of Apple (AAPL), the world’s most widely owned stock.
Since Apple is listed on the New York Stock Exchange, its shares are denominated in US dollars. When you buy Apple in Australia, your local broker will automatically buy the US dollars for your account to settle this trade in the US, taking out a small commission along the way. You are now long US dollars, thus creating a currency risk.
Getting rid of this currency risk is quite simple. You need to offset your US dollar long with a US dollar short of equal value. Long dollars/short dollars give the Australian investor a currency-neutral position. The US dollar can go to hell in a handbasket, and you won’t care.
There are several financial instruments with which you can do this. Buying Invesco Currency Shares Australian Dollar Trust ETF (FXA) is the easiest. This ETF invests 100% of its assets in long Australian dollar/short US dollar futures and overnight cash positions.
I’ll do the math for you on the final hedged position, assuming that the Australian dollar is worth 70 US cents.
BUY AUS$100,000 long US dollars X US$0.70 cents/dollar = US$70,000.
US$70,000/$210 per share for Apple = 333 Apple shares
BUY US$70,000/$70 (FXA) price = US$1,000 shares of the (FXA)
Thus, by owning AUS$100,000 shares of Apple shares and 1,000 shares of the (FXA) you have completely removed the currency risk in owning Apple. You have, in effect, turned Apple into an Australian dollar-denominated stock. Apple can rise, the US dollar will fall, and you will make twice as much money in Australian dollars.
There are a few problems with this precise trade. The liquidity in the (FXA) is not great, especially during US trading hours. Understandably, the bulk of Aussie liquidity takes place during Australian business hours.
There are other instruments with which you can hedge out the currency risk of Apple or any other US dollar-denominated investment.
You can take out your own short dollar position in the futures market. You can ask your bank to create a short position in the US dollar in the cash market. Or, you can simply ask your broker to hedge out your US dollar currency risk, for which they will charge you another small commission.
Hedging out currency risk is not only free; the market will pay you to do it. That’s because Australian dollar overnight interest rates at 1.00% are lower than US dollar overnight interest rates at 2.50%. By shorting the Aussie against the buck, you get to keep this 1.50% interest differential.
You don’t have to be Australian to want your Apple shares denominated in Australian dollars. In fact, hedge funds do this all day long. They pursue a strategy of keeping their long position in the world’s strongest securities (Apple) and their short positions in the world’s weakest securities (the US dollar). This, by the way, is also the strategy of the Mad Hedge Fund Trader. It’s called “global long/short macro.”
The better ones often make money on both sides of the equation, with the longs rising and the shorts falling. You can do the same on your own personal online trading platform.
I should urge a word of caution here. What happens if you hedge out your US dollar risk, and the dollar continues to appreciate? Then you will get none of the gains from that appreciation and will end up losing money in Australian dollars if Apple shares remain unchanged.
In the worst case, if both Apple and the Aussie could go down, this accelerates your losses. So, currency hedging can be a double-edged sword. Yes, this may be irrational given the fundamentals of Aussie and Apple. But as any experienced long-term trader will tell you, “Markets can remain irrational longer than you can remain liquid.”
Many thanks to John Maynard Keynes.
Looks Like a Good Bet to Me
https://www.madhedgefundtrader.com/wp-content/uploads/2019/07/john-thomas-3-e1589907952307.png421450Mad Hedge Fund Traderhttps://madhedgefundtrader.com/wp-content/uploads/2019/05/cropped-mad-hedge-logo-transparent-192x192_f9578834168ba24df3eb53916a12c882.pngMad Hedge Fund Trader2025-02-20 09:04:202025-02-20 09:15:09How to Hedge Your Currency Risk
Take those predictions, forecasts, and prognostications with so many grains of salt. They have a notorious track record for being completely wrong, even when made by the leading experts in their fields. In preparing for my autumn lecture series, I came across the following nuggets and thought I’d share them with you. There are some real howlers.
1876“This 'telephone' has too many shortcomings to
be seriously considered as a means of communication.” --Western Union internal memo.
1895“Heavier than air flying machines are impossible.” --Lord Kelvin, president of the Royal Society.
1927 "Who the hell wants to hear actors talk?" --H.M. Warner, founder of Warner Brothers.
1943 “I think there is a world market for maybe five computers.” --Thomas Watson, Chairman of IBM.
1962 “We don't like their sound, and guitar music
is on the way out.” --Decca Recording Co. rejecting the Beatles, 1962.
1981 “640 kilobytes of memory ought to be enough for anybody.” --Bill Gates, founder of Microsoft.
Thomas Watson of IBM
The Beatles
A Younger Bill Gates
https://www.madhedgefundtrader.com/wp-content/uploads/2013/08/The-Beatles.jpg243429The Mad Hedge Fund Traderhttps://madhedgefundtrader.com/wp-content/uploads/2019/05/cropped-mad-hedge-logo-transparent-192x192_f9578834168ba24df3eb53916a12c882.pngThe Mad Hedge Fund Trader2025-02-19 09:04:182025-02-19 14:29:20And My Prediction Is . . .
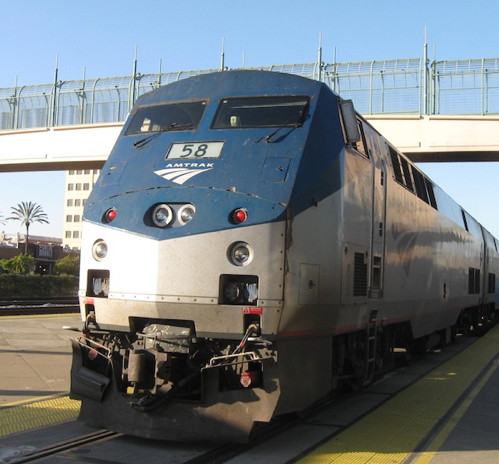
I am once again writing this report from a first-class sleeping cabin on Amtrak’s legendary California Zephyr.
By day, I have a comfortable seat next to a panoramic window. At night, they fold into two bunk beds, a single and a double. There is a shower, but only Houdini can navigate it.
I am anything but Houdini, so I foray downstairs to use the larger public hot showers. They are divine.
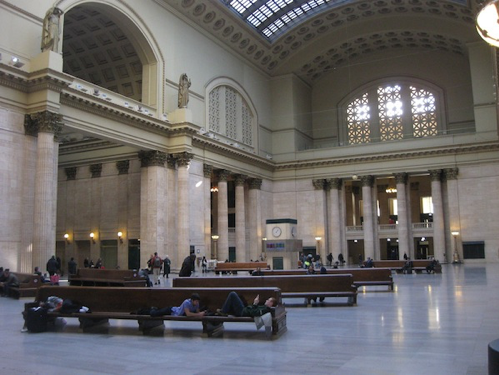
We are now pulling away from Chicago’s Union Station, leaving its hurried commuters, buskers, panhandlers, and majestic great halls behind. I love this building as a monument to American exceptionalism.
I am headed for Emeryville, California, just across the bay from San Francisco, some 2,121.6 miles away. That gives me only 56 hours to complete this report.
I tip my porter, Raymond, $100 in advance to make sure everything goes well during the long adventure and to keep me up to date with the onboard gossip. The rolling and pitching of the car is causing my fingers to dance all over the keyboard. Microsoft’s Spellchecker can catch most of the mistakes, but not all of them.
Chicago’s Union Station
As both broadband and cell phone coverage are unavailable along most of the route, I have to rely on frenzied Internet searches during stops at major stations along the way, like Omaha, Salt Lake City, and Reno, to Google obscure data points and download the latest charts.
You know those cool maps in the Verizon stores that show the vast coverage of their cell phone networks? They are complete BS.
Who knew that 95% of America is off the grid? That explains so much about our country today.
I have posted many of my favorite photos from the trip below, although there is only so much you can do from a moving train and an iPhone 16 Pro.
Somewhere in Iowa
The Thumbnail Portfolio
Equities – buy dips, but sell rallies too Bonds – avoid Foreign Currencies – avoid Commodities – avoid Precious Metals – avoid Energy – avoid Real Estate – avoid
1) The Economy – Cooling
I expect a modest 2.0% real GDP growth with a 4.0% inflation rate, giving an unadjusted shrinkage of the economy of negative -2% for 2025. That is down from 0% in in 2024. This may sound discouraging, but believe me, this is the optimistic view. Some of my hedge fund buddies are expecting a zero return over the next four years.
Virtually all independent economists expect the new administration's economic policies will be a drag on both the US and global economies. Trade wars are bad for everyone. When your customers are impoverished, your own business turns south. This is a big deal, since the Magnificent Seven, which accounted for 70% of stock market gains last year, get 60% of their profits from abroad.
The ballooning National Debt is another concern. The last time Trump was in office, he added $10 trillion to the deficit through aggressive tax cuts and spending increases. If this time, he adds another $10-$15 trillion, the National Debt could reach $50 trillion by 2030.
There are two issues here. For a start, Trump will find it a lot harder and more expensive to fund a National Debt at $50 trillion than $20 trillion. Second, borrowing of this unprecedented magnitude, double US GDP, will send interest rates soaring, causing a recession.
The only question then is whether this will be a pandemic-style recession, which took stocks down 30% and recovered quickly, or a 2008 recession which demolished stocks by 52% and dragged on for years.
Hope for the best but expect the worst, unless you want to consider a future career as an Uber driver.
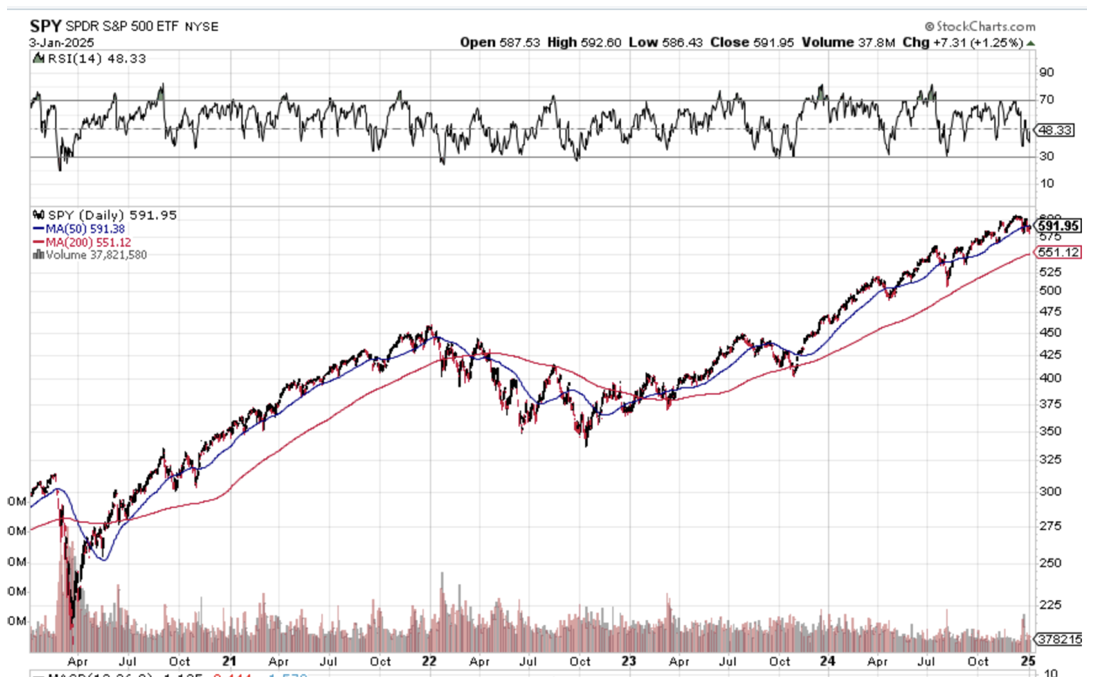
The outlook for stocks for 2025 is pretty simple. You are going to have to work twice as hard to make half the money you did last year with twice the volatility. You will not be able to be as nowhere near aggressive in 2025 as you were in 2024It’s a dream scenario for somebody like me. For you, I’m not so sure.
It’s not that US companies aren't growing gangbusters. I expect 2% GDP growth, 15% profit growth, and 12% net margin growth in 2025. But let’s face reality. Stocks are the most expensive they have been in 17 years and we know what happened after 2008. Much of the stock market gain achieved last year was through hefty multiple expansions. This is not good.
Big tech companies might be able to deliver 20% gains and are still the lead sector for the market. Normally that should deliver you a 15%, or $800 gain in the S&P 500 (SPX). We might be able to capture this in the first half of 2025.
Financials will remain the sector with the best risk/reward, and I mean the broader definition of the term, including banks, brokers, money managers, and some small-cap regional banks. The reason is very simple. Their income statements will get juiced at both ends as revenues soar and costs plunge, thanks to deregulation.
No passage of new laws is required to achieve this, just a failure to enforce existing ones. The hint for this is a new SEC chair whose primary interest is promoting the Bitcoin bubble. Buy (GS), (MS), (JPM), (BAC), (C), and (BLK).
However, this is anything but a normal year. Uncertainty is at an eight-year high, thanks to an incoming administration. If the promised policies are delivered, inflation will soar and interest rates will rise, as they already have. We could lose half or all of our stock market gains by the end of 2025.
The big “tell” for this was the awful market performance in December, down 5%. The Dow Average was down ten days in a row for the first time in 70 years. Santa Claus was unceremoniously sent packing. People Are clearly nervous. But then they should be with a bull market that is approaching a decrepit five years in age.
There is a bullish scenario out there and that has Trump doing absolutely nothing in 2025, either because he is unwilling or unable to take action. After all, if the economy isn’t actually broken, why fix it? Better yet, if you own an economy it is better not to break it in the first place.
Nothing substantial can pass Congress with a minuscule one-seat majority in the House of Representatives. There will be no new presidential action through tariffs and only a few token, highly televised deportations, not enough to affect the labor market.
Stocks will not only hold, but they may add to the 15% first-half gains for the year. I give this scenario maybe a 50% probability.
The first indication this is happening is when the presidential characterization of the economy flips in a few months from the world’s worst to the world’s best with no actual change in the numbers. Trump will take all the credit.
You heard it here first.
Frozen Headwaters of the Colorado River
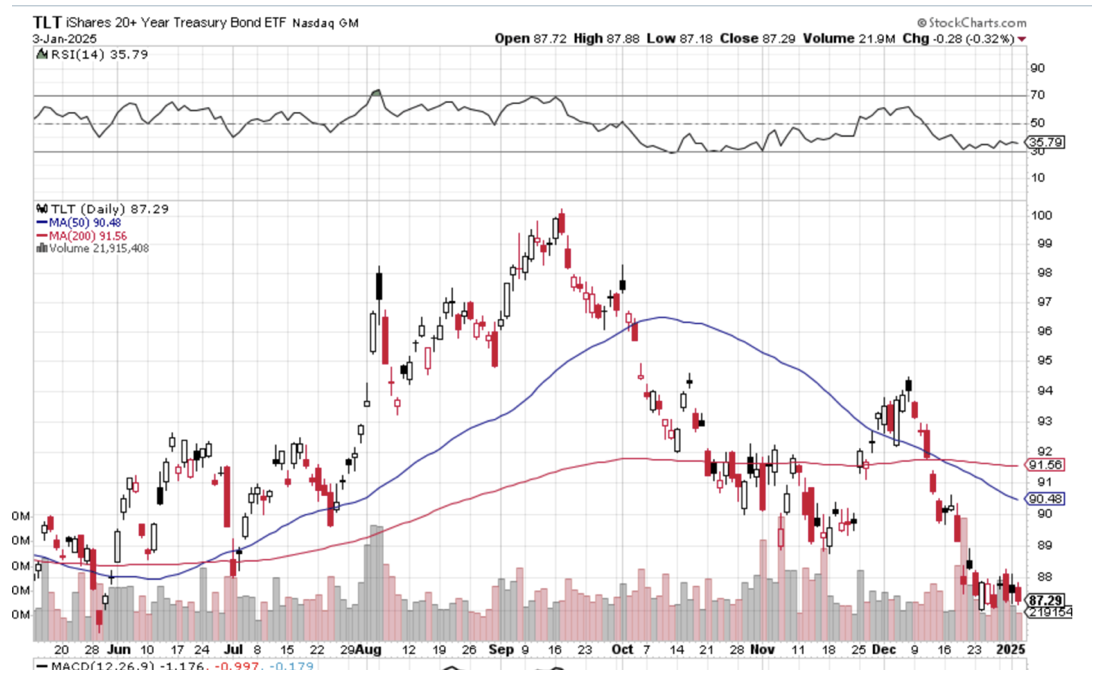
3) Bonds (TLT), (TBT), (JNK), (PHB), (HYG), (MUB), (LQD) Amtrak needs to fill every seat in the dining car to get everyone fed on time, so you never know who you will share a table with for breakfast, lunch, or dinner.
There was the Vietnam Vet Phantom Jet Pilot who now refused to fly because he was treated so badly at airports. A young couple desperately eloping from Omaha could only afford seats as far as Salt Lake City. After they sat up all night, I paid for their breakfast.
A retired British couple was circumnavigating the entire US in a month on a “See America Pass.” Mennonites returned home by train because their religion forbade travel by automobiles or airplanes.
The big question to ask here after a 100-basis point rise in bond yields in only three months is whether the (TLT) has suffered enough. The short answer is no, not quite yet, but we’re getting close. Fear of Trump policies should eventually take ten-year US Treasury bond yields to 5.00%, and then we will be ready for a pause at a nine-month bottom. After that, it depends on how history unfolds.
If Trump gets everything he wants, inflation will soar, bonds will crash, and 5.00% will be just a pit stop on the way to 6.00%, 7.00%, and who knows what? On the other hand, if Trump gets nothing he says he wants, then both bonds stocks and bonds will rise, creating a Goldilocks scenario for all balanced portfolios and investors.
That also sets up a sweet spot for entry into (TLT) call spreads close to 5.00% yields. A politician campaigning on one policy, then doing the opposite once elected? Stranger things have happened. The black swans will live.
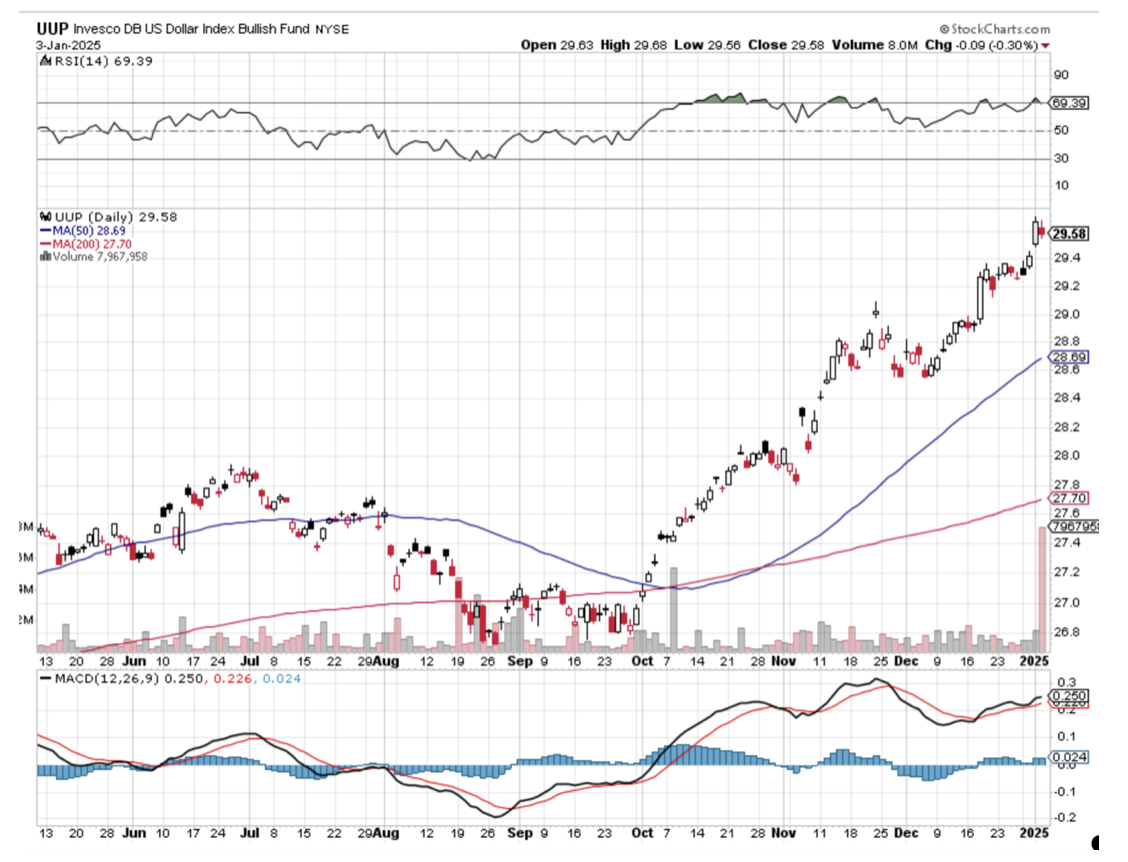
If your basic assumption for interest rates is that they stay flat or rise, then you have to love the US dollar. Currencies are all about expected interest rate differentials and money always pours into the highest-paying ones. Tariffs will add fat to the fire because any reduction in international trade automatically reduces American trade deficits and is therefore pro-dollar.
This means that you should avoid all foreign currency plays like the plague, including the Euro (FXE), Japanese yen (FXY), British Pound (FXB), Canadian dollar (FXE), and Australian dollar (FXA).
A strong greenback comes with pluses and minuses. It makes our exports expensive and less competitive and therefore creates another drag on the economy. It demolishes traditional weak dollar plays like emerging markets and precious metals. On the other hand, it attracts substantial foreign investments into US stocks and bonds, which has been continuing for the past decade.
Above all, be happy you are paid in US dollars. My foreign clients are getting crushed in an increasingly expensive world.
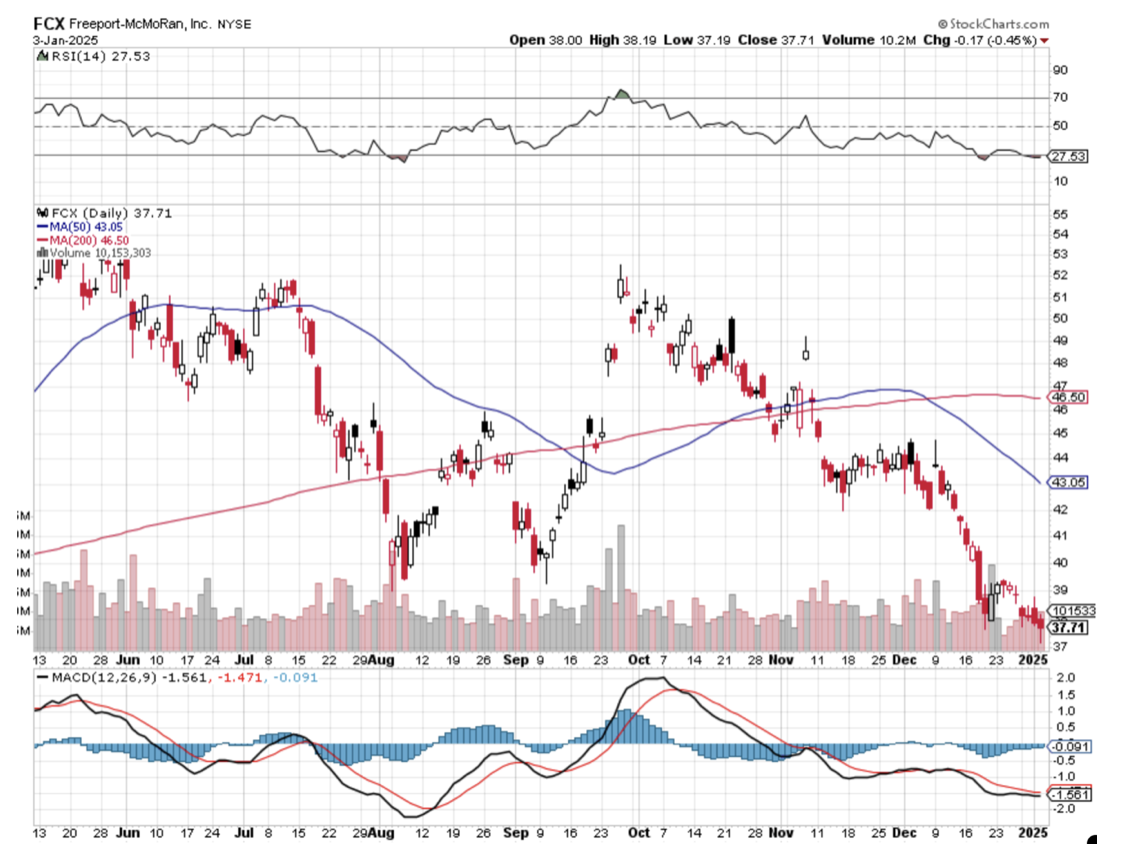
5) Commodities (FCX), (BHP), (RIO), (VALE), (DBA) Look at the chart of any commodity stock and you see grim death. Freeport McMoRan (FCX), BHP (BHP), and Rio Tinto (RIO), they’re all the same. They’re all afflicted with the same disease, over-dependence on a robustly growing China, which isn’t growing robustly, if at all.
I firmly believe that this will continue until the current leadership by President Xi Zheng Ping ends. He has spent the last decade globally expanding Chinese interests, engaging in abusive trade practices, hacking, and attacking American allies like Taiwan and the Philippines.You can only wave a red flag in front of the US before it comes back to bite you. A trade war with the US is now imminent.
This will happen sooner than later. The Chinese people don’t like being poor for very long. This is why I didn’t get sucked in on the Chinese long side in the fall, as many hedge funds did.
If China wants to go back to playing nice, as they did in the eighties and nineties, China should return to return to high growth and commodities will look like great “Buys” down here. If they don’t, American growth alone should eventually pull commodities up, as our economy is now growing at a long-term average gross unadjusted 6.00% rate. So the question is how long this takes.
It may pay to start nibbling on the best quality bombed-out names now, like those above.
Snow Angel on the Continental Divide
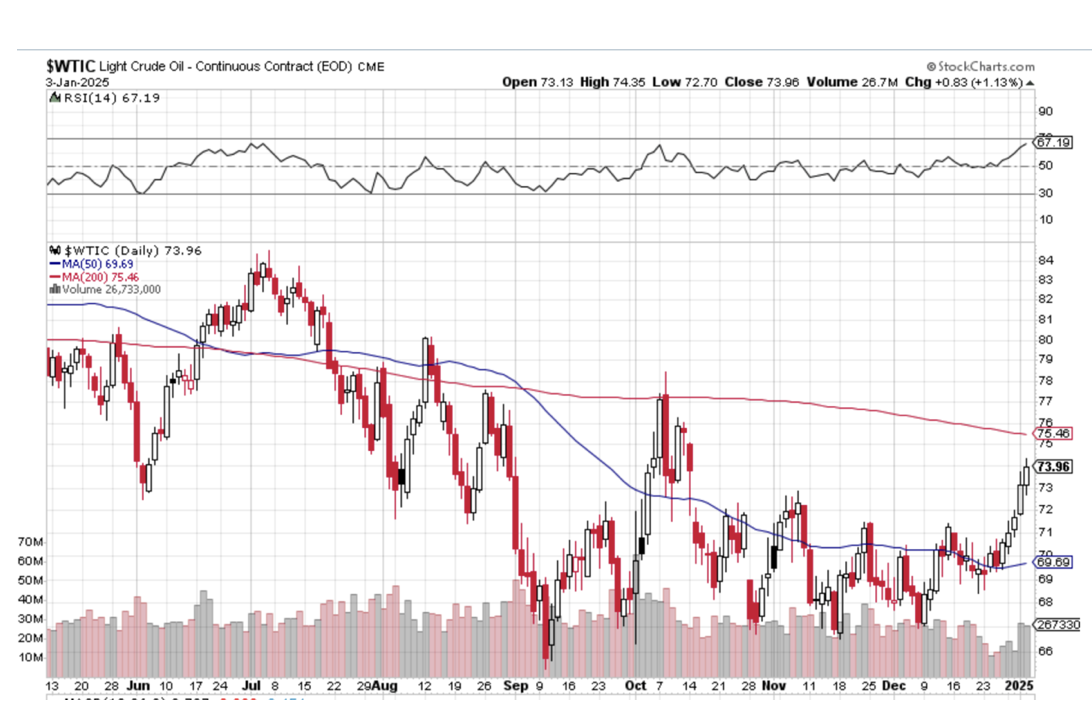
6) Energy (DIG), (USO), (DUG), (UNG), (USO), (XLE), (LNG), (CCJ), (VST), (SMR) Energy was one of the worst-performing sectors in the market for the second year in a row and 2025 is looking no better. New supplies are surging, while demand remains stuck in the mud, with the US now producing an incredible 13.5 million barrels a day. OPEC is dead.
EVs now make up 10% of the US auto fleet, and much more in other countries, are making a big dent. Some 50% of all new car sales in China, the world’s largest market, are EVs. The number of barrels of oil needed to increase a unit of American GDP is plunging, as it has done for 25 years, through increased efficiencies. Remember your old Lincoln Continental that used to get eight miles per gallon? Now it gets 27.
Worse yet, a major black swan hovers over the sector. If the Ukraine War somehow ends, some ten million barrels a day of Russian oil will hit the market. Oil prices should plunge to $50 a barrel.
There are always exceptions to the rule, and energy plays not dependent on the price of oil would be a good one. So is natural gas, which will benefit from Cheniere Energy’s (LNG) third export terminal coming online, increasing exports to China. Ukraine cutting off Russian gas flowing to Europe will assure there is plenty of new demand.
But I prefer investing in sectors that have tailwinds and not headwinds. Better leave energy to the pros who have the inside information they need to make money here.
If someone is holding a gun to your head tell you that you MUST invest in energy, go for the new nuclear plays like (CCJ), (VST), and (SMR). We are only at the becoming of the small modular reactor trend, which could accelerate for decades.
The train has added extra engines at Denver, so now we may begin the long laboring climb up the Eastern slope of the Rocky Mountains.
On a steep curve, we pass along an antiquated freight train of hopper cars filled with large boulders.
The porter tells me this train is welded to the tracks to create a windbreak. Once, a gust howled out of the pass so swiftly, that it blew a passenger train over on its side. In the snow-filled canyons, we saw a family of three moose, a huge herd of elk, and another group of wild mustangs. The engineer informs us that a rare bald eagle is flying along the left side of the train. It’s a good omen for the coming year. We also see countless abandoned 19th-century gold mines and the broken-down wooden trestles leading to huge piles of tailings, relics of previous precious metals booms. So, it is timely here to speak about the future of precious metals.
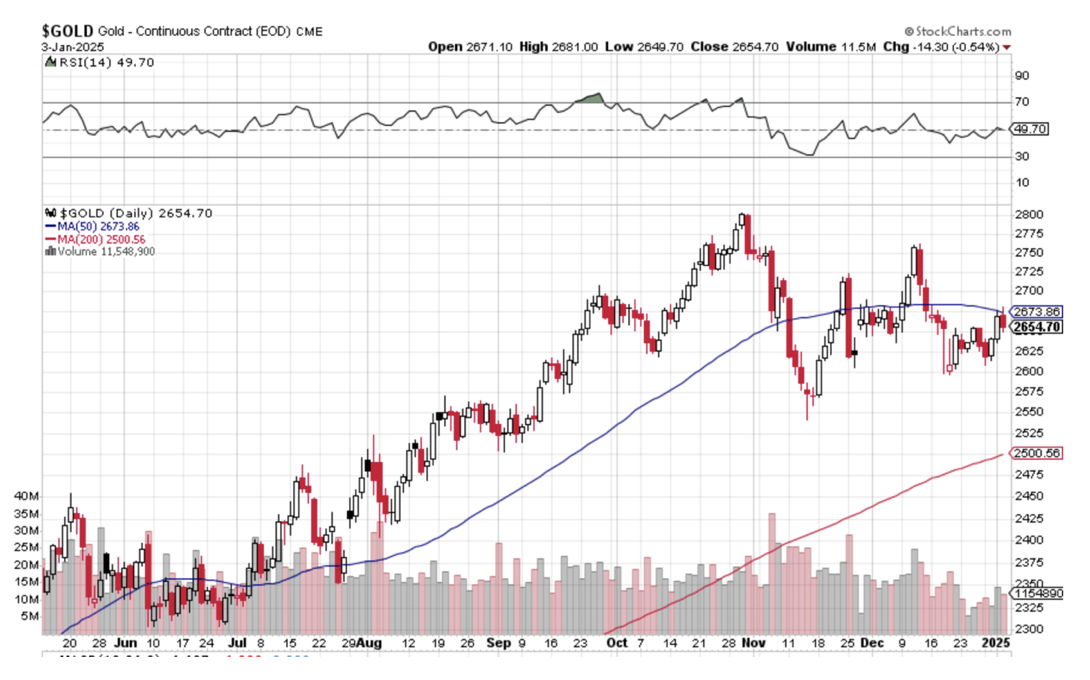
We certainly got a terrific run on precious metals in 2025, with gold at its highs up 33% and silver up 65%. The miners did even better. Even after the post-election selloff, it was still one of the best-performing asset classes of the year.
But the heat has definitely gone out of this trade. The prospect of higher interest rates for longer in 2025 has sent short-term traders elsewhere. That’s because the opportunity cost of owning precious metals is rising since they pay no interest rates or dividends. And let’s face it, there was definitely new competition for hot money from crypto, which doubled after the election.
The sector is not dead, it is resting. Central bank buying of the barbarous relic continues unabated, especially among sanctioned countries, like Russia and China. Gold is still the principal savings vehicle for many Chinese. They are not going to recover confidence in their own currency, banks, or government anytime soon. And there is still slow but steadily rising industrial demand from solar sectors.
Gold supply has also been falling for years, while costs are rising at least at double the headline inflation rate. So it’s just a matter of time before the supply/demand balance comes back in our favor. Where the final bottom is anyone’s guess as gold lacks the traditional valuation parameters of other asset classes, like dividends or interest paid. We’ll just have to wait for Mr. Market to tell us, who is always right.
Give (GLD), (SLV), (GDX), (GOLD), and (WPM) a rest for now but I’ll be back.
Crossing the Great Nevada Desert Near Area 51
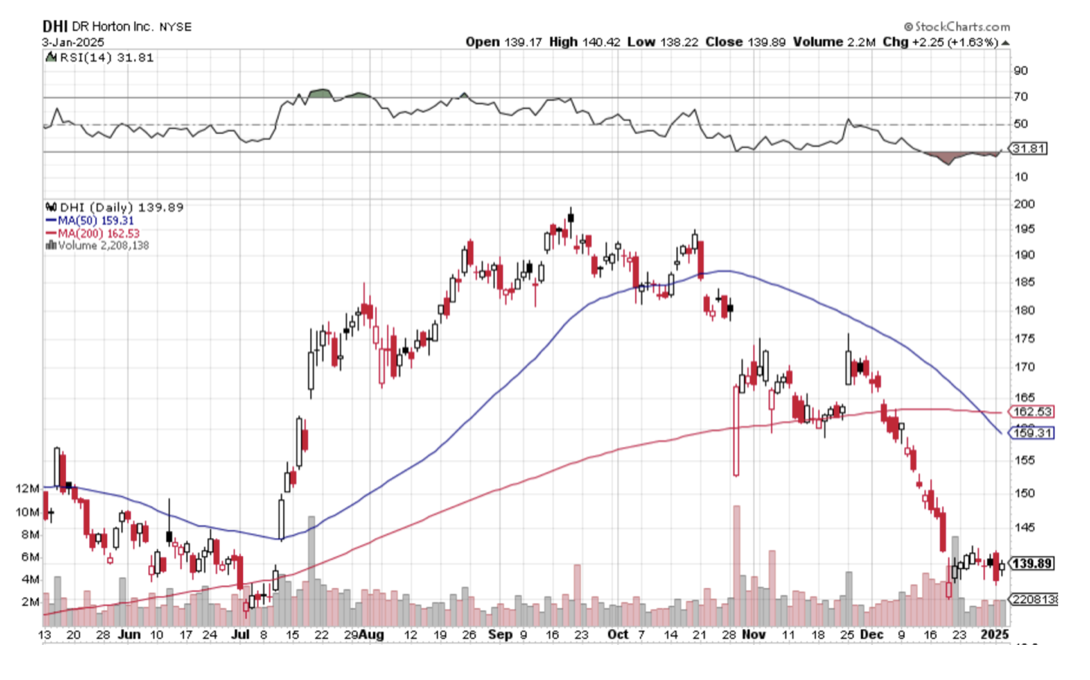
8) Real Estate (ITB), (LEN), (KBH), (PHM), (DHI)
The majestic snow-covered Rocky Mountains are behind me. There is now a paucity of scenery, with the endless ocean of sagebrush and salt flats of Northern Nevada outside my window, so there is nothing else to do but write.
My apologies in advance to readers in Wells, Elko, Battle Mountain, and Winnemucca, Nevada. It is a route long traversed by roving bands of Indians, itinerant fur traders, the Pony Express, my own immigrant forebearers in wagon trains, the Transcontinental Railroad, the Lincoln Highway, and finally US Interstate 80, which was built for the 1960 Winter Olympics at Squaw Valley, California. Passing by shantytowns and the forlorn communities of the high desert, I am prompted to comment on the state of the US real estate market.
Real estate was a nice earner for us in 2024 in the new homes sector. The election promptly demolished this trade with the prospect of higher interest rates for longer. Expect this unwelcome drag to continue in 2025.
I am not expecting a housing crash unless interest rates take off. More likely it will continue to grind sideways on low volume. That’s because the market has support from a structural shortage of 10 million homes in the US, the debris left over from the 2008 housing crash. That’s why there is still a Millennial living in your basement. Homebuilders now prioritize profit margins over market share.
I expect this sector to come back someday. New homebuilders have the advantage of offering free upgrades and discounted in-house financing. Avoid for now (DHI), (KBH), (TOL), and (PHM).
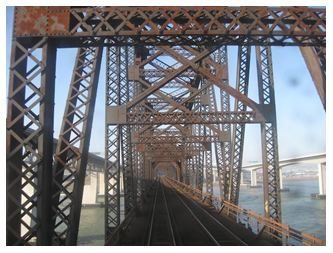
Crossing the Bridge to Home Sweet Home
9) Postscript We have pulled into the station at Truckee amid a howling blizzard.
My loyal staff have made the ten-mile trek from my estate at Incline Village to welcome me to California with a couple of hot breakfast burritos and a chilled bottle of Dom Perignon Champagne, which has been cooling in a nearby snowbank. I am thankfully spared from taking my last meal with Amtrak.
After that, it was over legendary Donner Pass, and then all downhill from the Sierras, across the Central Valley, and into the Sacramento River Delta.
Well, that’s all for now. We’ve just passed what was left of the Pacific mothball fleet moored near the Benicia Bridge (2,000 ships down to six in 80 years). The pressure increase caused by a 7,200-foot descent from Donner Pass has crushed my plastic water bottle. Nice science experiment!
The Golden Gate Bridge and the soaring spire of Salesforce Tower are just coming into view across San Francisco Bay.
A storm has blown through, leaving the air crystal clear and the bay as flat as glass. It is time for me to unplug my MacBook Pro, iPad, and iPhone, pick up my various adapters, and pack up.
We arrive in Emeryville 45 minutes early. With any luck, I can squeeze in a ten-mile night hike up Grizzly Peak tonight and still get home in time to watch the ball drop in New York’s Times Square on TV.
I reach the ridge just in time to catch a spectacular pastel sunset over the Pacific Ocean. The omens are there. It is going to be another good year.
I’ll shoot you a Trade Alert whenever I see a window open at a sweet spot on any of the dozens of trades described above, which should be soon.
Good luck and good trading in 2025!
John Thomas
The Mad Hedge Fund Trader
The Omens Are Good for 2025!
https://www.madhedgefundtrader.com/wp-content/uploads/2013/01/Zephyr.jpg342451april@madhedgefundtrader.comhttps://madhedgefundtrader.com/wp-content/uploads/2019/05/cropped-mad-hedge-logo-transparent-192x192_f9578834168ba24df3eb53916a12c882.pngapril@madhedgefundtrader.com2025-01-08 09:00:172025-02-20 12:40:412025 Annual Asset Class Review
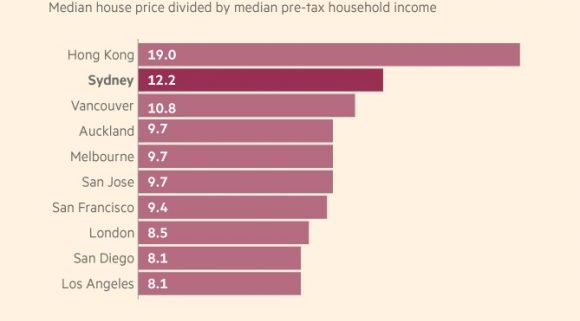
Hardly a day goes by when a reader doesn’t ask me when the Australian real estate bubble is going to burst.
They are right to be concerned.
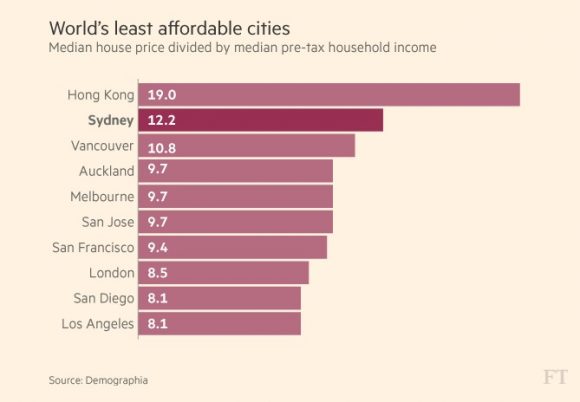
In the table below, Sydney is ranked as the second most expensive market in the world at 12.2 times the local median pre-tax household annual income.
It is far behind Hong Kong, at 19.9 times, and just ahead of Vancouver, Canada, at 10.8 times.
Even Australian banking regulators are concerned about a “Dutch tulip” style mania developing in the Land Down Under.
They are worried that the coming price collapse will pose a major threat to their financial system.
Indeed, a home on Sydney Harbor owned by my former employer, the Fairfax newspaper family, sold for a staggering AUS$75 million, a new record for the country.
Sure, the views are great. But AUS$75 million?
I have been through a lot of these real estate booms over the past five decades.
There was the notorious Japanese bubble in 1990. I have been through at least three such booms in California. Here, real estate brokers can turn into Uber drivers in a heartbeat.
And they always follow the same predictable pattern.
How high is high? Think of an absurd, impossible number, and then double it. That always seems to be a good rule of thumb. Except that Australia is already past that last doubling.
When my Australian friends ask how high prices can go, I tell them to check out prices in Shanghai, where apartments go for twice as high for a quarter of the space.
In fact, identifying bubble tops is a fool’s errand. When markets become irrational, the last thing buyers care about is rationality, hard data, or valuations.
In the past, the music always stopped playing for the same reasons.
Central banks fearful of inflation slammed on the brakes and drove interest rates through the roof, as Paul Volker did in 1980.
An extraneous shock, such as the 1973 and 1979 oil price spikes or the 1991 Savings & Loan Crisis, can also let the air out of the balloon.
I remember that during the S&L Crisis, I was ushered in to see a California property, and the owner burst into tears when the agent mentioned the price because of the huge personal hit he was taking on his equity.
Except that this time, it’s different.
Real estate used to be local. Now, it’s global.
You have the same factor pushing up property in prime markets all over the world at the same time: Chinese buying.
For a decade now, buyers from the Middle Kingdom have been bidding up the prices of homes in London, Australia, New York, Vancouver, and elsewhere.
You know that nice little mansion I sold in London in 1994 for $2 million? It’s now worth $20 million.
In nearby Napa Valley, CA, the Chinese are snapping up trophy vineyards left and right, paying wildly inflated prices. Prices are up an eye-popping 16.6% year on year.
You can always tell when a property changes hands when the stone lions show up at the front gates.
Their goal is the same everywhere. Get their money out of China before the wheels fall off, be it for economic or political reasons.
The Chinese aren’t looking for retirement homes. They need bolt-hole places to hide out.
A stepped-up anti-corruption campaign by the Beijing government seems to have accelerated the trend.
The capital flows have been so enormous that the Chinese government has had to liquidate $1 trillion in foreign exchange reserves, a quarter of the total, primarily held in US Treasury bonds, notes, and bills, to support the Renminbi.
These gargantuan capital flows have created the same anomalies around the world, that of “ghost neighborhoods” owned for investment purposes only.
On the receiving end, the US government is taking measures to stem money laundering and tax evasion.
The IRS is using the Patriot Act to require proof of ownership for all real estate purchases over $2 million in New York and San Francisco.
Cayman Islands, British Virgin Islands, and Cook Islands nominee holding companies or LLC’s can no longer be used as identity shields.
Without real residents living there, local businesses, like dry cleaners, coffee shops, and supermarkets, die off for lack of customers.
Take a walk around the Mayfair district of London one of these days, and you’ll see what I mean.
Or ride up and down the elevators in the residential towers at New York’s Columbus Circle, where 60% of the apartments are foreign-owned.
I even have one of these at the end of my street here in San Francisco.
The home came on the market for $2.1 million three years ago and sold in a day for $2.3 million. It has been empty ever since.
(By the way, the opposite end of my street displays San Francisco’s other big problem, start-ups moving into cheaper residences to avoid sky-high commercial property rates. There, the lights NEVER go out.)
Real estate agents everywhere love the business.
Most of these deals are done for cash only with rushed due diligence. Loan approvals and appraisals, frequent deal killers for domestic buyers, never even enter the picture.
For the sake of full disclosure, I have to admit that I have been a happy participant in the property gold rush like everyone else, making a kings ransom on properties I bought during the 2011 bottom, at least on paper.
Look at the table below, and you’ll see that four of the world’s ten most expensive cities are in California. Perhaps I shouldn’t throwing stones in glass houses.
But at least here, you have multiple booms going on in technology, health care, alternative energy, and transportation, driving earnings, and, therefore, house prices.
Since the causes of this bubble are largely come from China, so must the end.
A serious economic slowdown in China would tip the balance. So would a trade war with the US.
Tougher controls on capital flows could stem the tide. So would political instability, never far below the surface in China.
Whatever the reason, leveraged owners of luxury real estate anywhere on the planet should always keep one thing in mind: Your fate is totally in the hands of China.
https://www.madhedgefundtrader.com/wp-content/uploads/2018/04/Worlds-least-affordable-cities-story-1-image-1-e1523486486630.jpg402580MHFTRhttps://madhedgefundtrader.com/wp-content/uploads/2019/05/cropped-mad-hedge-logo-transparent-192x192_f9578834168ba24df3eb53916a12c882.pngMHFTR2024-11-27 09:04:142024-11-27 11:40:40The Real Estate Crash Coming to a Market Near You
Once a certain investment theme takes hold, the imitators start coming out of the woodwork in droves.
In 1989, all of the largest Japanese banks stampeded issuing naked short put options on the Nikkei Average by the billions of dollars when the index was at an all-time high. The Nikkei then fell by 85% causing tens of billions worth of losses.
I remember signing the paperwork on a $3 billion deal for the Industrial Bank of Japan on behalf of Morgan Stanley. It’s been 35 years, and I’m still waiting for those investors to come after me.
Then there was the peak of the Dotcom Bubble in 2000 and no less than five online pet food delivery companies raised billions. (remember Webvan and those cute sock puppets?) Every one of them went under.
So, what has been one of the biggest fads of 2024?
That would be electric vehicles.
You no longer have to wear Birkenstocks, grow your hair long, and smoke pot to drive an electric car. They have become a major part of the American economy. According to Adam Jonas at Morgan Stanley, EVs account for 8% of the total car market today and will grow to 10% by 2025 and 25% by 2030.
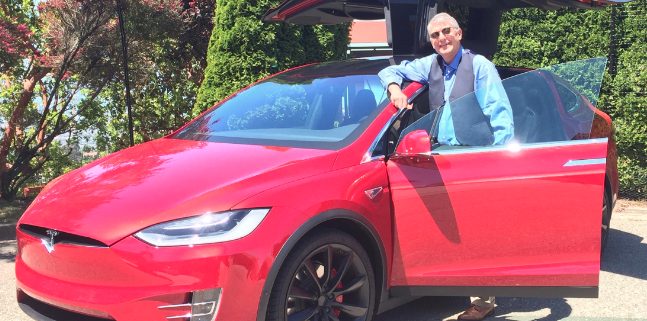
I have been involved with Tesla (TSLA) since its earliest days way back in 2003. Then it was one rich man’s hobby, with technology that was a reach at best, and unlikely to ever see the light of day as a public company. There it remained for seven years.
Then Tesla brought out the Model S in 2010, which I snapped up as fast as I could, picking up chassis no. 125 at the Fremont factory. My signature is still on the wall there as are those for all of the first 125 buyers. Every time I pick up a new Tesla I check if it is still there.
If the Model S worked it had the potential to be a real car. If it didn’t, I would wind up with $100,000 worth of inert aluminum, steel, silicon, rubber, lithium, and copper with only scrap metal value.
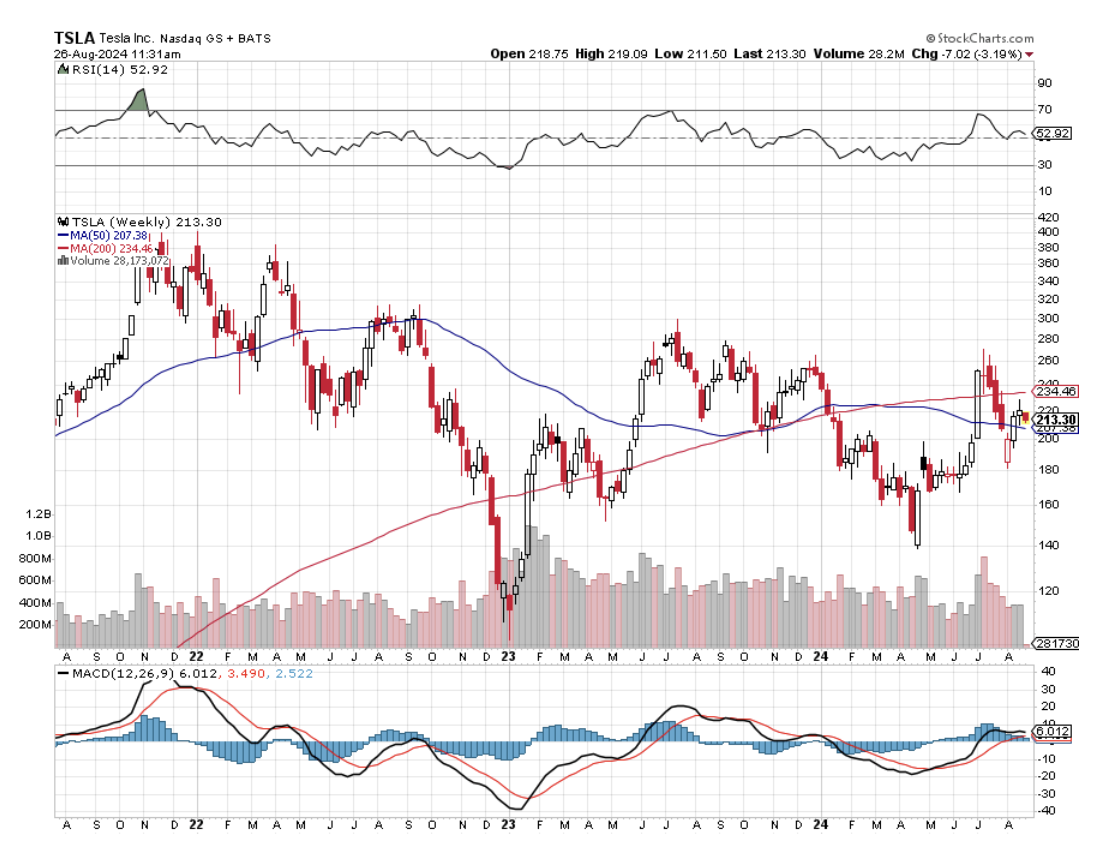
The trials were then only just beginning for Musk. He faced nervous breakdowns, sleeping in factories, and SEC prosecutions. After a decade of abuse, suddenly everything clicked. Total Tesla production is now running at a 1.7 million vehicle annual rate. The shares leaped 180-fold to a split-adjusted $425 from their post-IPO low of $2.40. That move financed a lot of retirements among my readers.
I remember what Steve Jobs once told me; “Like many overnight successes, this one took decades to pull off.”
Suddenly, making electric cars looked easy. Raising money to finance them looked even easier.
The problem is that all the new EV entrants now have a hyper-aggressive Tesla to compete against. Tesla has already locked up long-term supplies of crucial commodities essential for EV production, like copper, lithium, and chromium for stainless steel.
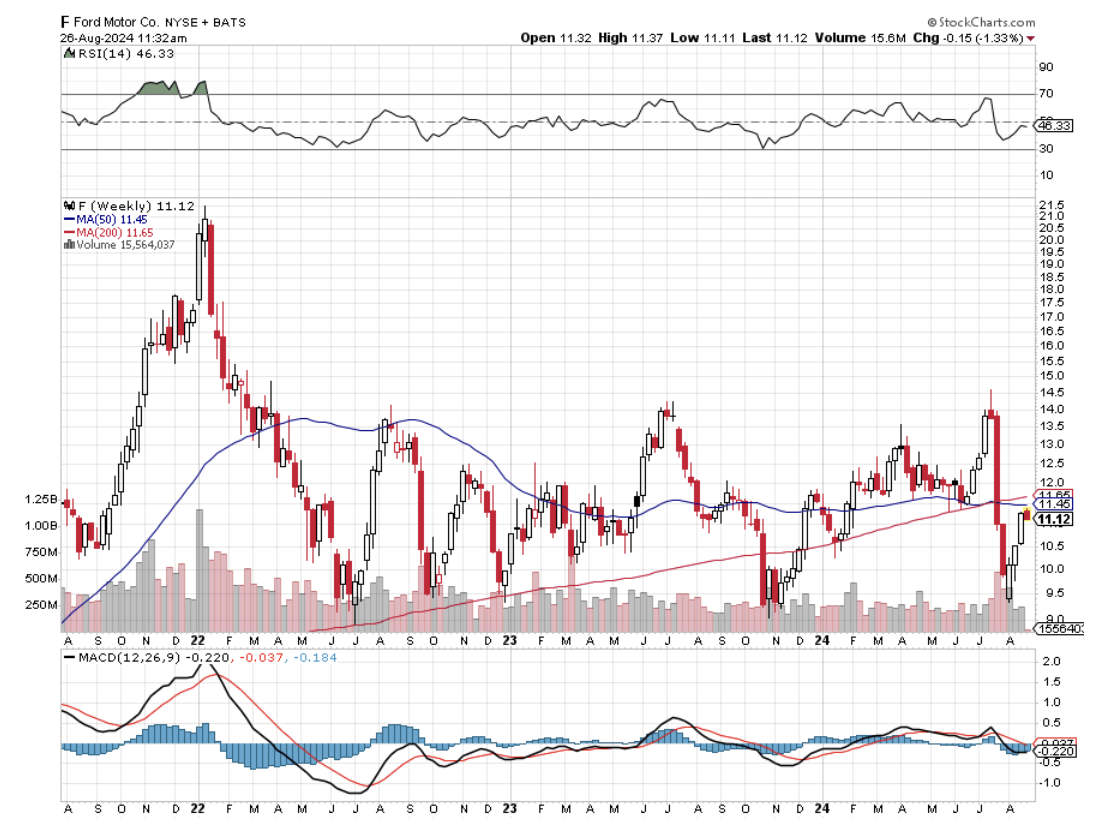
It has a 66% market share. It was a lock on experienced EV engineering talent. It has a near monopoly with a 48,000-strong national charging network which Ford (F) had no choice but to sign up for.
The best competitors can hope for is to peel off experienced employees from Tesla at inflated salaries, and then get sued by Tesla.
Enter the hoards, which I list below, a roll call of the shameless:
Nikola Badger (NKLA) – Has a hydrogen fuel cell power source that hasn’t a hope in hell of ever becoming economic. As I never tire of explaining to investors, while electric power is digital and infinitely scalable, hydrogen is analog and isn’t. Maybe that’s why the stock has been a disaster. Too many unbelievable promises and no actual functioning model. Gravity was their only actual power source. It just announced a recall of its electric trucks because of a coolant leak in the battery that caused fires.
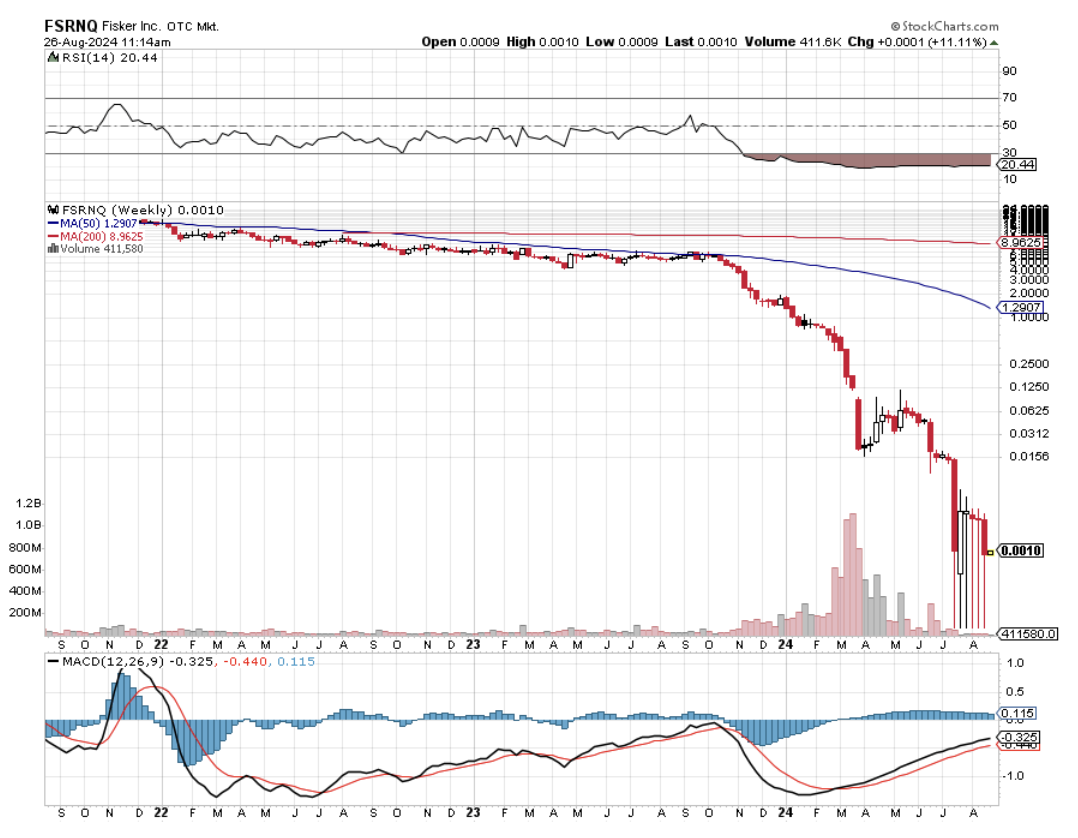
Fisker (F-SRNQ) – If at first, you don’t succeed, why not fail again? This VEHICLE had double the number of parts of a conventional international combustion engine. Its chief claim to fame was that it got a free factory from the government in Joe Biden’s home state and the fact that Justin Bieber drove one. More flailing at the wind. It recently went bankrupt….again.
Aspark Owl – A $3.2 niche supercar with an appeal to maybe three car-collecting Saudi princes.
Bollinger B1 – Is a $125,000 SUV expected from a Michigan startup with only a 200-mile range. Why not pay nearly double the cost of a Tesla Model X and get half the performance?
The Byton M-Byte – Is a $45,000 crossover car from a Chinese start-up. China has actually been building electric cars longer than Tesla, but they have a tendency to break down or catch on fire. Quality and safety problems have until now kept them out of the US, and probably always will.
Genesis Essentia – A Croatian-based start-up with a major investment from South Korea’s Hyundai. It will most likely never get off the drawing board. The last time Croatia built cars was for the Austria-Hungarian Empire during WWI.
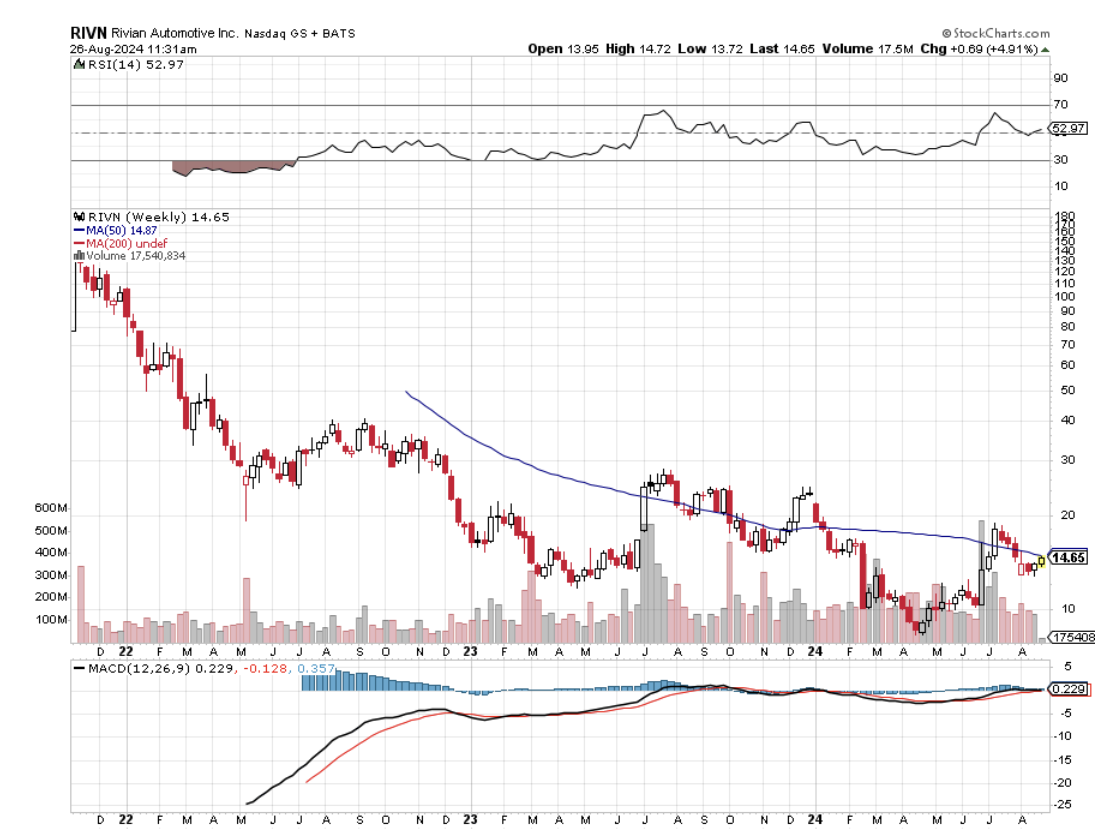
Rivian R1T(RIVN) – A start-up with a reasonably priced truck and up to 400 miles of range that will only make it because they have a 100,000-unit order from the largest shareholder, Amazon (AMZN). It’s perfect for local deliveries. The cars are beautiful and there is a two-year waiting list for the $80,000 list price vehicles. (RIVN) is the only alternative EV maker that will probably make it.
By now, virtually every major car manufacturer has or is about to roll out its entry in the electric car race. I list them below, skipping those that are more than two years out over the horizon. Notice the profusion of the letter “e” in the names. In fact, there are an astonishing 527 EVs either on, or about to hit the market.
They include the Porsche Taycan, Audi eTron, Jaguar I-Pace, Austin Mini Electric, Fiat 500e, Kia Niro EV, BMW i3, Chevy Bolt EV, Hyundai Kona Electric, and the Hyundai Ioniq Electric, Ford F-150 Electric, Ford Mustang Mach-E, and Nissan Ariya.
Not one of these comes even close to the price/performance and battery density of the Tesla cars. Tesla is a decade ahead of the competition and is accelerating its lead. At best, they will sell a few electric cars to those who are intensely loyal to their brands and lose money doing it.
In the meantime, Tesla hasn’t been sitting on its hands. Elon Musk plans to bring out a $25,000 model in two years that will bar entry to the field from any other competitor. It has its own $250,000 supercar, the Tesla Plaid, which will go zero to 60 MPH in 1.9 seconds and has a 600-mile range. The Tesla Cyber Truck at $60,000 has the specs to take on the enormous US pickup market. Did I mention that the company is on the verge of developing technology that will improve battery performance by a staggering 20-fold?
So Tesla is branching out to suck up every profit in every branch of the entire global auto industry.
And this is what most traders, especially the short sellers, got wrong about Tesla. The data is worth more than the car. The miles driven provide a springboard from which the company can offer very high value-added and profitable services, like autonomous driving. Not even Alphabet (GOOGL) can replicate this.
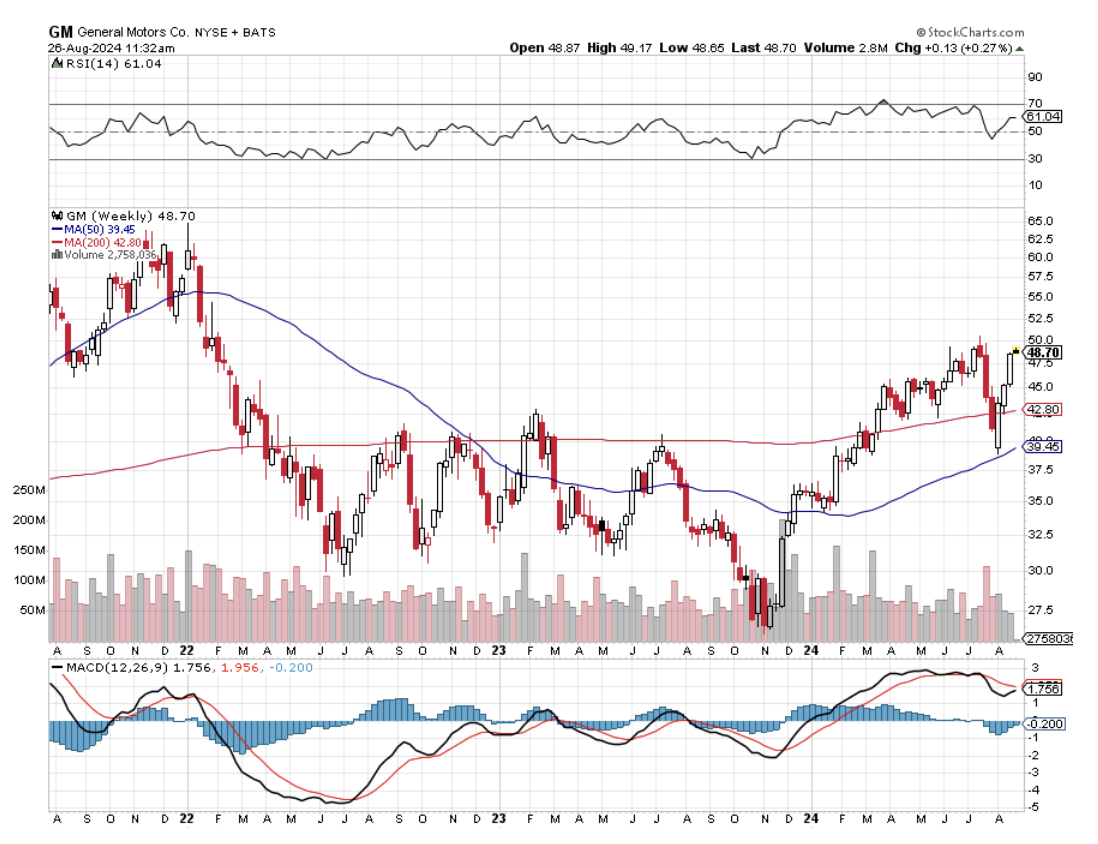
When I bought my first Tesla more than a decade ago, I knew I was betting on the company. The big risk was that General Motors (GM) would step in with their own cheap electric car and drive Tesla out of business.
In the end (GM) did that, but too little, too late. Its Chevy Bolt EV didn’t hit the market until the end of 2016. Today it offers a boring design, lacks autonomous driving, possesses only a 259-mile range for $36,620, and is subject to recall, thanks to recurring battery fires (click here for the link).
The quality is, well, Chevy quality. The company has already announced it will discontinue production.
Tesla is approaching 2 million. It’s too late to close the barn door after the horse has “bolted,” as GM is earning. Over the past decade, Tesla shares were up 180 times at the high. GM shares are nearly unchanged during the greatest bull market of all time.
It is competing against Teslas that are 20 years from the future, are fully autonomous, go to street-autonomous driving next year, and upgrade itself once or twice a month.
Make mine Tesla, please, which will soon become the world’s first trillion-dollar car company. Don’t waste your time or money on the others, either as a driver or investor.
I’ll Go with Tesla
https://www.madhedgefundtrader.com/wp-content/uploads/2018/10/New-Tesla.png455647Mad Hedge Fund Traderhttps://madhedgefundtrader.com/wp-content/uploads/2019/05/cropped-mad-hedge-logo-transparent-192x192_f9578834168ba24df3eb53916a12c882.pngMad Hedge Fund Trader2024-08-27 09:02:542024-08-27 10:14:59Why You Must Avoid All EV Plays Except Tesla
Legal Disclaimer
There is a very high degree of risk involved in trading. Past results are not indicative of future returns. MadHedgeFundTrader.com and all individuals affiliated with this site assume no responsibilities for your trading and investment results. The indicators, strategies, columns, articles and all other features are for educational purposes only and should not be construed as investment advice. Information for futures trading observations are obtained from sources believed to be reliable, but we do not warrant its completeness or accuracy, or warrant any results from the use of the information. Your use of the trading observations is entirely at your own risk and it is your sole responsibility to evaluate the accuracy, completeness and usefulness of the information. You must assess the risk of any trade with your broker and make your own independent decisions regarding any securities mentioned herein. Affiliates of MadHedgeFundTrader.com may have a position or effect transactions in the securities described herein (or options thereon) and/or otherwise employ trading strategies that may be consistent or inconsistent with the provided strategies.