Featured Trade: (WHY THE MARKETS HAVE GONE INSANE THIS YEAR), (FXY), (USO), (SPY), (FXE), (VRX), (AAPL), (A SPECIAL NOTE ON EXERCISED OPTIONS)
CurrencyShares Japanese Yen ETF (FXY) United States Oil (USO) SPDR S&P 500 ETF (SPY) CurrencyShares Euro ETF (FXE) Valeant Pharmaceuticals International, Inc. (VRX) Apple Inc. (AAPL)
A market where both fundamental research and technical analysis are utterly useless and everything goes the opposite of where it should is no place for me.
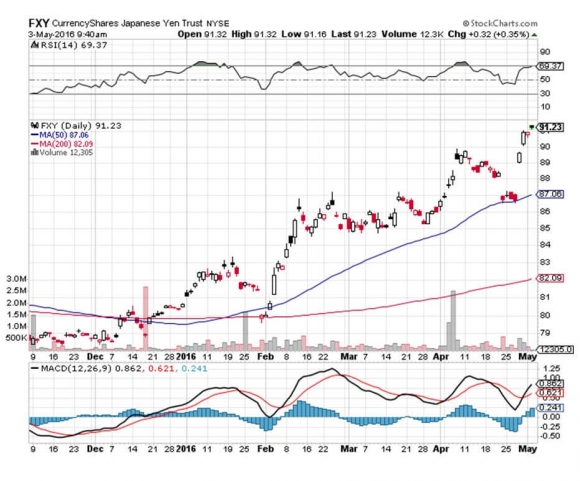
Despite having negative interest rates and the world?s worst fundamentals, the Japanese yen has been skyrocketing since the beginning of February.
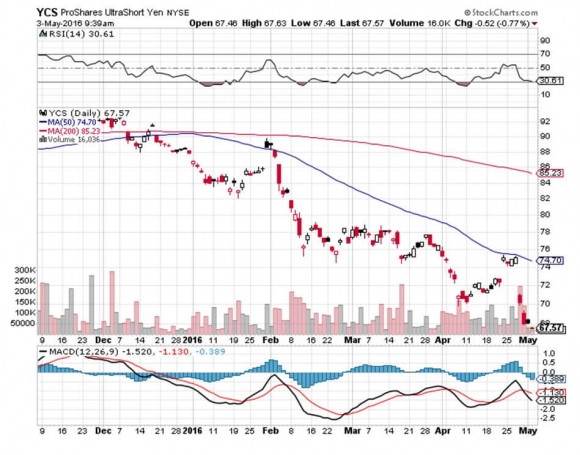
The last time the yen (FXY), (YCS) moved this sharply was when President Richard Nixon took the US off the gold standard in 1972, and currencies floated for the first time. The yen immediately shot up 10%.
I remember it like it was yesterday.
There is something unprecedented going on, not with just the yen right now, but with all assets.? So I am getting out of the way. If I don?t understand what is happening with a position, I drop it like a hot potato.
This could be occurring because Japan?s oil bill has been cut in half over the past year, shaving some $125 billion off it's annual imports. That means less dollar buying and yen selling to settle the trade.
However, in looking for reasons to explain the madness about us I could be too logical and analytical here.
In my travels around the US two weeks ago I discovered what might be a more pressing reason to cause all asset classes to go haywire.
I heard on the grapevine that there are at least a half dozen large hedge funds with tens of billions of dollars in assets each that are going out of business.
Poor performance has led investors to demand redemptions en masse. That means unwinding possibly $100 billion worth of positions.
And every one of these positions was financed by short sales in the Japanese yen. The only way for them to get out of these positions and raise cash is to buy yen, a lot of them, to close those shorts.
If this is the case, it would explain a lot of what is going on in the markets this year. The worst performing asset classes of 2016 have been those where hedge funds were major owners.
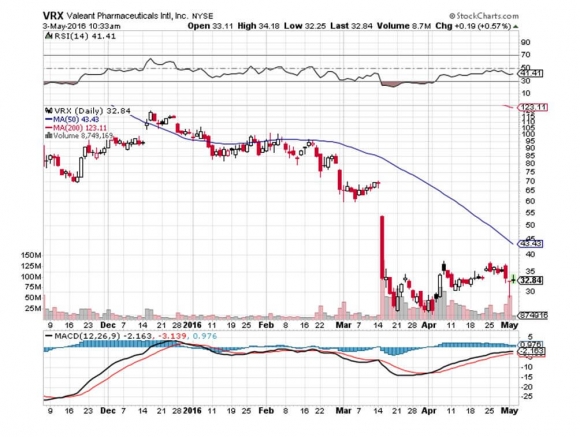
Those would include US banks, short positions in ten-year Treasury bonds (TLT), shorts in the Euro (FXE), and special situations like Variant Pharmaceutical (VRX).
It provides the logic behind the atrocious performance by the big tech FANG stocks in recent weeks. And yes, it gives the backdrop for the enormous over reaction in Apple (AAPL) shares after the Q1 earnings report.
It gets worse.
When markets sniff out that big positions have to be shifted, they suddenly go illiquid. That leads to small amounts of capital triggering exaggerated moves in the underlying prices.
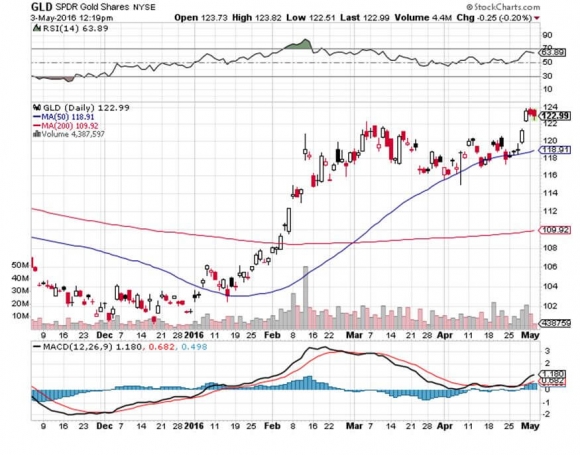
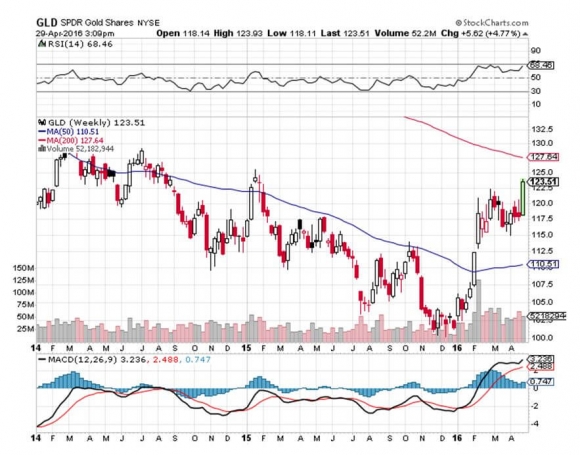
That has given us the enormous volatility in all asset classes we have seen this year. Look at oil, stocks, gold, gold miners, silver, and the yen and they are all delivering the most extreme moves in a half century.
This all makes markets impossible to trade.
Markets aren?t breathing. We are seeing one straight line move after another. Prices aren?t trading within defined channels that traders make their living from. Instead, they are going ballistic.
In other words, the price action of 2016 can be described as liquidity events.
And this is the good news.
All liquidity events burn out. Eventually the positions get liquidated, the investors get their money back, and markets return to normal.
You could blame all this on negative interest rates, which have never occurred before in history. I have never seen the strategist community so clueless before.
You might also ascribe it to the demise of the hedge fund. It seems that whenever industry assets approach $3 trillion in assets, it implodes. The market can accommodate only so much ?smart? money.
Almost all hedge funds accumulated their stellar track records when they were small. Get above $20 billion and they can only generate slightly better than utility type returns. Only a select few friends of mine have been able to keep the numbers coming.
My strategy has always been to break even when it is tough, and coin it when it is easy. This is one of those breakeven times.
This is why my performance has been flat lining just short of an all time high for months.
This too shall pass. When it does, it will be back to racking up double-digit returns, as I have done with this service for the past eight years.
Personally, I have great hopes for the second half of the year, when the presidential election gets out of the way.
Did You Say Two and Twenty?
00DougDhttps://madhedgefundtrader.com/wp-content/uploads/2019/05/cropped-mad-hedge-logo-transparent-192x192_f9578834168ba24df3eb53916a12c882.pngDougD2016-05-04 01:07:332016-05-04 01:07:33Why Markets Have Gone Insane This Year
I received a few emails from readers whose option holdings have already been exercised against them, and have asked me for advice on how best to proceed.
In the last few months, we have enjoyed several positions that have gone deep in the money, earning tidy profits. So, it is important that we tread carefully to get the full benefit. So, here we go.
The options traded on US exchanges and referred to in my Trade Alerts are American style, meaning that they can be exercised at any time by the owner.
This is in contrast to European style options, which can only be exercised on the expiration day.
The call option spreads that I have been recommending for the past year are composed of a deep out-of-the-money long strike price plus a short portion at a near money strike price. ?The combination is known as a vertical bull call spread.
When stocks have high dividends, there is a chance that the near money option you are short gets exercised against you by the owner. This requires you to deliver the stock equivalent of the option you are short, plus any quarterly dividends that are due.
Don?t worry, because your long position perfectly hedges you against this possibility.
You usually get notice of this assignment in an email after the close. You then need to email or call your broker back immediately informing him that you want to exercise your remaining long option position to meet your assigned short position.
This is gift, as it means that you can realize the entire maximum theoretical profit for the position without having to take the risk of running it all the way into expiration. You can either keep the cash, or pile on another short dated option spread position and make even more money.
This should completely close out your position and leave you with a nice profit. This is not an automatic process and requires action on your part!
Assignments are made on a random basis by an exchange computer, and can happen any day. Exercise means the owner of the option that you are short completely loses all of the premium on his call.
Dividends have to be pretty high to make such a move economic, usually at least over 3% on an annual rate. But these days, markets are so efficient that traders, or their machines, will exercise options for a single penny profit.
Surprise assignments create a risk for option spread owners in a couple of ways. If you don?t check your email every day after the close, you might not be aware that you have been assigned.
Alternatively, such emails sometimes get lost, or hung up in local servers or spam filters, which occasionally happens to readers of my own letter.
Then, you are left with the long side deep out-of-the-money call alone, which will have a substantially higher margin requirement. This is equivalent to going outright long the stock in large size.
This is a totally unhedged position now, and suddenly, you are playing a completely different game. If the stock then rises, you could be in for a windfall profit.
But if it falls, you could take a big hit. Better to completely avoid this situation at all cost and not take the chance. You are probably not set up to do this type of trading.
If you don?t have the cash in your account to cover this, you could get a margin call. If you ignore this call as well, your broker will close out your position at market without your permission.
It could produce some disconcerting communications from your broker. They generally hate issuing margin calls, and could well close your account if it is too small to bother with, as they create regulatory issues.
In order to get belt and braces coverage on this issue, it is best to call your brokers and find out exactly what their assignment policies and procedures are.
Believe it or not, some are still in the Stone Age, and have yet to automate the assignment process or give notice by email. An ounce of prevention could be worth a pound of cure here.
Consider all this a cost of doing business, or a frictional execution cost. In-the-money options are still a great strategy. But you should be aware of all the ins and outs to get the most benefit.
https://www.madhedgefundtrader.com/wp-content/uploads/2014/05/John-Thomas4.jpg339309Mad Hedge Fund Traderhttps://madhedgefundtrader.com/wp-content/uploads/2019/05/cropped-mad-hedge-logo-transparent-192x192_f9578834168ba24df3eb53916a12c882.pngMad Hedge Fund Trader2016-05-04 01:06:132016-05-04 01:06:13A Special Note on Exercised Options
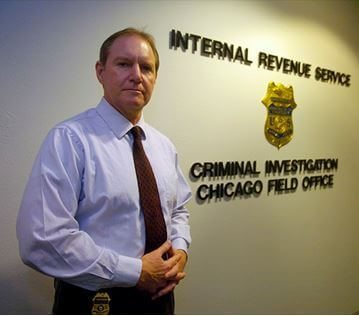
I knew the letter from the IRS sitting in my mail box was bad news just from the color of the paper.
It was not light green, the color of a refund check from the United States Treasury. Instead, it was white, warning that it contained some sort of demand, audit notice, or threatened legal action.
In fact, it was far worse than that.
In the most stilted, bureaucratic language possible, I was informed that my $100,000 tax refund for 2015 had been paid out to someone else.
Another party using my name and social security number, but a different address, had already filed a 2015 return.
In order for me to get my money back I would have to file a new return and include hard copies of every single piece of supporting documentation. It was in effect a full paper audit. Then I would have to wait 60 days.
This was three months ago.
I informed my accountant immediately. I heard him shout across the room to his partner, ?Hey, I?ve got another one.?
He told me that half of his clients had had their refund checks stolen this year, and as a result, the IRS was now demanding automatic audits on all refund requests into four figures or more.
It gets worse. Budget cuts at the despised government agency means that huge delays are occurring in almost all interactions. Even routine requests can sit on a bureaucrat?s desk for two years. The number of standard audits has fallen substantially.
The ones that take place are just a quick pass over, often conducted by mail, rather than the in-person, no stone unturned drill downs of the past.
Furthermore, the government didn?t have the money to pay for the latest upgrade of QuickBooks Pro.
This means it is unable to use this online accounting service?s spreadsheets during audits when the taxpayer?s accountant has upgraded, greatly increasing the time required for each audit while decreasing its effectiveness.
As a result, QuickBooks is seeing the fastest and most widespread adoption of its latest software version in history.
You can?t make this stuff up.
I asked my accountant how long it would really take for me to collect my 2015 refund.? Better count on a year,? he said.
Then the news flash came out that hackers had stolen the tax returns of 100,000 individuals, including their personal information. I was clearly one of those victims.
Not only did the crooks discover my name and social security number, they also knew that my high school team name was the ?Apaches?, my first car was a Volkswagen, and that I was married in Tokyo. I bet they know my inside leg measurement as well (I?m not telling!).
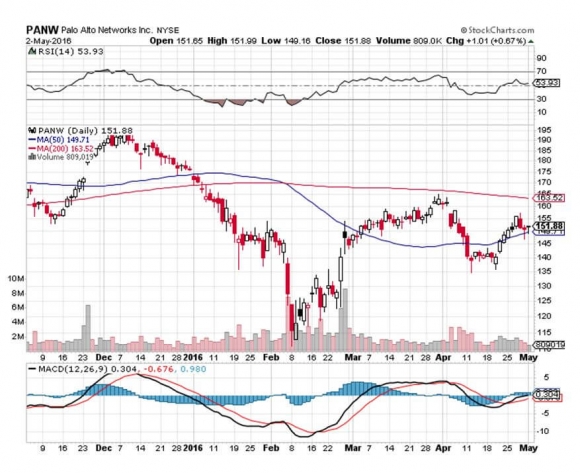
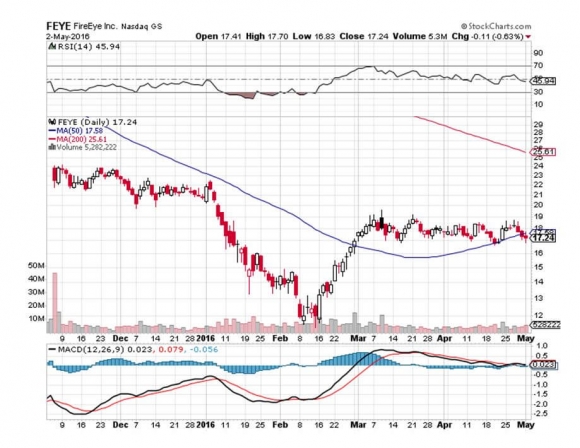
It all reminds me that it is once again time to revisit Palo Alto Networks (PANW) and Fireye (FEYE). I have been recommending these two cyber security names for the past three years, issuing Trade Alerts on each opportunistic dip.
The near destruction of Sony (SNE) by North Korean hackers has certainly put the fear of God into corporate America.
Apparently, they have no sense of humor whatsoever north of the 38th parallel. I saw The Interview the other day on a plane, the film making fun of Supreme Leader Kim Jong-un that so pissed them off, and it totally sucked.
As a result, there is a generational upgrade in cyber security underway, with many potential targets boosting spending by multiples.
It?s not often that I get a stock recommendation from an army general. That is exactly what happened the other day when I was speaking to a three star about the long-term implications of the Iran peace deal.
He argued persuasively that the world will probably never again see large-scale armies fielded by major industrial nations. Wars of the future will be fought online, as they have been silently and invisibly over the past 15 years.
All of those trillions of dollars spent on big ticket, heavy metal weapons systems are pure pork designed by politicians to buy voters in marginal swing states.
The money would be far better spent where it is most needed, on the cyber warfare front. Needless to say, my friend shall remain anonymous.
The problem is that when wars become cheaper, you fight more of them, as is the case with online combat. Cyber wars are now happening every day, all the time, 24/7.
You probably don?t know this, but during the Bush administration, the Chinese military downloaded the entire contents of the Pentagon?s mainframe computers at least seven times.
This was a neat trick because these computers were in stand alone, siloed, electromagnetically shielded facilities not connected to the internet in any way.
In the process, they obtained the designs of all of our most advanced weapons systems, including our best nukes. What have they done with this top-secret information?
Absolutely nothing.
Like many in senior levels of the US military, the Chinese have concluded that these weapons are a useless waste of valuable resources. Far better value for the money are more hackers, coders, and servers, which the Chinese have pursued with a vengeance.
You have seen this in the substantial tightening up of the Chinese Internet through the deployment of the Great Firewall, which blocks local access to most foreign websites.
Some Mad Hedge Fund Trader subscribers in the Middle Kingdom have told me they can no longer access their US based online brokerage accounts, which are blocked by mainland ?porn? filters.
Try sending an email to someone in the middle Kingdom with a Gmail address. It is almost impossible. This is why Google (GOOG) closed their offices there years ago.
As a member of the Joint Chiefs of Staff recently told me, ?The greatest threat to national defense is wasting money on national defense.?
Although my brass-hatted friend didn?t mention the company by name, the implication is that I need to go out and buy Palo Alto Networks (PANW) right now.
Palo Alto Networks, Inc. is an American network security company based in Santa Clara, California just across the water from my Bay area office.
The company?s core products are advanced firewalls designed to provide network security, visibility and granular control of network activity based on application, user, and content identification.
Palo Alto Networks competes in the unified threat management and network security industry against Cisco (CSCO), FireEye (FEYE), Fortinet (FTNT), Check Point (CHKP), Juniper Networks (JNPR), and Cyberoam, among others.
The really interesting thing about this industry is that there are no losers. That?s because companies are taking a layered approach to cyber security, parceling out contracts to many of the leading firms at once, looking to hedge their bets.
To say that top management has no idea what these products really do would be a huge understatement. Therefore, they buy all of them.
This makes a basket approach to the industry more feasible than usual.
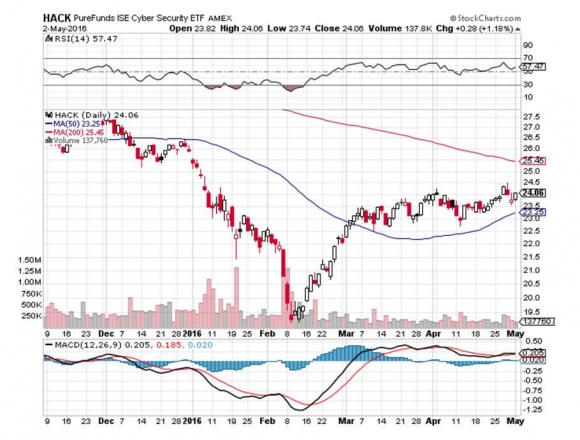
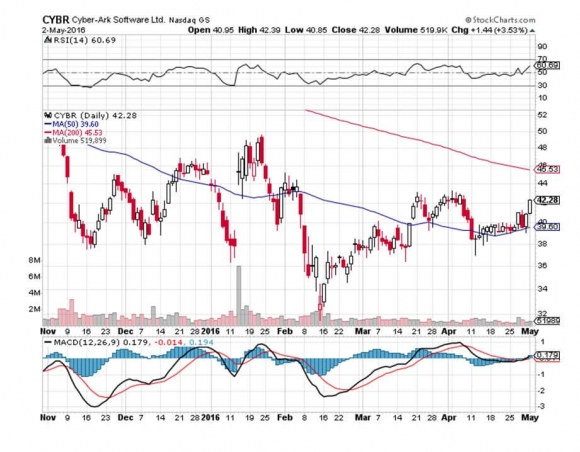
You can do this through buying the $746 million capitalized PureFunds ISE Cyber Security ETF (HACK), which boasts CyberArk Software (CYBR), Infoblox (BLOX), and FireEye (FEYE) as its three largest positions. (HACK) has been a hedge fund favorite since the Sony attack.
https://www.madhedgefundtrader.com/wp-content/uploads/2015/05/IRS-Investigator.jpg316359Mad Hedge Fund Traderhttps://madhedgefundtrader.com/wp-content/uploads/2019/05/cropped-mad-hedge-logo-transparent-192x192_f9578834168ba24df3eb53916a12c882.pngMad Hedge Fund Trader2016-05-03 01:07:402016-05-03 01:07:40The Letter from the IRS You Should Dread
"In Italy, for 30 years under the Borgias, they had warfare, terror, murder and bloodshed, but they produced Michelangelo, Leonardo da Vinci and the Renaissance. In Switzerland they had brotherly love, they had 500 years of democracy and peace - and what did that produce? The cuckoo clock,? said the filmmaker, Orson Wells.
https://www.madhedgefundtrader.com/wp-content/uploads/2014/07/Michelangelos-David.jpg287238Mad Hedge Fund Traderhttps://madhedgefundtrader.com/wp-content/uploads/2019/05/cropped-mad-hedge-logo-transparent-192x192_f9578834168ba24df3eb53916a12c882.pngMad Hedge Fund Trader2016-05-03 01:05:252016-05-03 01:05:25May 3, 2016 - Quote of the Day
Down, then up, then up some more. That?s all you need to know.
The stock market will mirror the economy with a three-month lag, as it always does.
That calls for a 10% correction in stocks from the recent $2100 peak going into the summer, then a monster rally to new highs going into the end of the year.
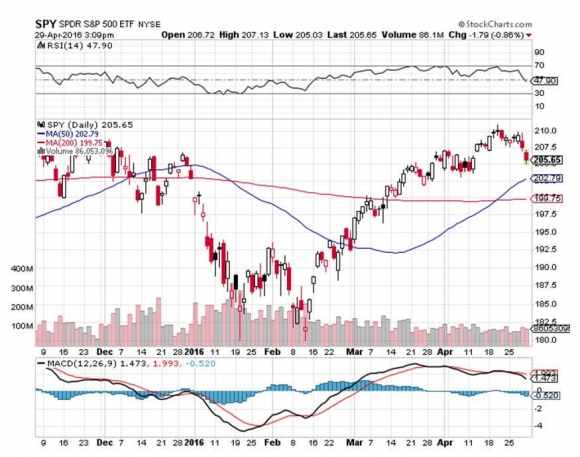
Certainly the 200-day moving average in the (SPY) at $199.75 is crying out for attention. Below that you can target the previous breakout level of $192.50, and that nearly gets you to your 10% hickey.
That means you should be buying gold right about now to hedge your existing long positions in equities.
Remember ?Sell in May and Go Away?? I have bad news for you. It?s May 2.
Why should stocks sell off right now? There are a plethora of reasons.
We are just entering the worst six months of the year to own equities. Buy stocks every May and sell them every October and your return on equities for the past 60 years has been zero, despite the indexes going up several thousand percent.
Stocks at a 19X price earnings multiple are at the top end of its historic 9-24X range. Buy high and sell higher? I?ll leave that one to you.
As traders entertain a June rate hike by the Fed, the dollar (UUP) is about to strengthen. This is always terrible news for large US multinationals.
Several large hedge funds are going bust, dumping large amounts of stock on the market. That?s why the Japanese yen has been so strong this week. They?re covering their shorts.
A Q1 mini recession has become a regular feature of the US economy, the aftermath of maxed out credit cards during the holiday shopping season and delayed starts to New Year corporate capital spending programs.
The economy then bounces back hard for the remaining three quarters, but the data won?t show this definitively for 3-6 more months. That?s sets up the annual cycle for the movement of all asset classes which we have learned to both love and hate.
And while QE is gone and dead in the US, it continues full speed ahead in Europe, Japan, and China, which account for 35% of the planet?s GDP.
Therefore, the American stocks that look expensive now at a 19X price earnings multiple become fairly priced in three months, and a bargain in six.
How far in advance do you want to front run the attractive valuations?
In addition, you have to consider the harsh reality that there is absolutely nothing else to buy. US 30 year Treasury bonds with a 2.69% yield? German 10 year bunds at 0.27%? Japanese government bonds at -0.11%. Not a lot to choose from.
How about collectable French postage stamps? Beanie babies anyone?
The fact is that EQUITIES HAVE BECOME THE HIGH YIELD INSTRUMENTS OF OUR DAY.
You can get 2.10% for the S&P 500, and much more for damaged names like AT&T (T)(5.04%), Altria Group (MO)(3.68%), Chevron (CVX)(4.18%), and Verizon Communications (VZ)(4.52%).
The world is still on a giant paper chase, as it has been for the last seven years. The only difference now is that we are shifting from fixed income to equity script.
So when we get our 10% summer correction, you have to jump in with both hands and buy as much stock as you can.
This year is special in that we are likely to get a presidential election that is equity positive. We may even have a shot at an end of congressional deadlock, which would open the fiscal spending floodgates.
I?ll let you guess which result delivers that.
Stocks are almost certainly flying to new all times highs going into the end of 2016. I?m looking for at least a $220 print, a gain of 6.8% from here. If you cash out now, you?ll be kicking yourself around the Christmas tree.
Newbie traders working without the benefit of the Mad Hedge Fund Trader will end up selling every bottom, buying every top, and then wonder where all their money went.
If you are an elderly retiree, or just a plain wimp, and don?t want to trade these big moves, just take a long cruise. You will find share prices pleasantly higher at the end of 2016, and wonder what all the fuss was about.
https://www.madhedgefundtrader.com/wp-content/uploads/2016/05/John-in-Owners-Suite.jpg404398DougDhttps://madhedgefundtrader.com/wp-content/uploads/2019/05/cropped-mad-hedge-logo-transparent-192x192_f9578834168ba24df3eb53916a12c882.pngDougD2016-05-02 01:08:052016-05-02 01:08:05How the Rest of 2016 Will Play Out in the Markets
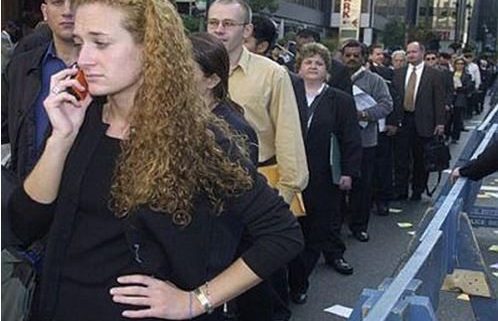
Those of you counting on getting your old union assembly line job back in Detroit can forget it.
The eight year forecast published by the Bureau of Labor Statistics shows that 4.19 million jobs will be gained in the US in professional and business services, followed by 4 million health care and social assistance jobs, while 1.2 million will be lost in manufacturing.
This is great news for website designers, internet entrepreneurs, registered nurses, and masseuses in California, but grim tidings for traditional metal bashers in the rust belt manufacturing states like Michigan, Indiana and Ohio.
I?m so old now that I am no longer asked for a driver?s license to get into a nightclub. Instead, they ask for a carbon dating.
The real challenge for we aged career advisors is that probably half of these new service jobs haven?t even been invented yet, and if they can be described, it is only in a cheesy science fiction paperback with a half-dressed blond on the front cover.
After all, who heard of a webmaster, a cell phone contract sales person or a blogger 40 years ago?
Where are all these jobs going? You guessed it, China, which by my calculation, has imported 25 million jobs from the US over the past decade.
You can also blame other lower waged, upstream manufacturing countries like Vietnam, where the Middle Kingdom is increasingly subcontracting its own offshoring.
These forecasts may be optimistic, because they assume that Americans can continue to claw their way up the value chain in the global economy and not get stuck along the way, as the Japanese did in the nineties.
The US desperately needs no less than 27 million new jobs to soak up natural population and immigration growth and get us back to a traditional 5% unemployment rate. The only way that is going to happen is for America to invent something new and big, and fast.
Personal computers achieved this during the eighties, and the internet did the trick in the nineties. The fact that we?ve done squat since 2000 but create a giant paper chase of subprime loans and derivatives explains why job growth since then has been zero, real wage growth has been negative, and American standards of living are falling.
While the current crop of politicians extol the virtues of education, the reality is that we are dumbing down our public education system. How do we invent the next ?new? thing, while shrinking the University of California?s budget by 25% two years in a row?
If my local high school can?t afford new computers, how is it going to feed Silicon Valley with computer literate work force? The US has a ?Michael Jackson? economy. It?s still living like a rock star, but hasn?t had a hit in 20 years.
China can have all the $20 a day jobs it wants. But if it accelerates its move up the value chain, as it clearly aspires to do, then America is in for even harder times.
I?ll be hoping for the best, but preparing for the worst. How do you say ?unemployment check? in Mandarin?
Is This Your Future?
https://www.madhedgefundtrader.com/wp-content/uploads/2013/09/Line-Up-Queue1.jpg363498Mad Hedge Fund Traderhttps://madhedgefundtrader.com/wp-content/uploads/2019/05/cropped-mad-hedge-logo-transparent-192x192_f9578834168ba24df3eb53916a12c882.pngMad Hedge Fund Trader2016-05-02 01:07:562016-05-02 01:07:56Kiss That Union Job Goodbye
Legal Disclaimer
There is a very high degree of risk involved in trading. Past results are not indicative of future returns. MadHedgeFundTrader.com and all individuals affiliated with this site assume no responsibilities for your trading and investment results. The indicators, strategies, columns, articles and all other features are for educational purposes only and should not be construed as investment advice. Information for futures trading observations are obtained from sources believed to be reliable, but we do not warrant its completeness or accuracy, or warrant any results from the use of the information. Your use of the trading observations is entirely at your own risk and it is your sole responsibility to evaluate the accuracy, completeness and usefulness of the information. You must assess the risk of any trade with your broker and make your own independent decisions regarding any securities mentioned herein. Affiliates of MadHedgeFundTrader.com may have a position or effect transactions in the securities described herein (or options thereon) and/or otherwise employ trading strategies that may be consistent or inconsistent with the provided strategies.