Featured Trades: (BONDS-WHERE DO WE GO FROM HERE?), (TLT), (TBT)
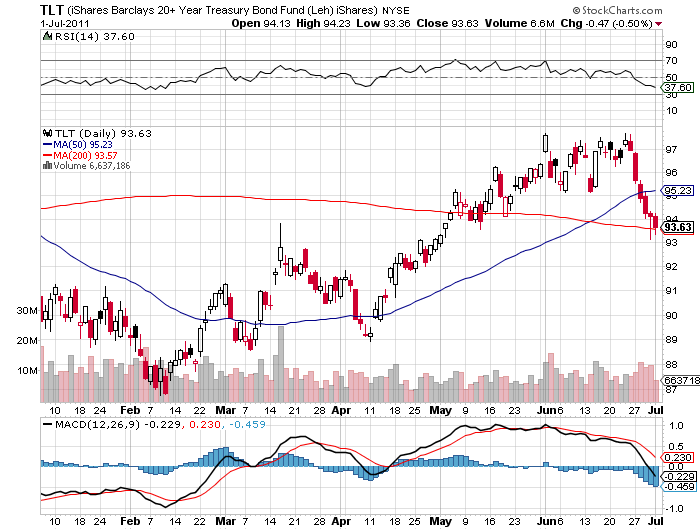
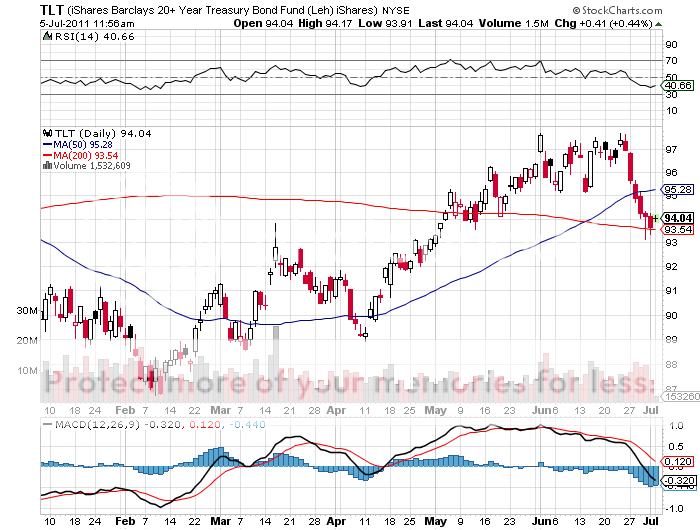
1) Bonds-Where Do We Go From Here? There is nothing like coming back from vacation and seeing all your shorts go to zero. Well, they almost did. My bet that bond prices would fall going into the end of QE2 paid off big time, with the (TLT) September $103 calls that I sold at 74 cents now trading at a lowly, almost cowering 20 cents.
It is always nice to get an assist, and I certainly got one on this trade with a warning from Standard and Poors about how dire America's debt prospects really are. These were not new estimates, but they certainly set the cat among the bond holding pigeons, especially when cast against a backdrop of Greek unrest. Like, this could be us in five years?
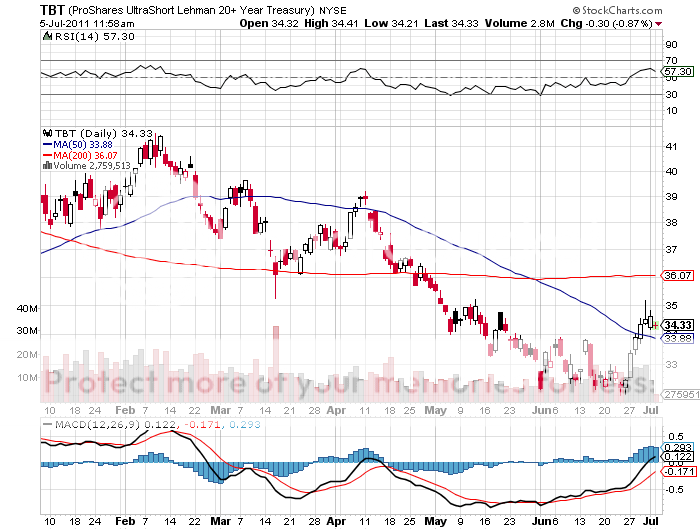
Since we are all only as good as our last trades, the question arises of what to do next. Unfortunately, the pickings out there are pretty thin. I think we are trapped in a narrowing range that in terms of the ten year Treasury yield now looks to be 2.85%-4.00%, with the last tick appearing on my screen at 3.15%. The (TLT) dropped a dramatic 5 points in a week, while the double short ETF (TBT) soared by an awesome 10%. So whatever you do, don't short bonds right here.
Wait a couple weeks, and you should get another chance to put this short on. The current round of 'RISK OFF' should exhaust itself by mid to late July, once Q2 earnings are out. Then we will be looking into the abyss of the August 2 debt crisis.
I expect a deal to be struck, but only after both parties have milked this issue for maximum political advantage, with negotiations going? on to the last second of the last minute of the last hour before midnight. The fear this will generate, especially among foreign investors, should be enough to drive yields back to the high 2.90% area.
I am not buying the Armageddon predictions that you hear daily on the tube. Inflation is not hitting anytime soon, driving ten year yields to 5%-6%. I'm sorry, but 2% GDP growth just doesn't get you there. Nor are we headed towards a hyper deflationary bond bubble that takes yields to 2%. We are growing, but not just very much, and certainly without any new hires. We may have to wait until well into next year for that scenario to unfold.
I know this sounds pretty boring, but that is what the economic data are telling us. At least until it changes.
-
-

Will Someone Please Wake Me Up When Volatility Returns?