I am one of those cheapskates who buy Christmas ornaments by the bucket load from Costco in January for ten cents on the dollar because my 11-month theoretical return on capital comes close to 1,000%.
I also like buying flood insurance in the middle of the summer drought, when the forecast in California is for endless days of sunshine. That is what we had at the end of July when the (VIX) was plumbing the depths of $12.
Get this one right, and the profits you can realize are spectacular.
It gets better.
If the bottom in volatility exactly coincides with the peak in the stock market that it measures, volatility could be headed back up to the 30% handle, and maybe more.
I double dare you to look at the charts below and tell me this isn’t happening.
Watch carefully for other confirming trends to affirm this trade is unfolding. Those would include a strong dollar, and a weak Japanese yen, Euro, and rising fixed-income instruments of any kind.
Notice that every one of these is happening this week!
Reversion to the mean, anyone?
You may know of this from the many clueless talking heads, beginners, and newbies who call (VIX) the “Fear Index”.
For those of you who have a PhD in higher mathematics from MIT, the (VIX) is simply a weighted blend of prices for a range of option contracts on the S&P 500 index (SPX).
The formula uses a kernel-smoothed estimator that takes as inputs the current market prices for all out-of-the-money calls and puts for the front-month and second-month expirations.
The (VIX) is the square root of the par variance swap rate for a 30-day term initiated today. To get into the pricing of the individual options, please go look up your handy dandy and ever-useful Black-Scholes equation.
You will recall that this is the equation that derives from the Brownian motion of heat transference in metals. Got all that?
For the rest of you who do not possess a PhD in higher mathematics from MIT, and maybe scored a 450 on your math SAT test, or who don’t know what an SAT test is, this is what you need to know.
When the market goes up, the (VIX goes down. When the market goes down, the (VIX) goes up. Period. End of story. Class dismissed.
The (VIX) is expressed in terms of the annualized monthly movement in the S&P 500 (SPX) which, with the (VIX) today at $10, is at $72.54.
So for example, a (VIX) of $10 means that the market expects the index to move 2.89%, or $72.54 S&P 500 points, over the next 30 days.
You get this by calculating $10/3.46 = 2.89%, where the square root of 12 months is 3.46.
The volatility index doesn’t really care which way the stock index moves. If the S&P 500 moves more than the projected 2.89% in ANY direction, you make a profit on your long (VIX) positions.
I am going into this detail because I always get a million questions whenever I raise this subject with volatility-deprived investors.
It gets better.
Futures contracts began trading on the (VIX) in 2004, and options on the futures since 2006.
Since then, these instruments have provided a vital means through which hedge funds control risk in their portfolios, thus providing the “hedge” in hedge fund.
https://www.madhedgefundtrader.com/wp-content/uploads/2017/09/john-pogo-e1506632512231.jpg467250Mad Hedge Fund Traderhttps://madhedgefundtrader.com/wp-content/uploads/2019/05/cropped-mad-hedge-logo-transparent-192x192_f9578834168ba24df3eb53916a12c882.pngMad Hedge Fund Trader2025-04-11 09:02:142025-04-11 10:10:21The ABCs of the VIX
I often get asked why I am still working after 55 years in the stock market.
With five customers calling me this morning to thank me for saving their retirement funds, you might understand why.
It is now clear that in retrospect and with the wisdom of 20/20 hindsight, corporate America flipped the switch on the economy, shutting it off and sending all hiring and investment to a grinding halt. They wanted to wait and see how business would fare under the new Trump regime. We didn’t see this in the data until February.
That’s when I started shouting from the rooftops that we were already in a recession and bear market and that you should sell everything, especially big tech stocks. If you waited until August for the data to confirm this, the move-down will be over.
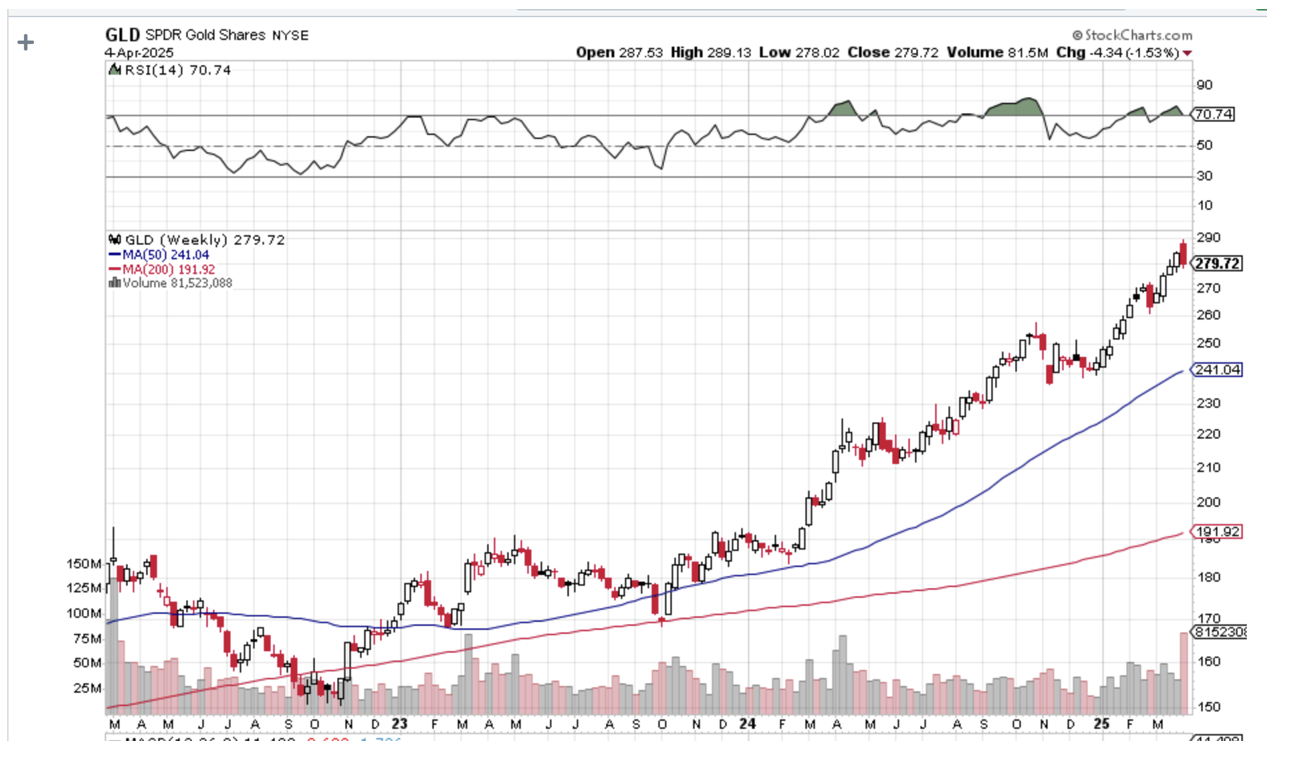
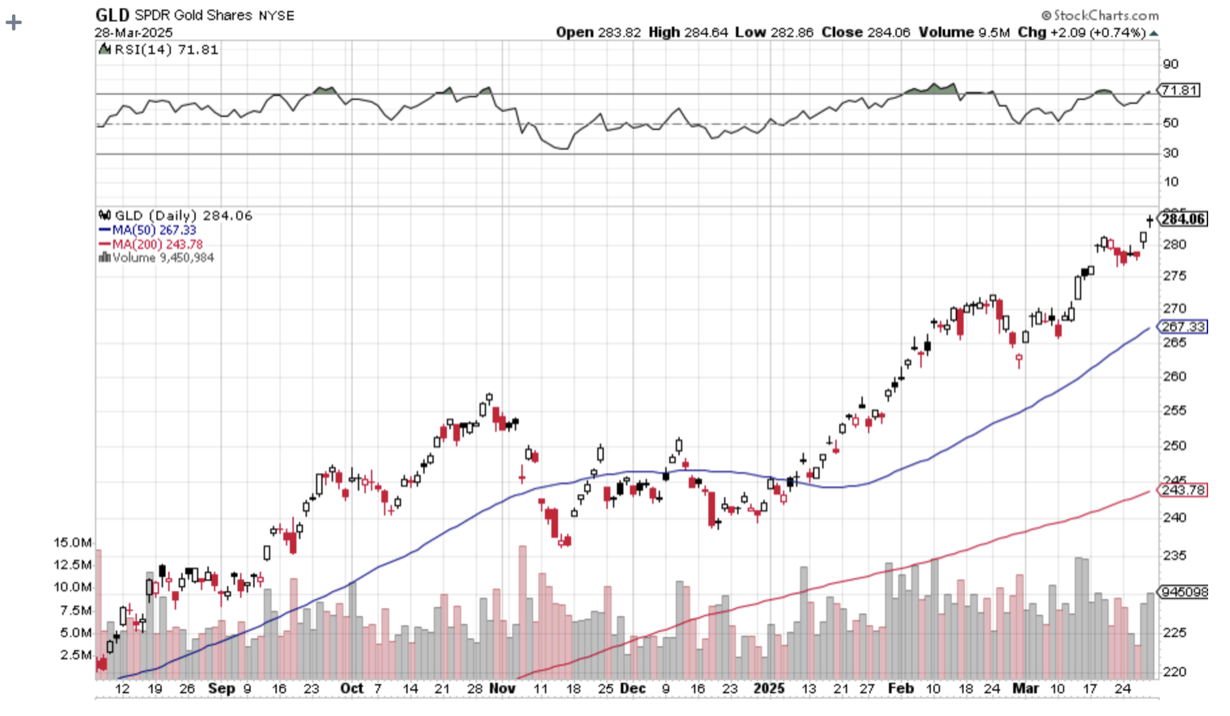
T-bills, bonds, and gold were the only safe places to park your money. Gold just delivered the best quarter since 1986, up 19%. That month I took my short positions up to 80%, a 17-year high for the Mad Hedge Fund Trader.
Those now look like very wise decisions, with markets suffering their worst two-day crash since 1987, and the bad news has only just started. Option implied volatiles are at five-year highs, and risk positions everywhere are going to hell in a handbasket. Tariff-driven inflation could spike to 10% by next year.
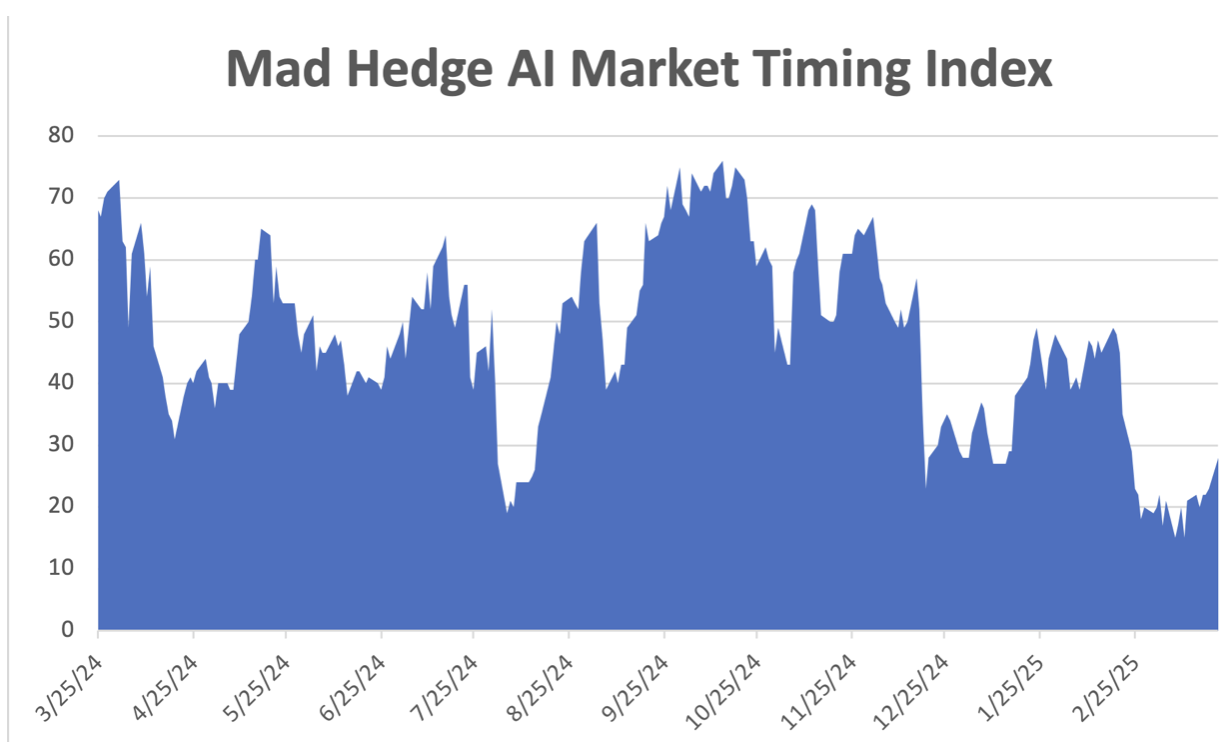
Even securities unrelated to stocks, like junk bonds (JNK), down $6 points in two weeks,were getting thrown out with the bathwater because of margin calls. The Mad Hedge AI Market Timing Index is at a five-year low at a reading of 4. Q1 saw the fastest reversal in market momentum in 38 years.
I even heard an expression new to me: “Hate selling”. That refers to a global disengagement from investment in the US and the return of capital to better-performing foreign markets and currencies. Trump is attacking their countries.
The global nature of the selloff is most disturbing, with every country seeking its stock markets rolling over all at once.That presages a global recession.
Analysts across Wall Street are tearing up their playbooks for 2025 and setting new downside targets as fast as they can like I did in February.
Instead of the $500 billion tax increase I expected tariffs would deliver, we got $1 trillion. The worst forward guidance from corporations since the Great Depression starts next week. Retaliatory 34% tariffs from China hit today, and those from Europe will come soon. Trump has promised retaliation.
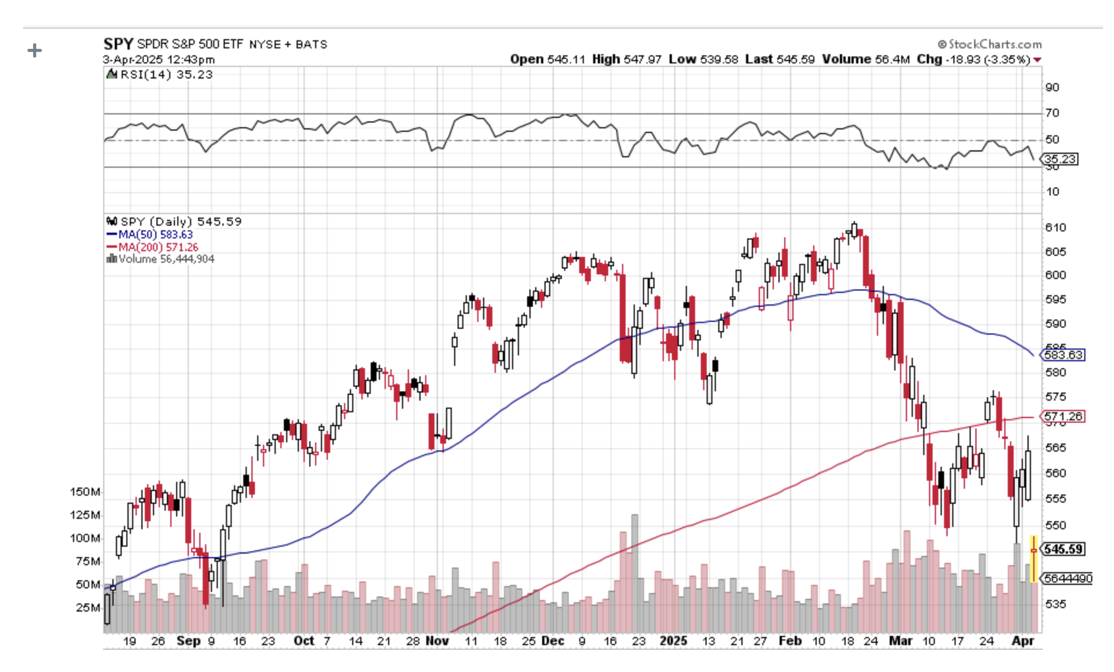
That forces me to adjust my downside target for the S&P 500 from $5,000 to $4,500. That is a 26.6% selloff from the February top, or 11% more downside from here. How do we get there? Simply assign the 2019 earnings multiple low of 18 and multiply it by S&P 500 earnings pared back by the trade war from$270 to $250. That gets you to $4,500 in months, if not weeks (18 X $250).
No help is that we entered this crash with valuation highs that have only been seen in 1999 and 1929. The higher the high, the lower the lows that follow.
In fact, there is no bottom to this market.
This forecast is based on historical data and assumes that markets are rational and orderly. But as we all know too well, markets can be anything but rational and orderly once the panic selling and margin calls begin.
Of course, a tweet on social media about negotiations could trigger a massive short-covering rally at any time. In reality, the stock market has been negotiating on behalf of Europe and China quite successfully. The further stocks fall, the greater the pressure on Trump to fold.
Tariffs advertised at the White House announcement left our trading partners scratching their heads because they were completely bogus and were a large multiple of the true tariffs. The person who came up with these cockamamie figures remains anonymous, as they used an arbitrary, obscure formula made up from scratch that had never been seen before by the economic community.
For example, the White House claimed the tariff charged by Vietnam was 90%, when in fact it is 5.5%. The claimed tariff for Taiwan was 64%, while the actual one is 1.7%.
The White House numbers supposedly included a factor for non-tariff barriers. I happen to be an expert in these because Japan was notorious for its non-tariff barriers in the 1970s. For example, import documents have to be submitted in Japanese. Hey, I speak Japanese. All they had to do was ask me! How did they quantify this?
That’s anyone’s guess.
The saddest thing is that this new bear market was not caused by surprise external events as in all others in the past century, but is totally voluntary and self-inflicted. It is actually caused by the false assumptions of conspiracy theorists. But these days, it is the conspiracy theorists who have the upper hand.
Why do we suddenly need an emergency jobs program now, when the country is operating at full employment? Many of those skills needed to man the jobs Trump is trying to take back from China, such as in textiles, clothing, shoes, and toys,haven’t existed in the US for generations. Nor does the machinery.
Some three-quarters of the US trade deficits are offset by a monster surplus in services run up by the likes of Meta (META), Alphabet (GOOGL), Microsoft (MSFT), Oracle (ORCL), and Salesforce (CRM). And if you didn’t already know, the future is in services, not in manufacturing.
I don’t know about you, but I don’t lose a lot of sleep at night worrying about our trade deficit with Vietnam. Trump took what was a great economy and destroyed it in an effort to remake it in his own image. Is this crazy experiment with 20% of your retirement funds cost so far? How about 50%?
No wonder the Republican Party is panicking! Recent elections have shown unprecedented swings by voters away from them, fearful of their 401Ks.
How many factories will return to the US as a result of the tariffs? My bet is none. There will be many announcements but no actual action, as with the first Trump administration.
Labor costs are $5 an hour in Mexico and China, versus $25-$75 an hour in America. We keep the high-paying, high-value-added jobs and send the cheap, dangerous, highly energy-consuming, and high-polluting ones abroad. Foreigners get rich and earn the money to buy our services.
Their government then takes the excess funds and buys US Treasury bonds (China still has $760 billion worth) and finances our deficits with ever-depreciating paper. It is one big mutually enriching cycle. That’s why globalization has worked for 85 years.
The best thing for companies is to now sit on their hands and do nothing and wait out the next four years until a future administration eliminates the tariffs. That’s much cheaper than spending $20 billion on a new factory here which might become useless in four years.
What is a stock market worth that is walled off from the rest of the world that's in recession? Maybe half or less the February peak value, but I’m only guessing.
It might be much worse.
Keep all cash positions in 90-day T-bills and keep all hedges of existing equity portfolios also at a maximum until the stock market can find its own bottom. I’d rather miss the first 10% move and buy on the way up than catch a falling knife right now.
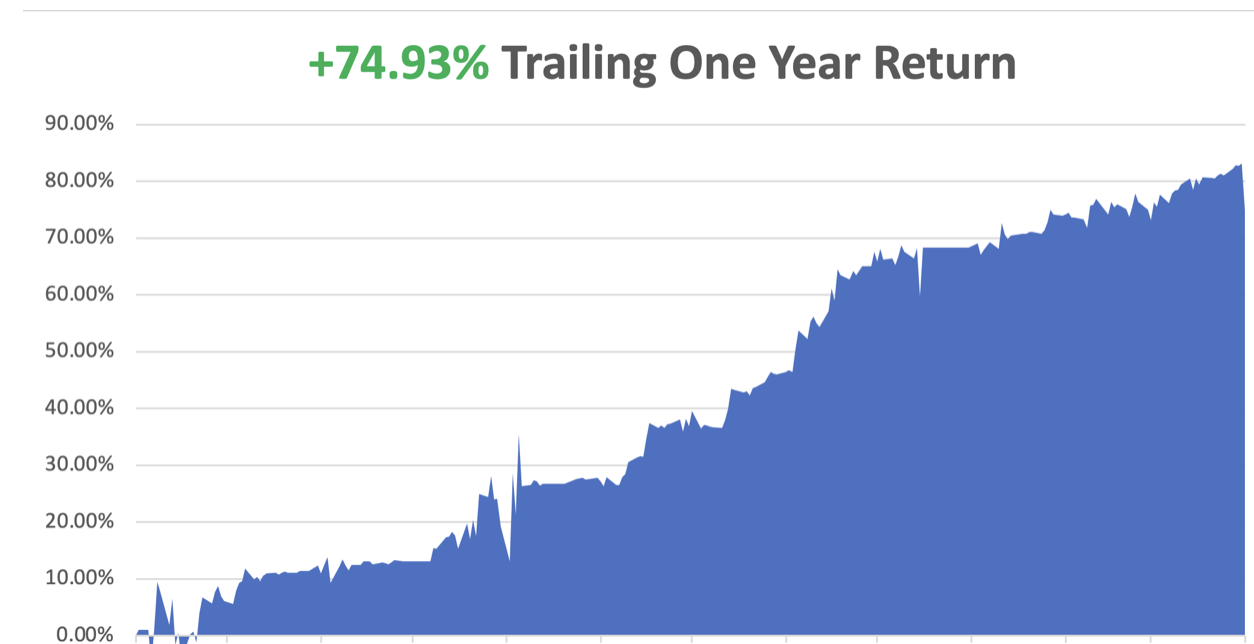
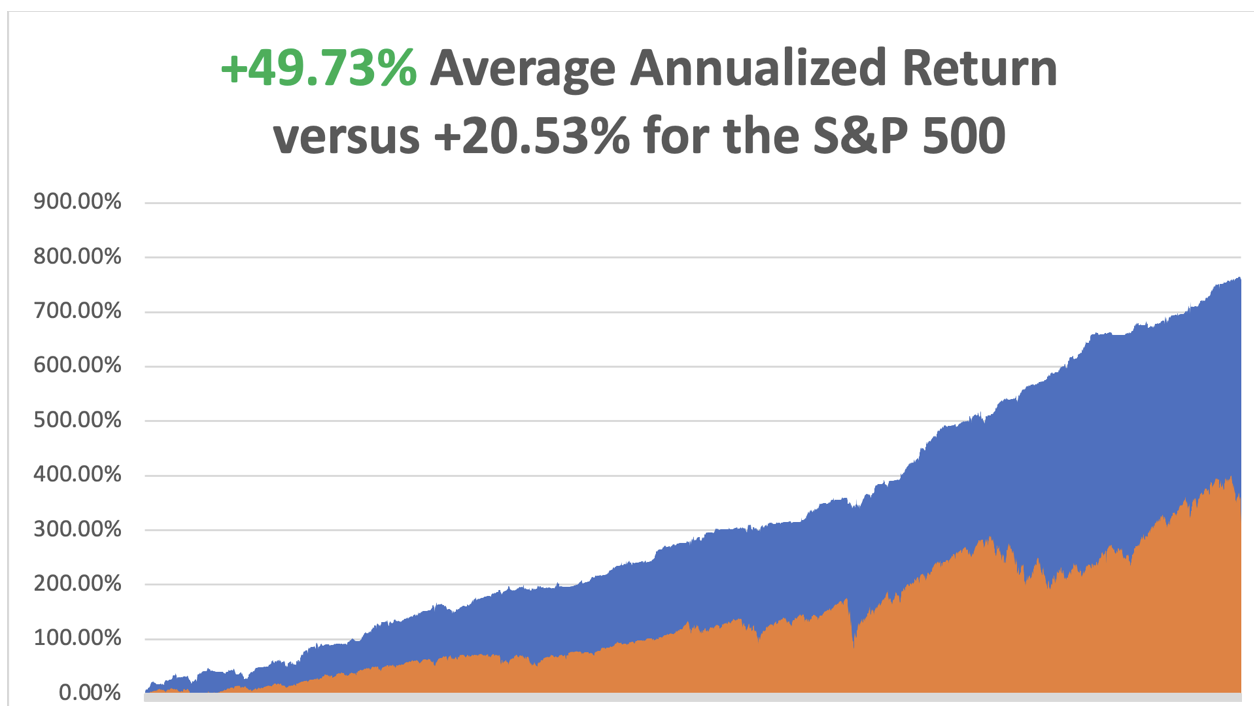
April is now down -7.25%so far due to the explosion in implied volatilities in our hedged positions. A lot of the Friday options prices made no sense and may reflect broker efforts to increase margin requirements. That takes us to a year-to-date profit of +6.58%so far in 2025. My trailing one-year return stands at a spectacular +74.93%. That takes my average annualized return to +49.73%and my performance since inception to +758.47%.
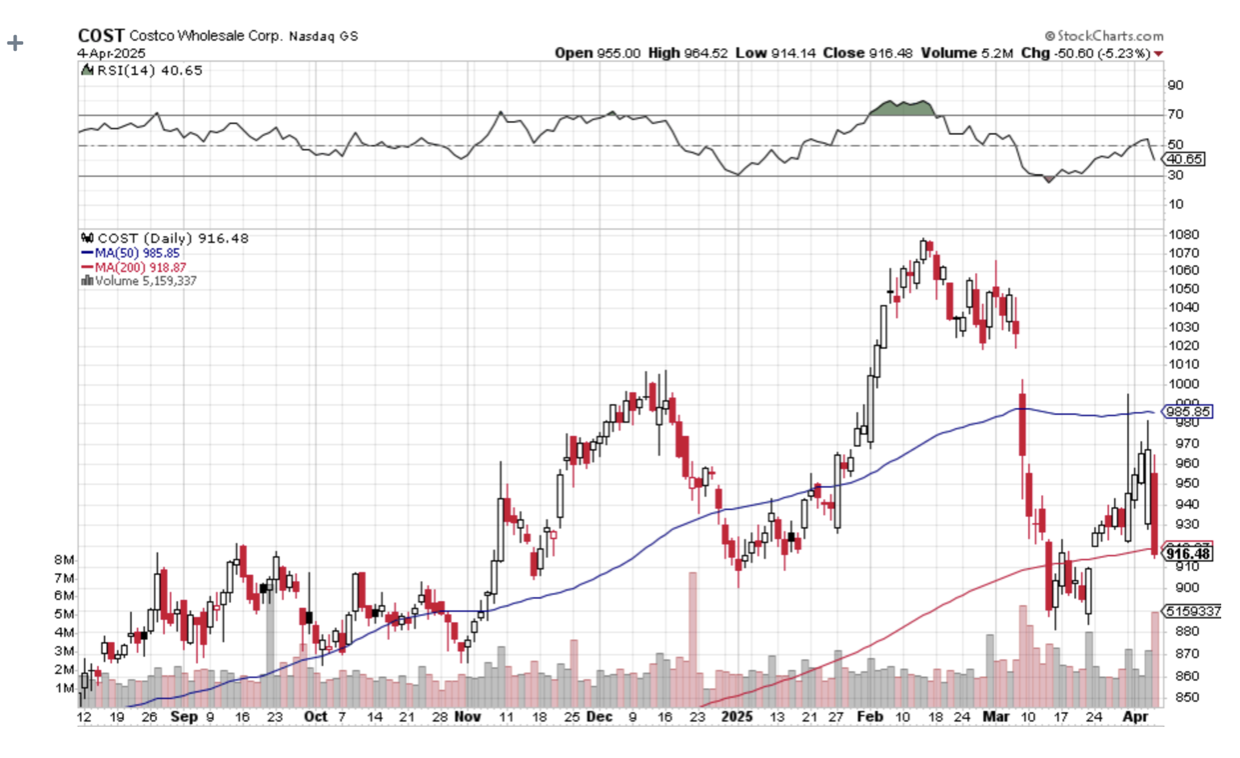
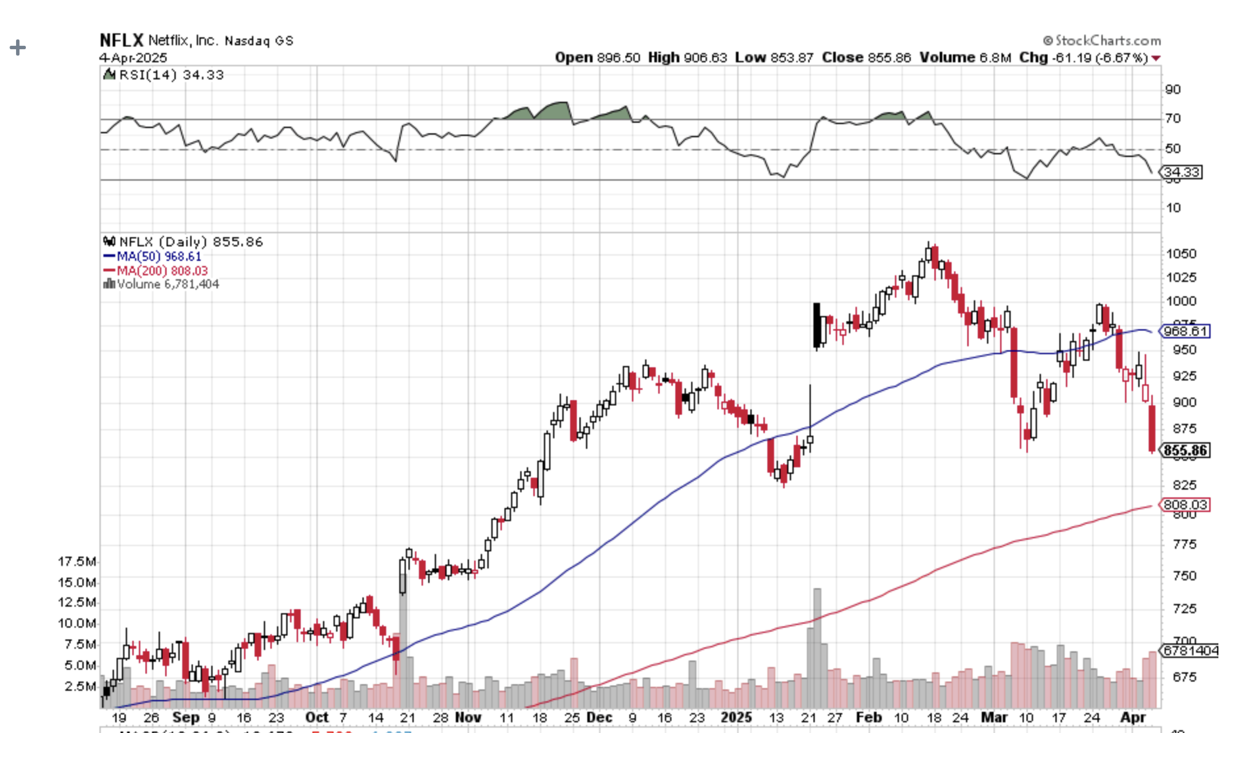
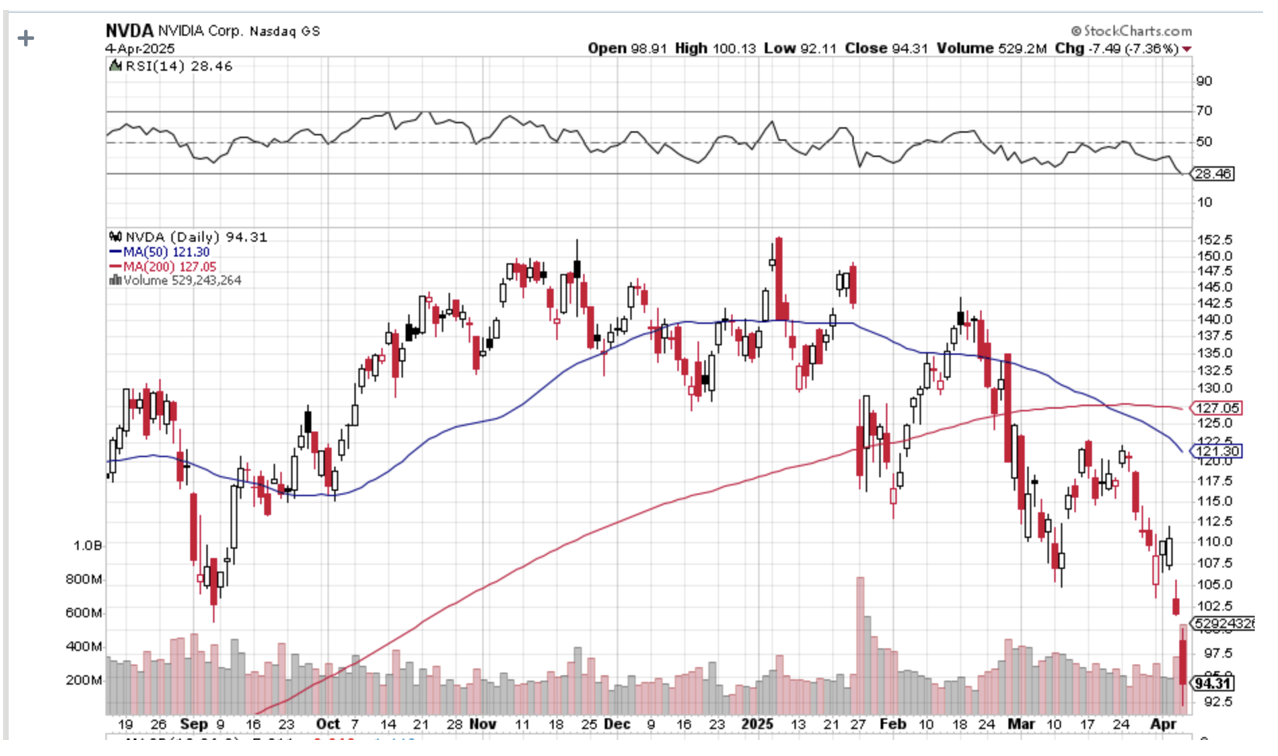
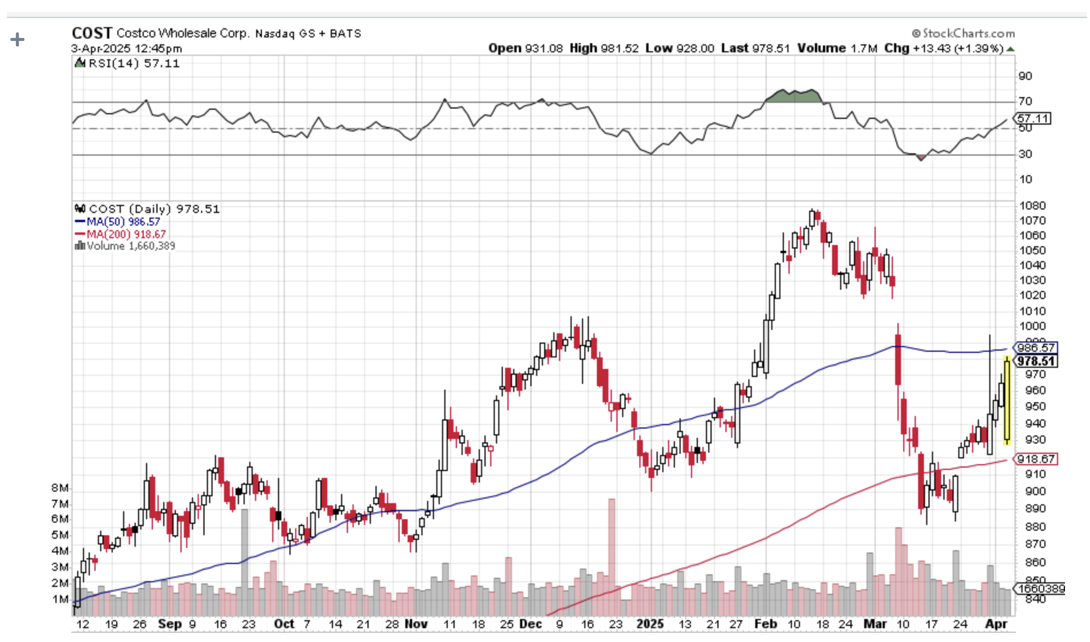
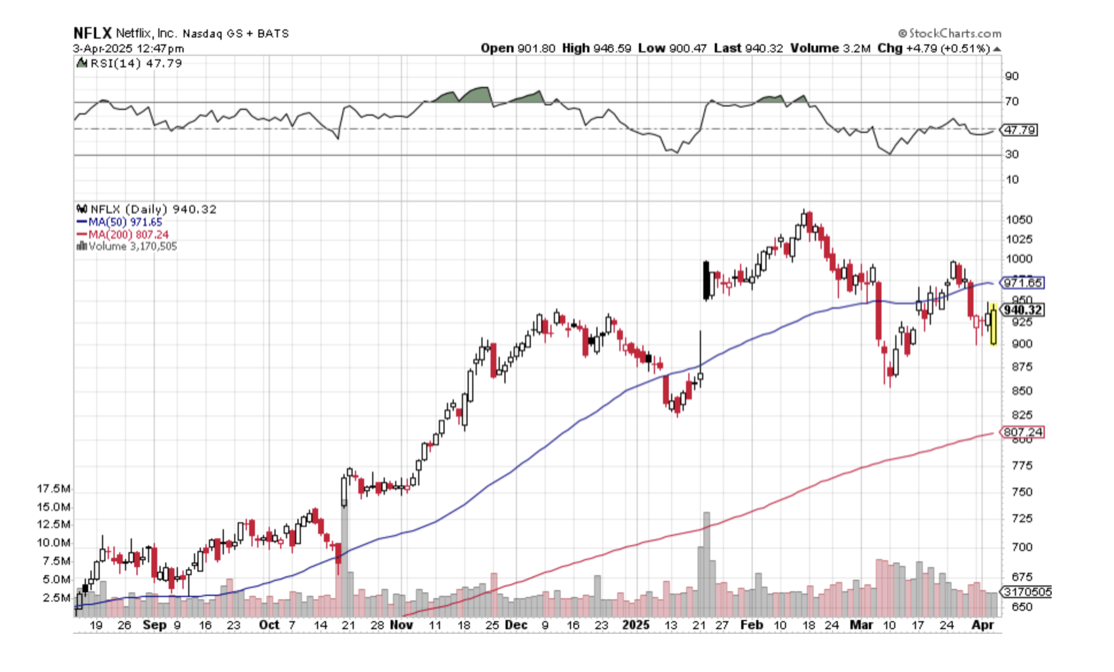
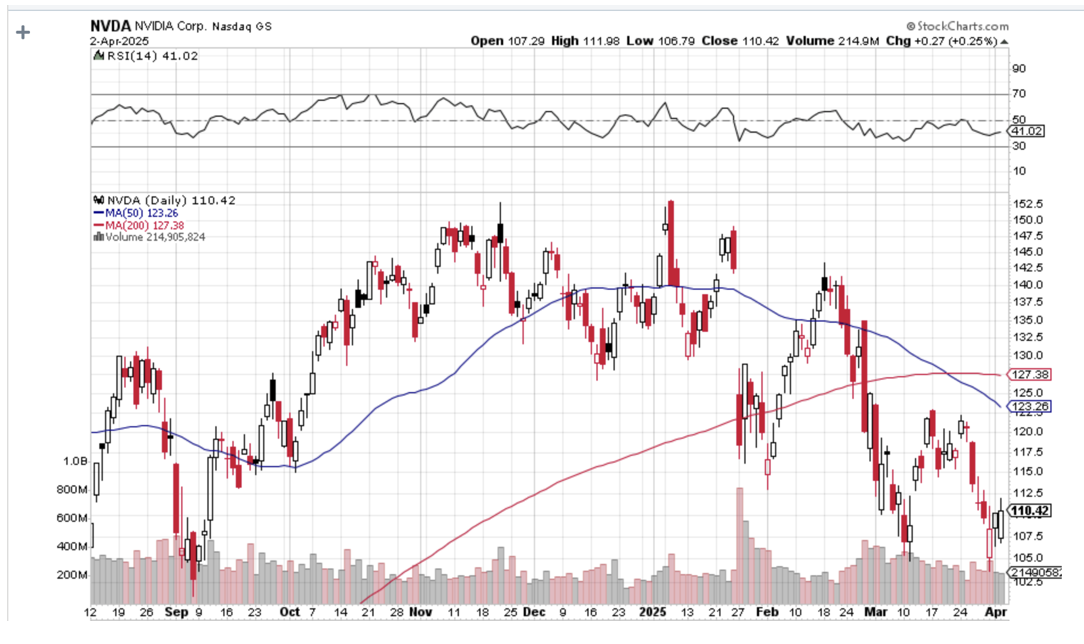
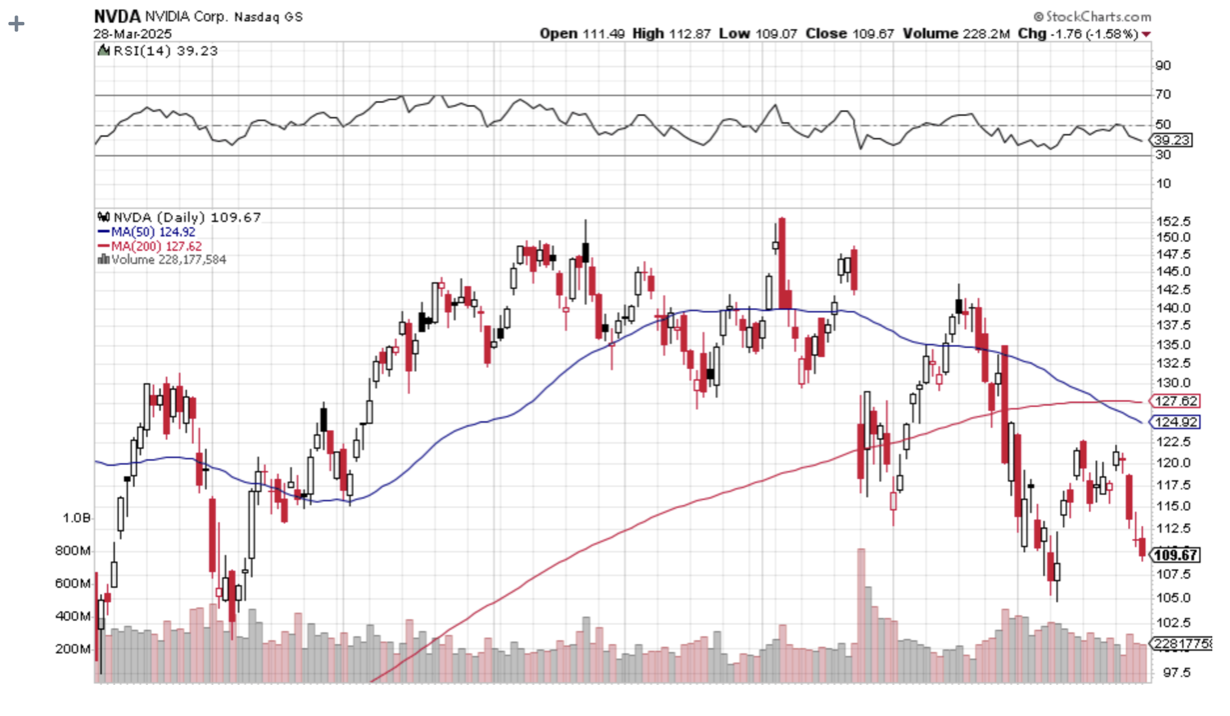
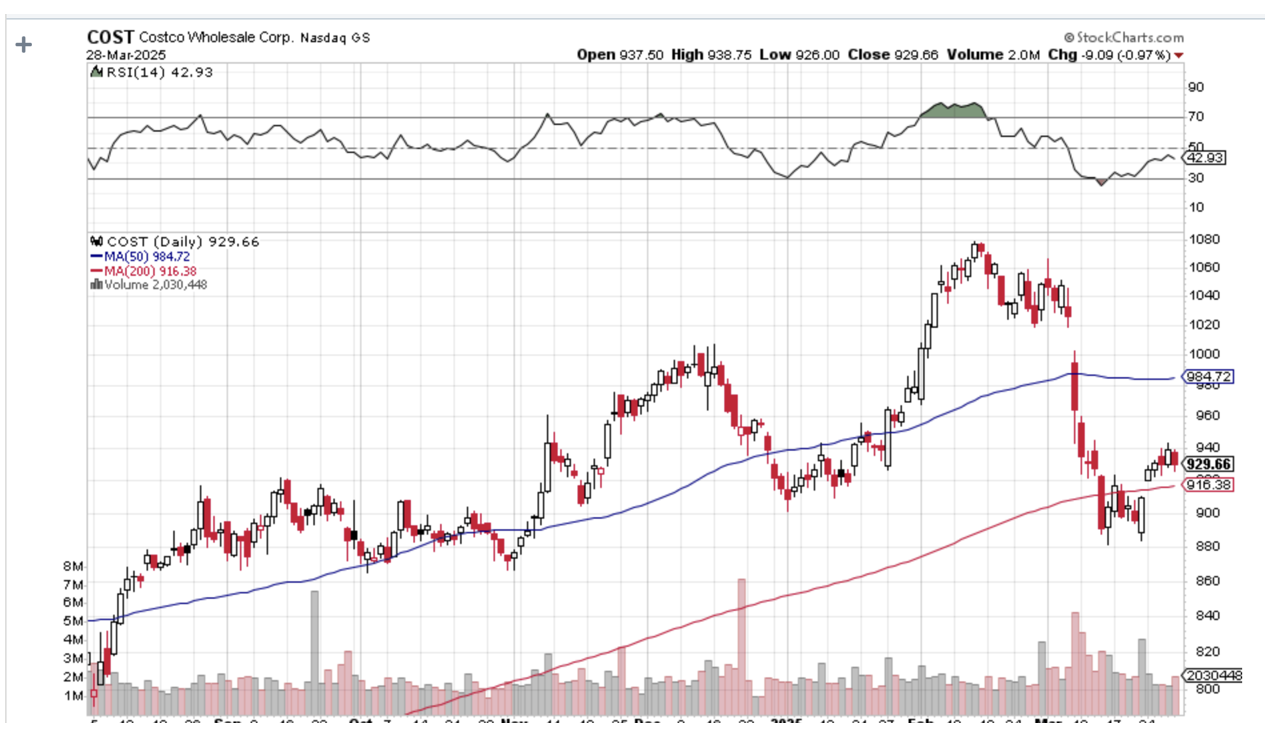
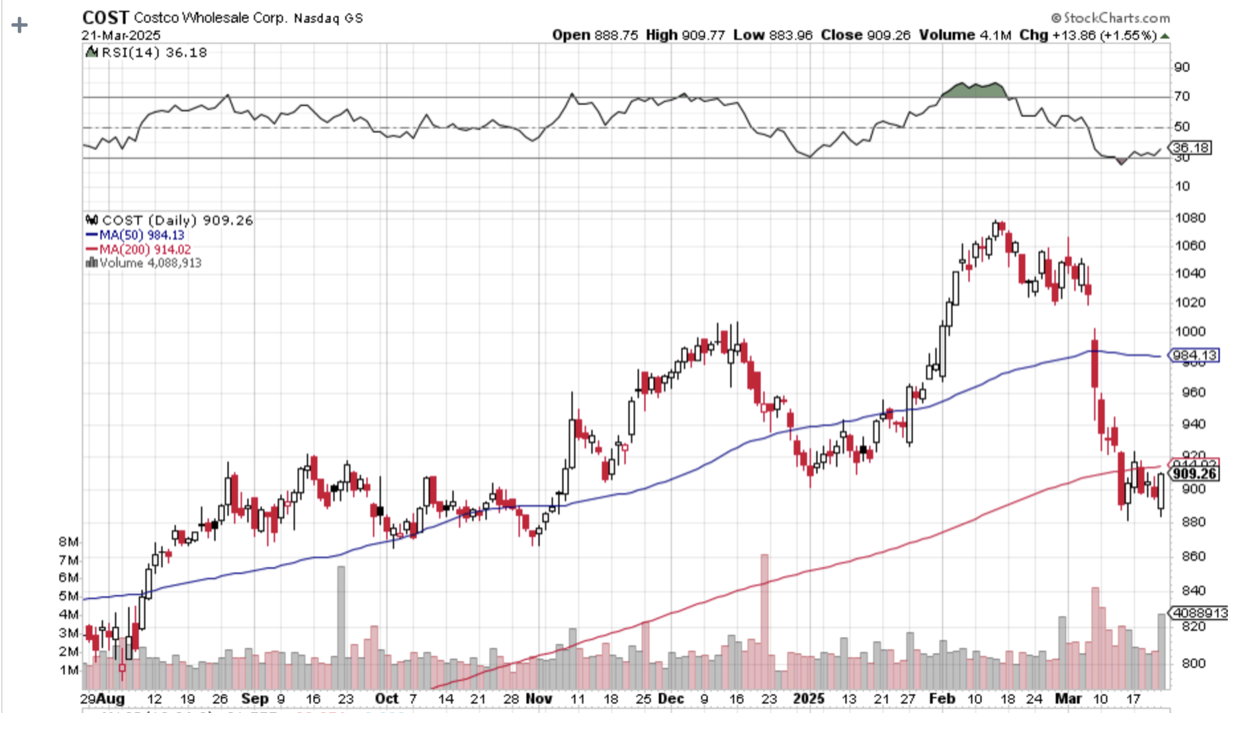
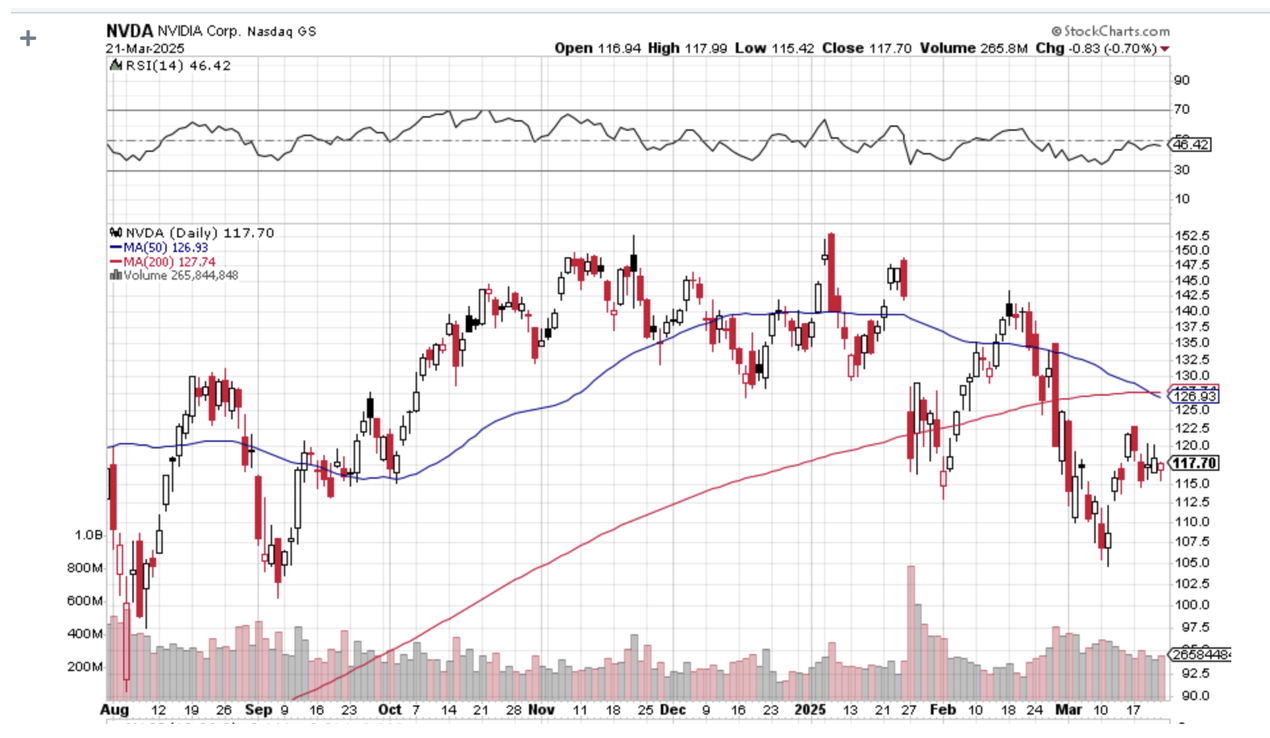
It has been another busy week for trading. I used the meltdown to add very deep in-the-money longs in (COST), (NVDA), and (NFLX). I stopped out of an existing (NVDA) long as we approached the upper strike price. I kept my very deep in-the-money long in (TSLA). I also kept my (GLD) long as a hedge.
Some 63 of my 70 round trips, or 90%, were profitable in 2023. Some 74 of 94 trades have been profitable in 2024, and several of those losses were really break-even. That is a success rate of +78.72%.
Try beating that anywhere.
My Ten-Year View – A Reassessment
We have to substantially downsize our expectations of equity returns in view of the election outcome. My new American Golden Age, or the next Roaring Twenties is now looking at multiple gale-force headwinds. The economy will completely stop decarbonizing. Technology innovation will slow. Trade wars will exact a high price. Inflation will return. The Dow Average will rise by 600% to 240,000 or more in the coming decade. The new America will be far more efficient and profitable than the old. My Dow 240,000 target has been pushed back to 2035.
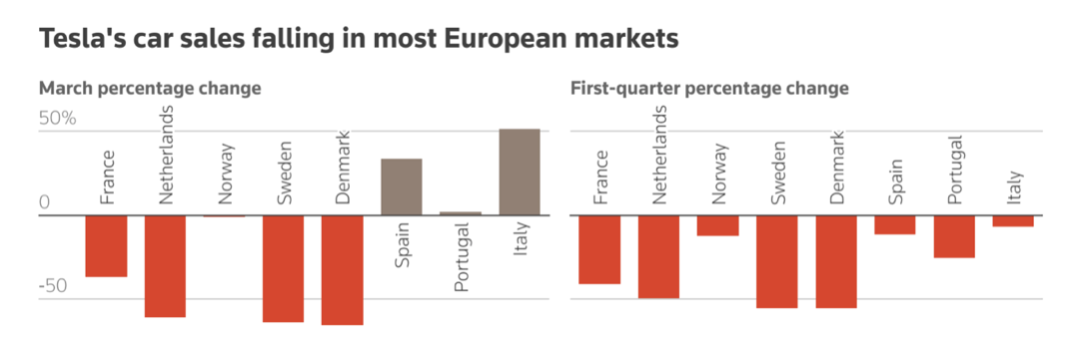
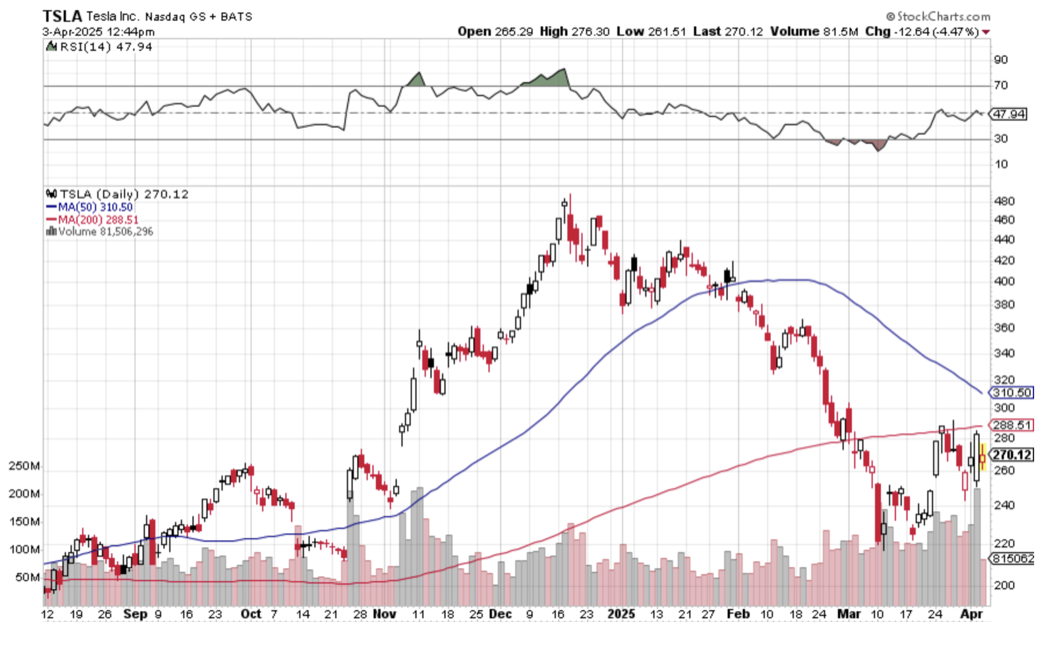
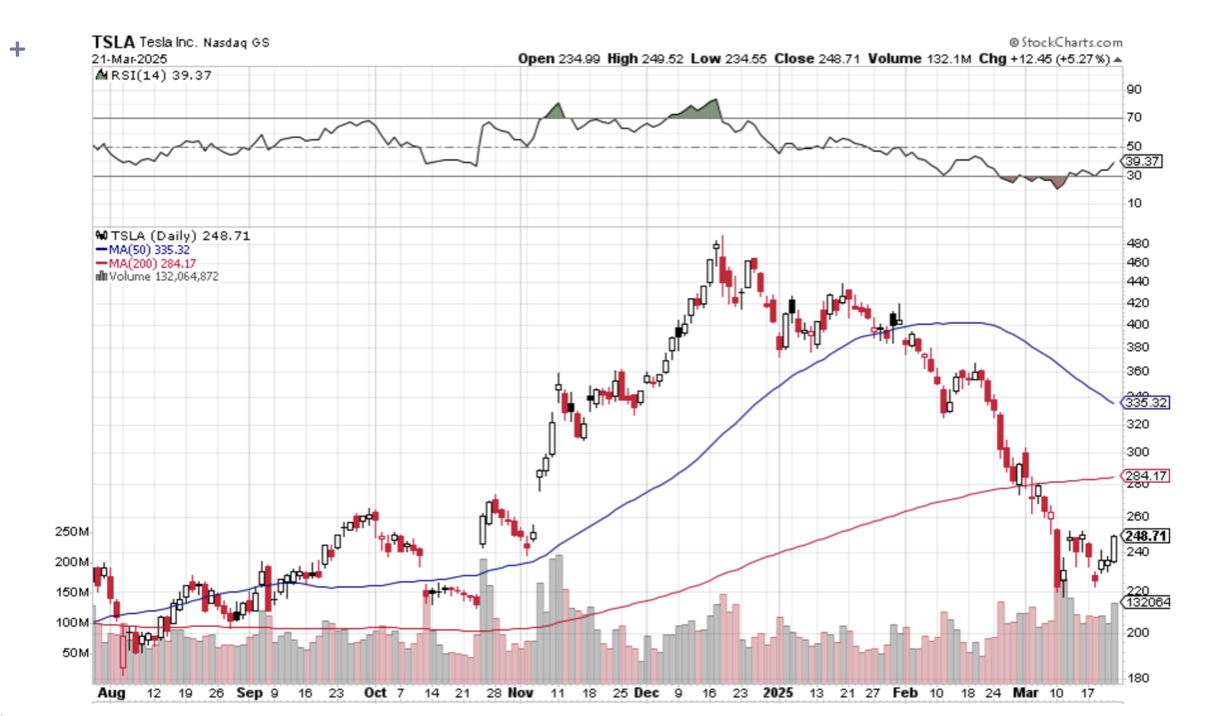
Trump Announces Worst-Case Scenario Tariffs, tanking stocks and crypto, with big technology stocks taking the biggest hits. “RISK OFF” assets like gold, silver, bonds, and foreign currencies are soaring. The Dow Average could suffer a 1987-style crash on Monday. Volatility will explode. Duties on Chinese goods were raised to 34%, Europe 20%, and Southeast Asian countries up to 45%. All countries have been hit with high tariffs to avoid transshipments. Retaliation from the world is on the way. It’s another nail in the economy’s coffin, which is now almost certainly in recession. S&P 500 at 5,000 here we come. Is this the day the great depression started? Some $2 trillion in market capitalization was lost today. Tariffs to Push All Home Prices Higher, as much as 5%, as homebuilders wind down new construction because of higher costs. Drywall comes from Mexico, lumber from Canada, and 10% of the workforce are immigrants. It could explain the recent improvement in existing home sales. Jobless Claims Hit Three-Year High. Continuing claims, a proxy for the number of people receiving benefits, increased to 1.9 million in the week ended March 22, slightly higher than economists expected. Those applications have been hovering just under that level for several months now. Meanwhile, initial claims dipped last week, to 219,000, according to Labor Department data released Thursday. Auto Loan Defaults Hit 21-Year High, with 6.5% of subprime borrowers at least 60 days overdue on payments. It is the largest default rate since data began collection in 1994. Yet another recession indicator. Tesla Sales Fall off a Cliff,down 13% on the quarter, its weakest performance in nearly three years, as backlash to CEO Elon Musk's embrace of far-right politics grows and as consumers seek out newer models from rival electric-vehicle makers. The EV maker's stumbling sales indicate that the one-time leading brand is reeling from the fallout of the company not refreshing its vehicle lineup in years, and Musk's foray into politics in the United States and Europe. The company posted weak sales in numerous European markets and China, even as more consumers are opting for EVs. Sell (TSLA) on rallies.
Global Sentiment is collapsing, over trade wars and recession fears. Business sentiment among big Japanese manufacturers worsened in the three months to March, a central bank survey showed on Tuesday, a sign escalating trade tensions were already taking a toll on the export-reliant economy. Auto exports to the US are a major support for the Japanese economy, which is an American ally. A global contagion is afoot. US Dollar Declines as a Reserve Currency, in the last quarter of 2024 while the percentage of actual dollars held as reserve ticked up, IMF data showed on Monday. Dollar-equivalent amounts dropped also among holdings in euro, pound sterling, yuan, yen, Swiss franc, and Australian and Canadian dollars, with only the latter showing a tick up in the percentage of holdings, the IMF's Currency Composition of Official Foreign Exchange Reserves (COFER) data showed. The end of American exceptionalism means a cheaper greenback. Vaccine Stocks Get Nailed, as the FDA moves the eliminate the vaccine establishment. Expect stocks to fall and disease to rise. The Food and Drug Administration's top vaccine official, Peter Marks, has been forced to resign, the most high-profile exit at the regulator as the Trump administration undertakes an overhaul of federal health agencies. Gold Stocks in Comex Warehouses Hit Record highs, due to the risk of import tariffs curtailing shipments to the United States from other countries. Latest data from Comex, part of CME Group, shows gold stored in its warehouses in the United States at an all-time high of 43.3 million troy ounces worth $135 billion at current prices compared with 17.1 million in November. Spot gold prices surged past $3,100 per ounce to a fresh record high on Monday. Bullion is up 19% so far this year after rising 27% in 2024. Buy (GLD) on dips.
On Monday, April 7, at 8:30 AM EST, the Used Car Prices are announced.
On Tuesday, April 8, at 8:30 AM, the NFIB Business Optimism Index isreleased.
On Wednesday, April 9, at 1:00 PM, the FOMC Minutes are published.
On Thursday, April 10, at 8:30 AM EST, the Weekly Jobless Claims are disclosed. We also get the Consumer Price Index and Inflation Rate.
On Friday, April 11, at 8:30 EST, the Producer Price Index for March is printed. We also get the University of Michigan Consumer Sentiment. At 2:00 PM, the Baker Hughes Rig Count is printed.
As for me, with the 38th anniversary of the 1987 crash coming up this year, when shares dove 20% in one day, I thought I’d part with a few memories.
I was in Paris visiting Morgan Stanley’s top banking clients, who back then were making a major splash in Japanese equity warrants, my particular area of expertise.
When we walked into our last appointment, I casually asked how the market was doing (Paris is six hours ahead of New York). We were told the Dow Average was down a record 300 points. Stunned, I immediately asked for a private conference room so I could call the equity trading desk in New York to buy some stock.
A woman answered the phone, and when I said I wanted to buy, she burst into tears and threw the handset down on the floor. Redialing found all transatlantic lines jammed.
I never bought my stock, nor did I find out who picked up the phone. I grabbed a taxi to Charles de Gaulle airport and flew my twin Cessna as fast as the turbocharged engines took me back to London, breaking every known air traffic control rule.
By the time I got back, the Dow had closed down 512 points. Then I learned that George Soros asked us to bid on a $250 million blind portfolio of US stocks after the close. He said he had also solicited bids from Goldman Sachs, Merrill Lynch, JP Morgan, and Solomon Brothers, and would call us back if we won.
We bid 10% below the final closing prices for the lot. Ten minutes later, he called us back and told us we won the auction. How much did the others bid? He told us that we were the only ones who bid at all!
Then you heard that great sucking sound.
Oops!
What has never been disclosed to the public is that after the close, Morgan Stanley received a margin call from the exchange for $100 million, as volatility had gone through the roof, as did every firm on Wall Street. We ordered JP Morgan to send the money from our account immediately. Then they lost the wire transfer!
After some harsh words at the top, it was found. That’s when I discovered the wonderful world of Fed wire numbers.
The next morning, the Dow continued its plunge, but after an hour managed a U-turn, and launched on a monster rally that lasted for the rest of the year. We made $75 million on that one trade from Soros.
It was the worst investment decision I have seen in the markets in 53 years, executed by its most brilliant player. Go figure. Maybe it was George’s risk control discipline kicking in?
At the end of the month, we then took a $75 million hit on our share of the British Petroleum privatization because Prime Minister Margaret Thatcher refused to postpone the issue, believing that the banks had already made too much money.
That gave Morgan Stanley’s equity division a break-even P&L for the month of October 1987, the worst in market history. Even now, I refuse to gas up at a BP station on the very rare occasions I am driving a rental internal combustion engine from Enterprise.
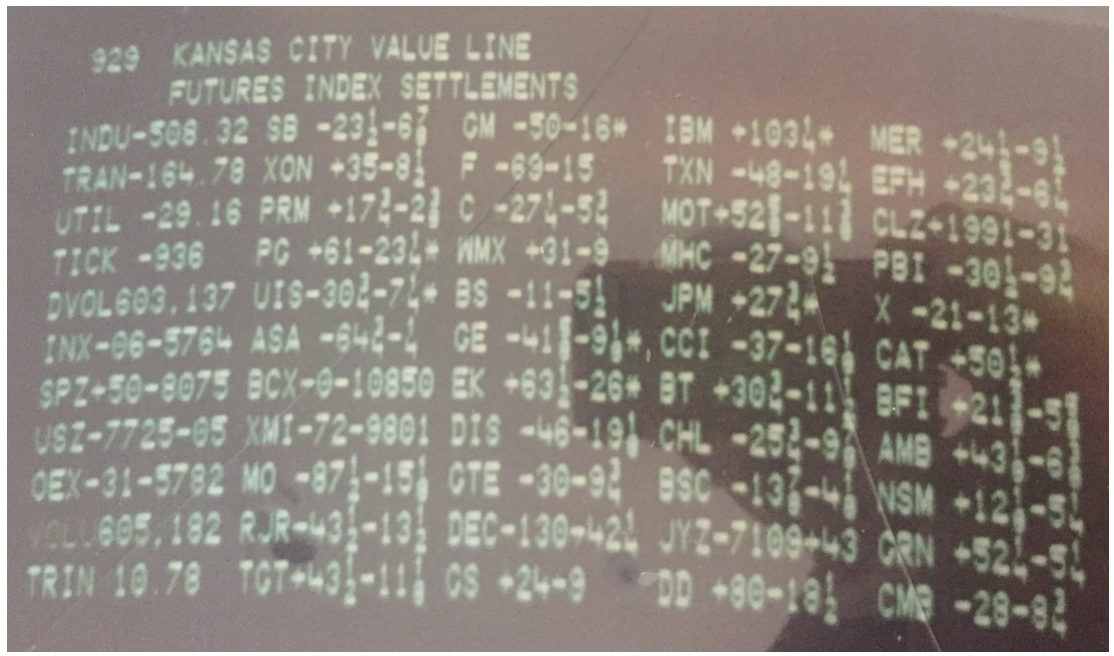
My Quotron Screen on 1987 Crash Day
Good Luck and Good Trading,
John Thomas
CEO & Publisher
The Diary of a Mad Hedge Fund Trader
https://www.madhedgefundtrader.com/wp-content/uploads/2025/03/morgan-stanley.png7181040april@madhedgefundtrader.comhttps://madhedgefundtrader.com/wp-content/uploads/2019/05/cropped-mad-hedge-logo-transparent-192x192_f9578834168ba24df3eb53916a12c882.pngapril@madhedgefundtrader.com2025-04-07 09:02:212025-04-07 13:07:53The Market Outlook for the Week Ahead, or Trump Declares War on the World
Below please find subscribers’ Q&A for the April 2 Mad Hedge Fund Trader Global Strategy Webinar, broadcast from Incline Village, NV.
Q: Why are there days when both bonds and interest rates are going up?
A: Well, there is a tug-of-war going on in the bond market. When recession fears are the dominant theme of the day, interest rates go down and bond prices go up. Remember, it's an inverse relationship. When the deficit and inflation are the big fears and you get those on the inflation announcement days—we get three or four of those a month—then interest rate goes up and bonds go down. That will be a big driver of stock prices because they are very sensitive to interest rates always.
Q: Do you think Tesla (TSLA) has hit bottom?
A: I don't think so. I think the declining sales continue. I think the Tesla brand has been severely damaged as long as Elon Musk stays in politics. Also, no one buys cars in recessions—sorry, but that is the last thing that people or companies want to buy is a brand-new car.
Q: What will happen to the smaller EV makers?
A: They will all go bankrupt. You know, unless they have a very rich uncle like Lucin Group (LCID) does—Saudi Arabia can keep pumping money in there forever. Amazon owns a big piece of Rivian Motors (RIVN) I don't think any of the small EV makers will make it because they now have Tesla to compete against.
Q: Do you have any way to short restaurant stocks as an industry?
A: I don't know of a single industry ETF for restaurants only. Restaurants are not an industry I have spent a lot of time studying because the margins are so low. I prefer a 70% margin to a 3% margin ones. There are a lot of things like consumer discretionary, so you just have to go shopping in the ETF world. There are more than 3,000 listed ETFs these days in every conceivable subsector of the economy, more than there are listed stocks, so there might be something out there somewhere. Yes, you are correct in wanting to short restaurants going into a recession as well as airlines, rental car companies, and hotels, but these things are already down a lot—you know, 40% or so. So, be careful shorting after these things have already had enormous declines in a very short time.
Q: Will the recession cause Democrats to win midterm elections?
A: If I were a betting man—and of course I'm not, I only go after sure things, —I would say yes. But, you know, 18 months might as well be 18 years in the political world. So, who knows what will happen? Suffice it to say that yesterday's election results were overwhelmingly positive for the Democrats and represent a very strong “no vote” for Trump policies and Musk policies. Even in Florida where they won, the victory margin shrank from 35% six months ago to 12%. That is an enormous swing in the electorate away from Republicans, and that's why the Republicans are very nervous about any election. That's why the Texas governor is blocking a by-election there. He’s afraid he’ll lose.
Q: Is Tesla (TSLA) toast for good?
A: If Elon Musk went back to Silicon Valley and just managed Tesla and kept his mouth shut on non-Tesla issues, I bet the stock would double from these levels over the medium term. So yes, it just depends on how much Elon Musk wants his $200 billion back. That's how much he's lost on the stock depreciation since December.
Q: Is it time to short Delta Air Lines (DAL)?
A: You kind of missed the boat. No point in closing the barn door after the horses have bolted. This was a great short in February, and the same with hotels and rail companies. So be careful of your biggest recession indicators; they have all already collapsed and are more likely to bounce along the bottom.
Q: What are the probabilities that the tariff war could backfire, and we end up with massive job losses and a shortage of goods?
A: Actually, that is the most likely outcome. In my humble opinion, we know big layoffs are coming already. Prices are going to go up, so people will buy less. And prices will go up a lot because of the tariffs, so it's the perfect, perfect economy destruction strategy. And of course, that all feeds directly into the stock market.
Q: Do you think a 10% decline is enough to reflect all of that?
A: Absolutely not. More like down 20% or down 30% to discount the destruction of the economy—some say by half. So, that's an easy question to answer.
Q: Do you think Palantir (PLTR) will recover from this dip?
A: Only when government spending resumes. That could happen sooner once we get some clarity on where the government is actually going to spend its money. Palantir claims they can save masses of money for the government by getting it just to use their software, and a lot of companies are making that claim, like Arthur Anderson, who also had all their contracts axed. So, we don't know. “We don't know” is the most commonly heard expression in the country today. We just don't know what's going to happen.
Q: And is Palantir (PLTR) cheap after a 40% sell-off?
A: No. It's still incredibly expensive and that is the concern.
Q: Is crypto a good short-term bet in this type of high volatility?
A: No, it's not. It's a horrible bet. A 10% decline in the S&P 500 delivered a 30% decline in crypto. If we drop another 10%, you can expect crypto to drop another 30%. You know, it's like a 3x long NASDAQ ETF. That's how it's behaving. So, I watch it very carefully as a risk indicator. If we get a substantial rally, I'm looking to short the big players in crypto, which would be MicroStrategy (MSTR) and ProShares Bitcoin Strategy ETF (BITO). Looking for a good short there or at least to write calls. The call premiums are extremely high on all these crypto plays—sometimes they're 84%.
Q: How much more inflation can the economy handle before we are in a deep recession?
A: Well, I think we're in recession now. Almost every inflation indicator is pointing to lots of upside and, of course, the tariffs haven't even started yet. They start today, and it'll take at least a month or two to see what the actual impact of the tariffs will be on local prices.
Q: Why do you think the tariffs will be damaging to the economy?
A: Virtually every economist in the world has agreed that the trade wars of the 1930s were a major cause of the Great Depression, but not the sole cause. The only economists that have changed their minds now are the ones that have just gotten Trump appointments. I mean, that's it, clear and simple. You raise the price, you get less demand—basic supply and demand economics. I'm not inventing anything new here. It’s basic economics 101.
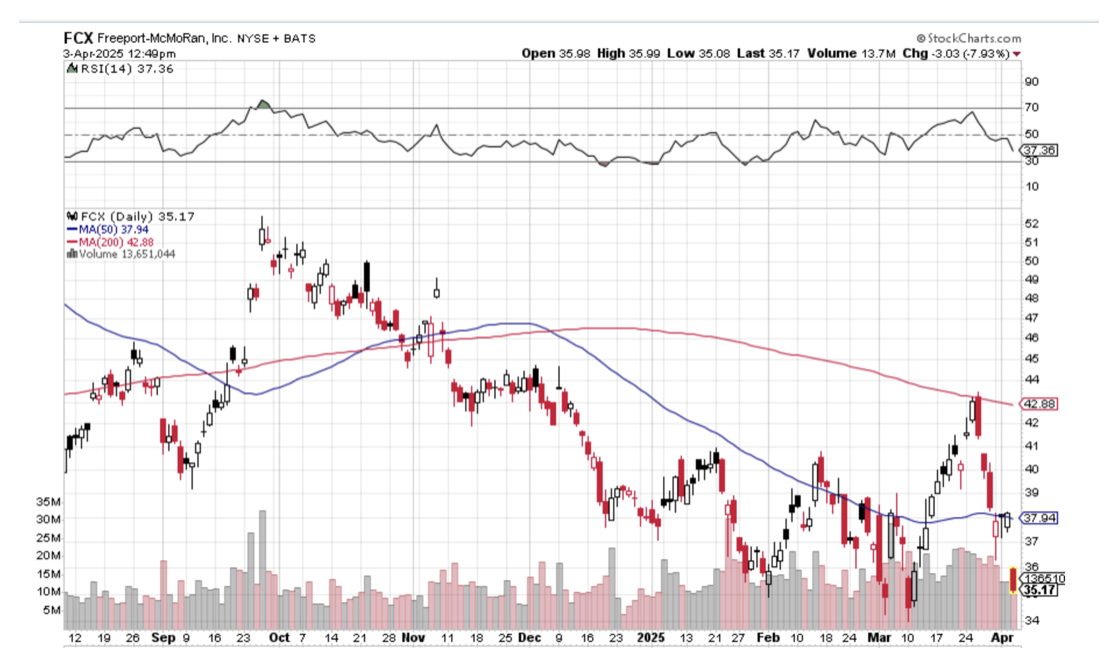
Q: Here's a good question that has puzzled people for a century: If Copper is up, why is Freeport McMoRan (FCX) down?
A: Freeport is a stock first and a commodity producer second. When stocks crash, people flee to commodities, and that is what is happening. Chinese are buying up copper ingots as a gold alternative, and people are dumping Freeport because it's in an index. Some 80% of all the selling is index selling. So if you're in that index, your stock goes down regardless of your individual fundamentals. Whether it's a good company or not, whether your earnings are expanding or not, I'm seeing this happen in lots of other great companies.
Q: Is gold (GLD) subject to 25% import duties? What will that do to the pricing of gold?
A: Physical gold got an exemption, so it is not. However,gold stocks in COMEX warehouses in New York hit record highs as the managers rushed to bring in gold to beat the tariffs to meet the ETF demand in the United States. So there’s a lot of turmoil in that market, as there are in all markets now—people trying to beat the tariffs. By the way, I bought all the computer equipment my company needs for the rest of this year in order to beat the tariff increases because all my Apple (AAPL) stuff comes from China and they're looking at 60% tariffs.
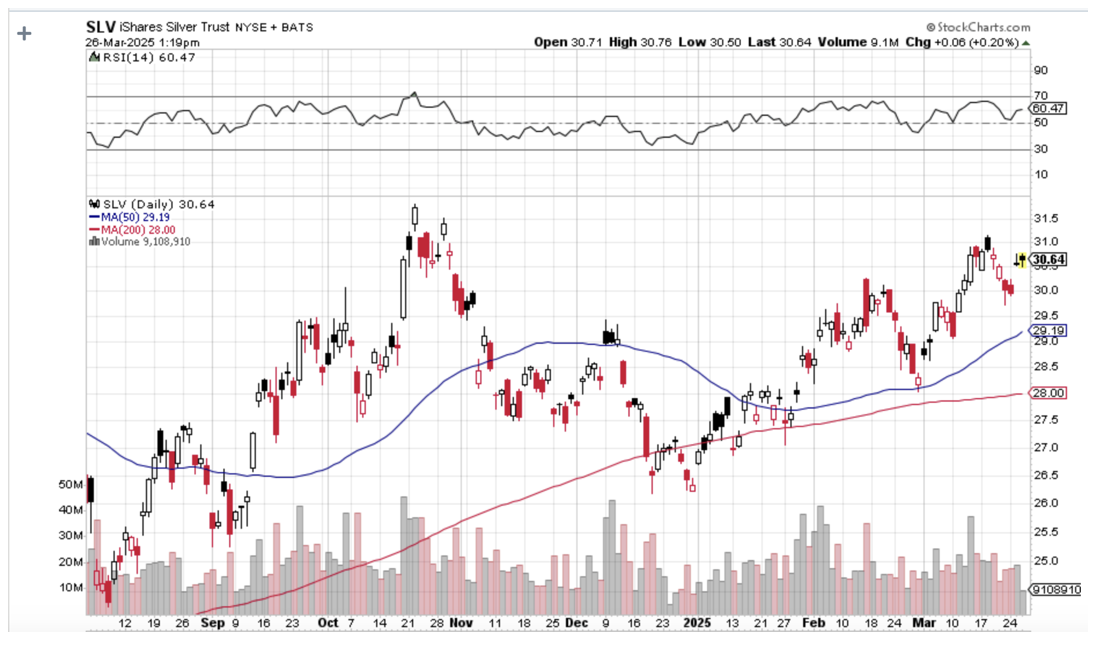
Q: If the silver (SLV) does go to a new all-time high, does that mean the S&P 500 is going to an all-time high?
A: No, if anything (SPY) goes to a multi-year low. We may be losing a generation of stock investors here. That puts silver within easy range at $50.
Q: Will biotech stocks shift because of the policy changes?
A: They're losing their government research funding, the authorization process for new drug approvals has had sand thrown at it. Time delays have been greatly extended on new approvals and suffice to say, the leadership does not have the confidence of the industry, and biotech stocks are doing horribly. You know, when you appoint someone to head a department whose main job is to dismantle that department, that's generally really horrible for the industry, especially when the industry is dependent so much on government grants for research. We are losing a generation of new scientists. That puts off any cures for cancer, Alzheimer’s, or diabetes into the far future.
To watch a replay of this webinar with all the charts, bells, whistles, and classic rock music, just log in to www.madhedgefundtrader.com, go to MY ACCOUNT, click on GLOBAL TRADING DISPATCH, TECHNOLOGY LETTER, or JACQUIE'S POST, then WEBINARS, and all the webinars from the last 12 years are there in all their glory.
Good Luck and Good Trading,
John Thomas
CEO & Publisher
The Diary of a Mad Hedge Fund Trader
I just received an excited text message from an excited Concierge client. His long position in the (NVDA) April 17 2025 $90-$95 vertical bull call debit spread had just been called away. That meant he would receive the maximum profit a full 10 trading days before the April 17 option expiration. Whoever called away the option ended up eating all of the remaining premium.
With the heightened volatility today, I am seeing an increasing number of options positions assigned or called away.
I know all of this may sound confusing at first. But once you get the hang of it, this is the greatest way to make money since sliced bread.
I still have three positions left in my model trading portfolio that are deep in-the-money, and about to expire in 10 trading days on the April 17 options expiration day. Those are the
(NVDA) 4/$90-$95 call spread 10.00%
(COST) 4/$840-$850 call spread 10.00%
(TSLA) 4/$160/$170 put spread 10.00%
That opens up a set of risks unique to these positions.
I call it the “Screw up risk.”
As long as the markets maintain current levels, this position will expire at its maximum profit value.
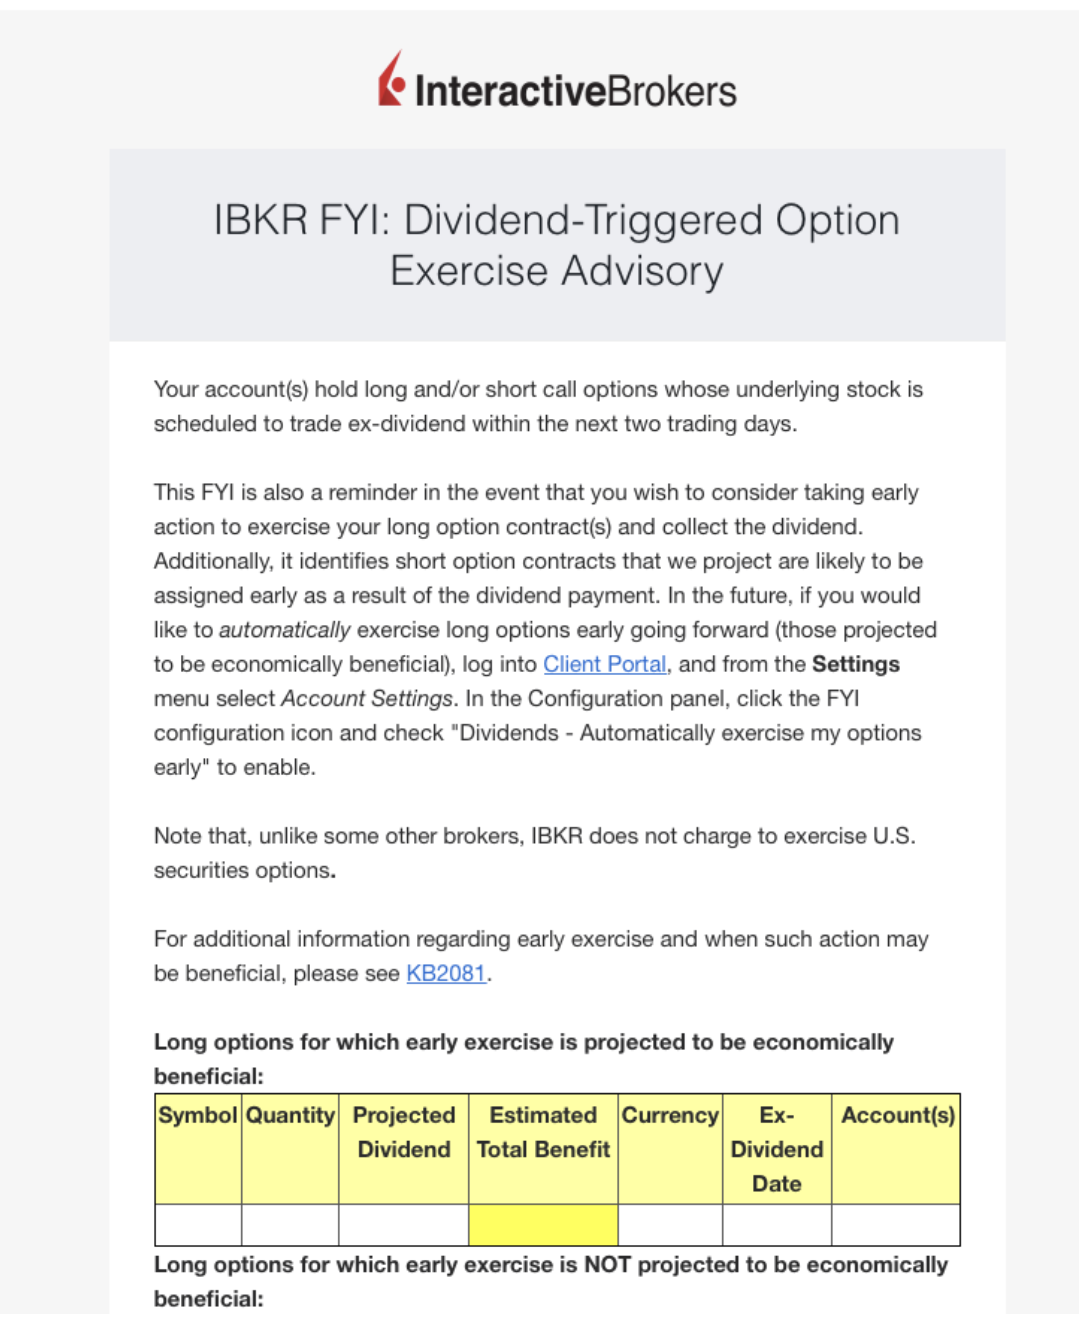
There is a heightened probability that your short position in the options may get called away.
Although the return for those calling away your options is very small, this is how to handle these events.
If exercised, brokers are required by law to email you immediately.
If it happens, there is only one thing to do: fall down on your knees and thank your lucky stars. You have just made the maximum possible profit for your position instantly.
Most of you have short-option positions, although you may not realize it. For when you buy an in-the-money vertical option spread, it contains two elements: a long option and a short option.
The short options can get “assigned,” or “called away” at any time, as it is owned by a third party, the one you initially sold the put option to when you initiated the position.
You have to be careful here because the inexperienced can blow their newfound windfall if they take the wrong action, so here’s how to handle it correctly.
Let’s say you get an email from your broker telling you that your call options have been assigned away.
I’ll use the example of the Berkshire Hathaway (BRK/B) from last August $405-$415 in-the-money vertical Bull Call spread since so many of you had these.
For what the broker had done in effect is allow you to get out of your call spread position at the maximum profit point 11 days before the August 16 expiration date.
In other words, what you bought for $8.70 on July 12 is now worth $10.00, giving you a near-instant profit of $1,300 or 14.94% in only11 trading days.
All you have to do is call your broker and instruct them to “exercise your long position in your (BRK/B) August 16 $405 calls to close out your short position in the (BRK/B) August $410 calls.”
You must do this in person. Brokers are not allowed to exercise options automatically, on their own, without your expressed permission.
You also must do this the same day that you receive the exercise notice. This is a perfectly hedged position. The name, the ticker symbol, the number of shares, and the number of contracts are all identical, so you have no exposure at all.
Call options are a right to buy shares at a fixed price before a fixed date, and one option contract is exercisable into 100 shares.
Short positions usually only get called away for dividend-paying stocks or interest-paying ETFs like the (BRK/B). There are strategies out there that try to capture dividends the day before they are payable. Exercising an option is one way to do that.
Weird stuff like this happens in the run-up to options expirations like we have coming.
A call owner may need to sell a long (BRK/B) position after the close, and exercising his long (BRK/B) call, which you are short, is the only way to execute it.
Adequate shares may not be available in the market, or maybe a limit order didn’t get done by the market close.
There are thousands of algorithms out there that may arrive at some twisted logic that the puts need to be exercised.
Many require a rebalancing of hedges at the close every day which can be achieved through option exercises.
And yes, options even get exercised by accident. There are still a few humans left in this market to blow it by writing shoddy algorithms.
And here’s another possible outcome in this process.
Your broker will call you to notify you of an option called away, and then give you the wrong advice on what to do about it.
There is a further annoying complication that leads to a lot of confusion. Lately, brokers have resorted to sending you warnings that exercises MIGHT happen to help mitigate their own legal liability.
They do this even when such an exercise has zero probability of happening, such as with a short call option in a LEAPS that has a year or more left until expiration. Just ignore these, or call your broker and ask them to explain.
This generates tons of commissions for the broker but is a terrible thing for the trader to do from a risk point of view, such as generating a loss by the time everything is closed and netted out.
There may not even be an evil motive behind the bad advice. Brokers are not investing a lot in training staff these days. In fact, I think I’m the last one they really did train.
Avarice could have been an explanation here but I think stupidity and poor training and low wages are much more likely.
Brokers have so many ways to steal money legally that they don’t need to resort to the illegal kind.
This exercise process is now fully automated at most brokers but it never hurts to follow up with a phone call if you get an exercise notice. Mistakes do happen.
Some may also send you a link to a video of what to do about all this.
If any of you are the slightest bit worried or confused by all of this, come out of your position RIGHT NOW at a small profit! You should never be worried or confused about any position tying up YOUR money.
Professionals do these things all day long and exercises become second nature, just another cost of doing business.
If you do this long enough, eventually you get hit. I bet you don’t.
Calling All Options!
https://www.madhedgefundtrader.com/wp-content/uploads/2018/11/Call-Options.png345522april@madhedgefundtrader.comhttps://madhedgefundtrader.com/wp-content/uploads/2019/05/cropped-mad-hedge-logo-transparent-192x192_f9578834168ba24df3eb53916a12c882.pngapril@madhedgefundtrader.com2025-04-03 09:02:462025-04-03 12:46:12A Note on Assigned Options, or Options Called Away
There is no doubt that the data released out on Friday were a complete disaster for stock investors. The Dow Average futures posted a 1,000-point swing, from up 200 in the overnight markets to down 800 intraday.
Specifically, the Consumer Price Index came in at a hot 0.4%, which is 4.8% annualized. Five-year Inflation Expectations, which the Fed follows most closely, rocketed to 6.0%. Worse yet, Consumer Confidence rose only 0.1% for the second month in a row, the worst performance in 12 years. Friday was the day that the hard data met the soft data and concluded that the recession was on.
That screeching noise you hear is the economy grinding to a halt.
Stock markets absolutely hate stagflation. The last time we had stagflation was during the Ford and Carter administrations during the 1970s, when it took eight years for the Dow to rise a measly 1,000 points. Back then, Wall Street shrank to a fraction of its former self.
This all richly justifies my downside target of 5,000 for the S&P 500, off 20% from the February top, which is increasingly becoming a mainstream prediction. If I am wrong, it will plunge to 4,500, or down 30%.
We were promised animal spirits that would set markets on fire. Instead, the animals are sent back into hibernation and the markets are being snuffed out. I watch every single data release that comes out on a daily basis, and it is amazing how fast they are almost all rolling over at once.
The combination of rising inflation and a weakening economy is described by one infamous word: Stagflation. What’s worse, we are only one month into a stagflationary trend that could run for many months or years.
As a result, we have seen the worst start to a year since Q1 2020, the last time Trump was president. March was the worst month in 3 ½ years. It seems the stock market heartily agrees with my view.
It gets worse.
All earnings estimates for this year are based on record corporate profit margins. If those margins fail to hold when earnings are announced in the coming weeks, it may trigger the second 10% leg down in the major averages. More concerning is the forward guidance companies may provide.
It turns out that companies watch the daily data releases too. Companies sitting on their hands, not investing or hiring, can itself alone cause recessions. Right now, nobody knows what the heck to do.
The final shoe to fall will be a sharp spike up in the headline Unemployment Rate. We get the next read on this on Friday, April 4. It’s just a question of how soon this shows up in the data. Right now, hundreds of thousands of workers have been fired but are still receiving paychecks while their status is being challenged in the courts. So they aren’t being counted as unemployed….yet.
Some 42% of all the hiring in the US over the past three years has been in just two sectors, healthcare and education. That is where the biggest cuts are being made now. It’s all about getting ahead of the curve.
Let me tell you how bad things can get.
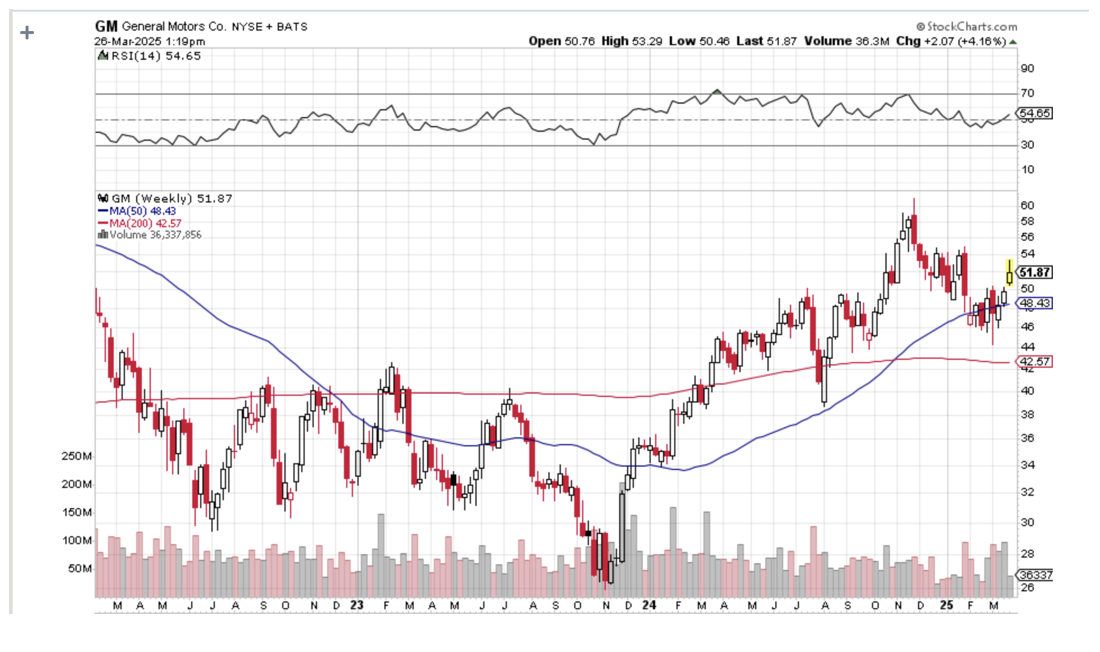
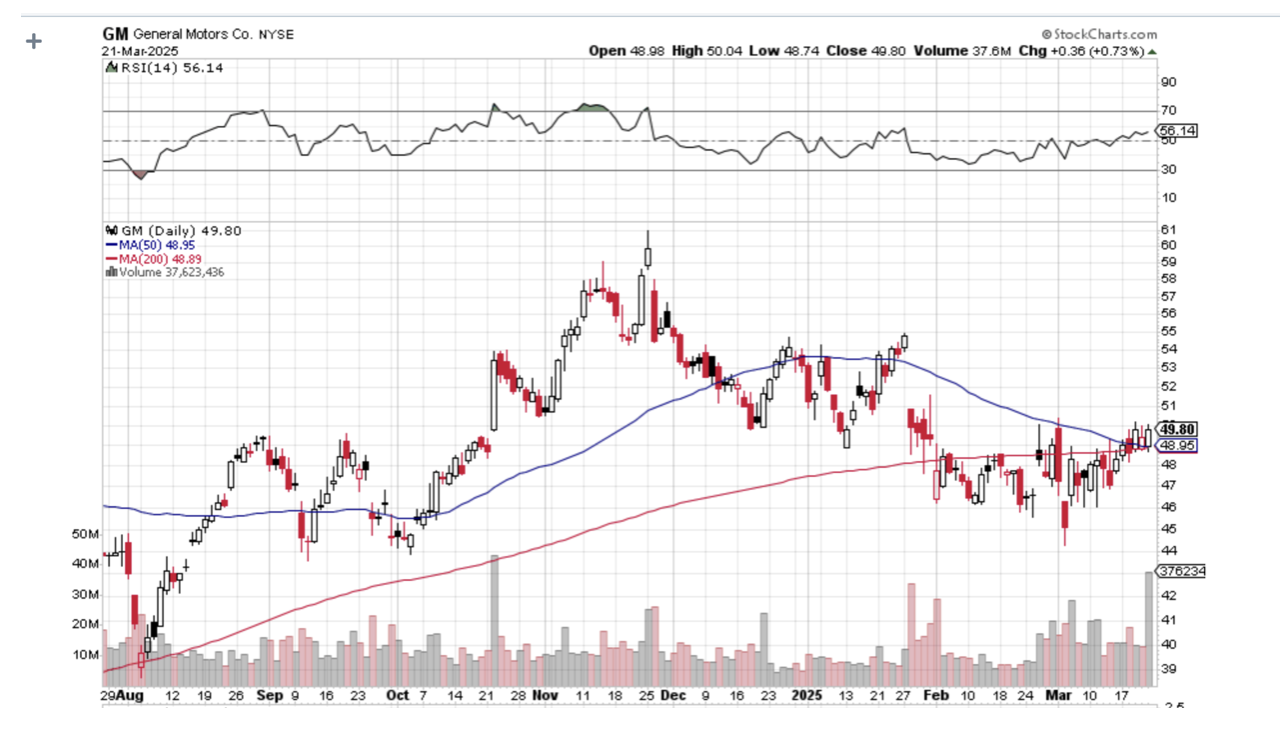
On Wednesday, the president announced 25% import duties for completed cars. General Motors (GM) makes about 30% of its cars in Mexico and Canada. As a result, (GM) may have to raise some car prices by 10%-25%. But the president has ordered (GM) not to raise prices at all.
It costs $20 billion and takes four years to build a new car factory in the US from scratch. This all turns (GM) into the perfect money-destruction machine. (GM) may not survive. And you wonder why I have been short (GM) stock two months in a row. Trump must really hate Detroit.
Believe it or not, there is a silver lining to all this.
If you missed the great bull market of the last five years, when the major indexes more than doubled, you are eventually going to get a second bite at the apple. Share prices are dropping so fast that we may get to a final capitulation selloff rather quickly. Then we will be spoiled for choice with stocks that have easy doubles and triples in them.
Let me tell you a trader’s trick.
Watch the shares of companies that have the sharpest rises on the rare up days. These are the ones that institutions are willing to jump into and hold on to forever, the permanent earnings compounders. If you take a look at the longs in the Mad Hedge Model Trading Portfolio, they all meet these criteria. They include (COST), (BRK/B), (GS), (MS), (NVDA), and (AMZN).
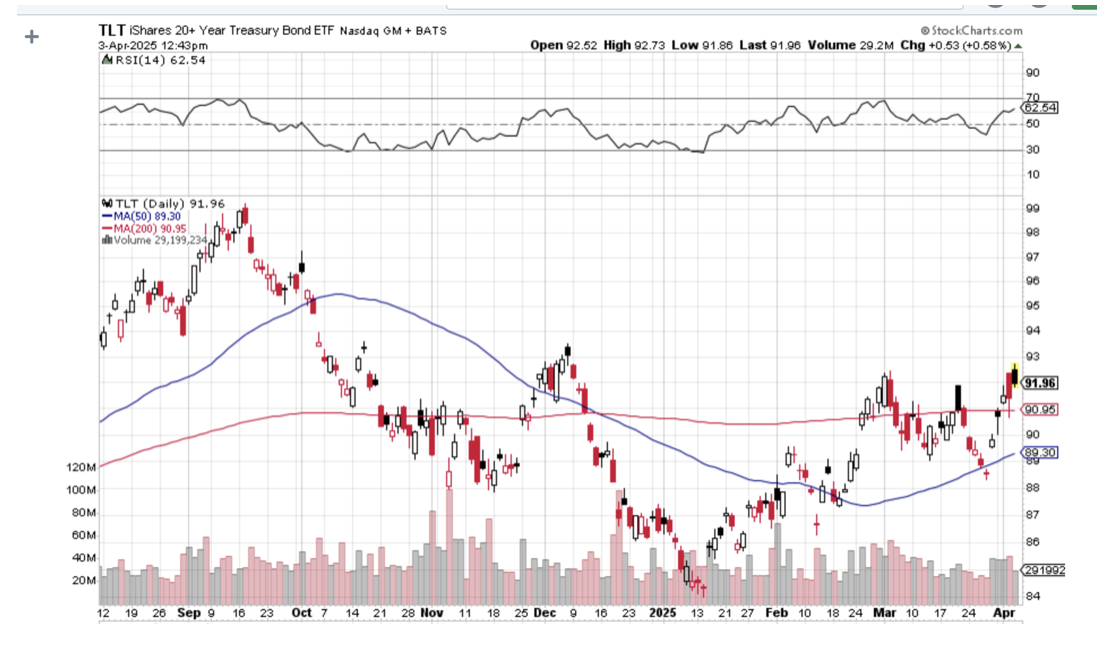
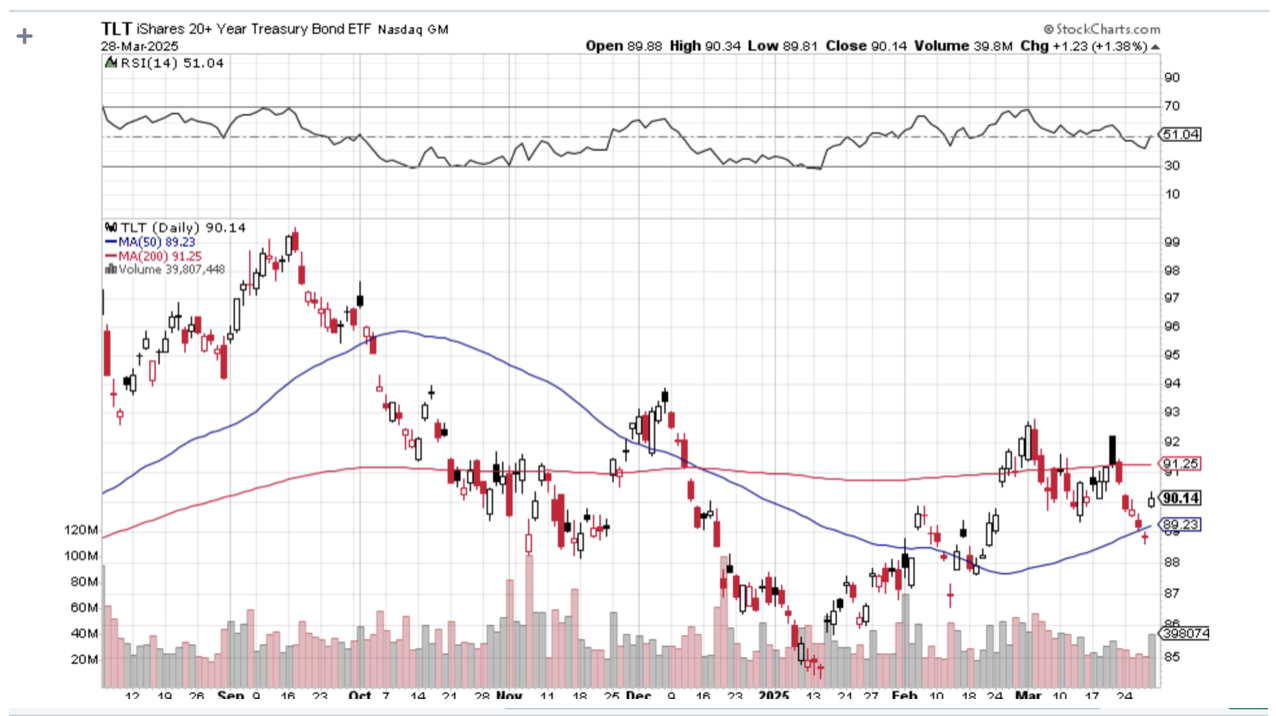
Buying bonds (TLT) and gold (GLD) going into a recession may not be a bad idea either. And for those who don’t want to play when the going gets rough, there are always 90-day US Treasury bills yielding 4.20%. They are government-guaranteed.
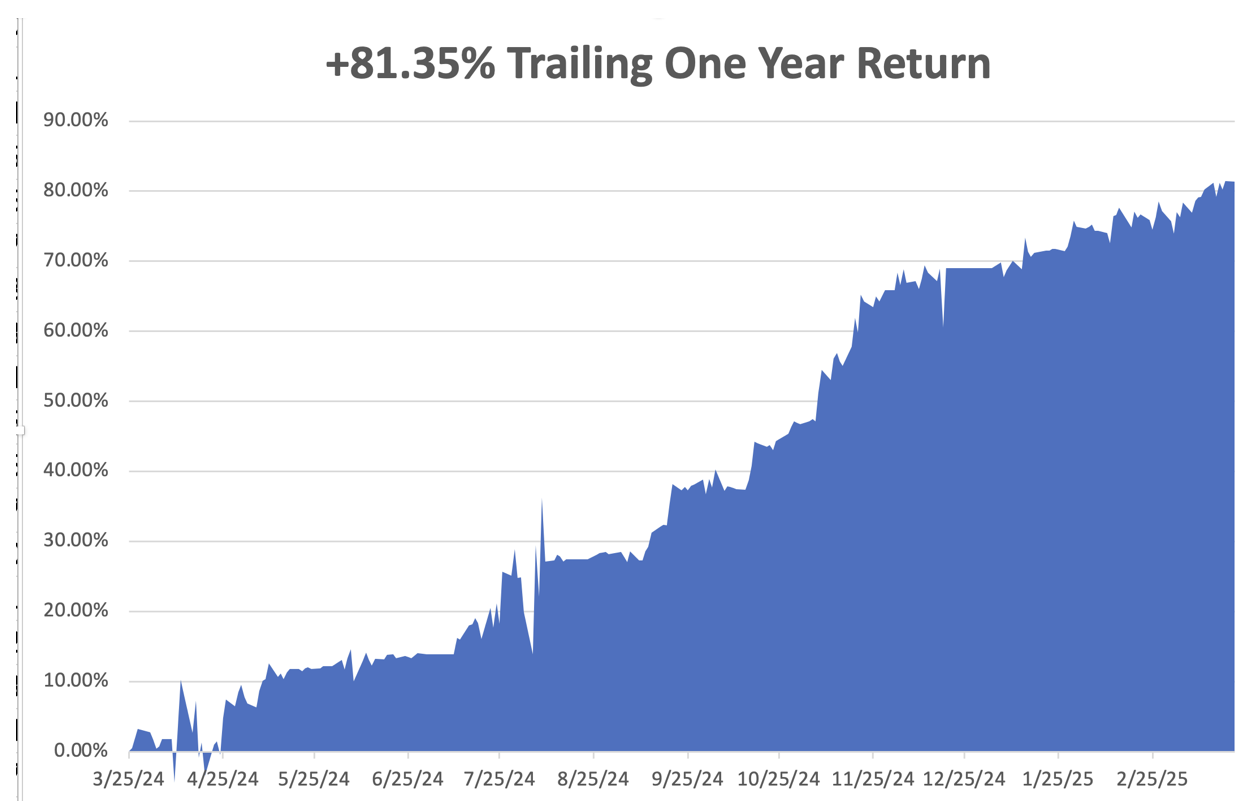
March is now up +3.17% so far. That takes us to a year-to-date profit of +12.64%so far in 2025. That means Mad Hedge has been operating as a perfect -1X short S&P 500 ETF since the February top. My trailing one-year return stands at a spectacular +81.35%. That takes my average annualized return to +49.82%and my performance since inception to +764.63%.
It has been another busy week for trading. I took profits on the short in (NVDA), which collapsed in the latest tech-driven leg down. I added a new long in (COST), a position I have been trying to get into for years, and it immediately started to make money.
I also stopped out of my two auto shorts in (GM) and (TSLA) at cost. Then Trump moved up his auto tariff announcements by a week, and both positions shot up to max profits. Welcome to trading in the Trump administration. In this period of extreme uncertainty, I have tightened up my stop-loss strategy to avoid big losses.
Some 63 of my 70 round trips, or 90%, were profitable in 2023. Some 74 of 94 trades have been profitable in 2024, and several of those losses were really break-even. That is a success rate of +78.72%.
Try beating that anywhere.
Stagflation Accelerates, with a hot 0.4% increase in the Consumer Price Index and a tepid 0.1% increase in Consumer Spending, the worst since the Pandemic. One-year inflation expectations have shot up to 5.0%. Today is the day the hard data met the soft data and jointly agreed that we are in a recession. S&P 500 5,000 here we come!
25% Auto Import Tariffs Become Official on April 2. The auto industry, once the largest in the US, says it will trigger a recession. Car prices will rise an average of $5,000 per vehicle. Expect the economies of Michigan, Indiana, Wisconsin, and Illinois to get demolished as they feed a lot of the parts into Detroit. Steel will also be affected. Some 30% of autos made by US companies are assembled in Canada and Mexico. Which US car makers have the highest share of American content? Tesla.
US GDP Grows 2.4%, during the October-December quarter. These may be the last positive numbers we see for a while as the country heads into recession.
Bonds Rocket, with inflation now running at a 5% annual rate, and the tariffs should add another 1%. That means the next Fed move is likely to be an interest rate RISE, while the unemployment rate is rising. That’s a worst-case scenario for the economy and the stock market.
Moody’s Warns of a Downgrade of the United States, saying Trump’s trade tariffs could hamper the country’s ability to cope with a growing debt pile and higher interest rates. Recession risks are rising.
Canada Freezes Rebates for Tesla Purchasers. Canada has frozen C$43 million ($30.11 million) of rebate payments for Tesla. Buyers had been eligible for a $5,000 rebate on vehicles costing less than $65,000. Tesla’s Q1 sales out next week is expected to be terrible. Avoid (TSLA).
S&P Case Shiller National Home Price Index Rises 4.7% YOY. Home price growth held steady at 0.5% M/M, on a seasonally adjusted basis, in January, according to the S&P CoreLogic Case-Shiller Home Price Index composite for 20 cities. On an unadjusted basis, the Case-Shiller HPI for 20 cities inched up 0.1% from a month earlier, decelerating from the +0.2% consensus and accelerating from the previous month's -0.1%. On a Y/Y basis, the gauge climbed 4.7%, vs. +4.6% expected and +4.5% prior. Consumer Confidence Plunges, by the most in five years, according to the conference. The Conference Board’s gauge of confidence decreased 7.2 points to 92.9, data released Tuesday showed. The median estimate in a Bloomberg survey of economists called for a reading of 94. The soft data for the economy continues to look horrific. FedEx Gets Crushed, another early recession indicator. Fewer things are shipped in shrinking economies. Fears about a U.S. recession and President Donald Trump’s new reciprocal tariff rates starting April 2 could threaten FedEx’s earnings, Paterson said in a Friday note to clients. Memphis-based FedEx is generally regarded as a barometer of the global economy, as its business touches a wide variety of global industries.
Next-Gen Chips are Power Hogs. Big tech companies, which are all betting heavily on AI, will undoubtedly buy those chips, even if the price skyrockets. But there’s growing evidence that there won’t be enough electricity to power all of their AI dreams. Some new AI apps use 150 times more power than the old ones. My Ten-Year View – A Reassessment
We have to substantially downsize our expectations of equity returns in view of the election outcome. My new American Golden Age, or the next Roaring Twenties is now looking at multiple gale-force headwinds. The economy will completely stop decarbonizing. Technology innovation will slow. Trade wars will exact a high price. Inflation will return. The Dow Average will rise by 600% to 240,000 or more in the coming decade. The new America will be far more efficient and profitable than the old. My Dow 240,000 target has been pushed back to 2035.
On Monday, March 31, at 8:30 AM EST, the Chicago PMI is announced.
On Tuesday, April 1, at 8:30 AM, the JOLTS Job Openings Report isreleased.
On Wednesday, April 2, at 1:00 PM, the ADP Employment Change is published.
On Thursday, April 3, at 8:30 AM, the Weekly Jobless Claims are disclosed. We also get the final report for Q1 GDP.
On Friday, April 4, at 8:30 AM, the Nonfarm Payroll Report for March is printed. At 2:00 PM, the Baker Hughes Rig Count is printed.
As for me, back in 2002, I flew to Iceland to do some research on the country’s national DNA sequencing program called Decode, which analyzed the genetic material of everyone in that tiny nation of 250,000. It was the boldest project yet in the field and had already led to several breakthrough discoveries.
Let me start by telling you the downside of visiting Iceland. In the country that has produced three Miss Universes over the last 50 years, suddenly you are the ugliest guy in the country. Because guess what? The men are beautiful as well, the descendants of Vikings who became stranded there after they cut down all the forests on the island for firewood, leaving nothing with which to build long boats.
I said they were beautiful, not smart.
Still, just looking is free and highly rewarding.
While I was there, I thought it would be fun to trek across Iceland from North to South in the spirit of Shackleton, Scott, and Amundsen. I went alone because, after all, how many people do you know who want to trek across Iceland? Besides, it was only 150 miles, or ten days to cross. A piece of cake really.
Near the trailhead, the scenery could have been a scene from Lord of the Rings, with undulating green hills, craggy rock formations, and miniature Icelandic ponies galloping in herds. It was nature in its most raw and pristine form. It was all breathtaking.
Most of the central part of Iceland is covered by a gigantic glacier over which a rough trail is marked by stakes planted in the snow every hundred meters. The problem arises when fog or blizzards set in, obscuring the next stake and making it too easy to get lost. Then you risk walking into a fumarole, a vent from the volcano under the ice, always covered by boiling water. About ten people a year die this way.
My strategy for avoiding this cruel fate was very simple. Walk 50 meters. If I could see the next stake, I would proceed. If I couldn’t, I pitched my tent and waited until the storm passed.
It worked.
Every 10 kilometers stood a stone rescue hut with a propane stove for adventurers caught out in storms. I thought they were for wimps but always camped nearby for the company.
One of the challenges in trekking near the North Pole is getting to sleep. That’s because the sun never sets and it's daylight all night long. The problem was easily solved with the blindfold that came with my Icelandic Air first-class seat.
I was 100 miles into my trek, approached my hut for the night, and opened the door to say hello to my new friends.
What I saw horrified me.
Inside was an entire German Girl Scout Troop spread out in their sleeping bags all with a particularly virulent case of the flu. In the middle was a girl lying on the floor, soaking wet and shivering, who had fallen into a glacier-fed river. She was clearly dying of hypothermia.
I was pissed and instantly went into Marine Corps Captain mode, barking out orders left and right. Fortunately, my German was still pretty good then, so I instructed every girl to get out of their sleeping bags and pile them on top of the freezing scout. I then told them to strip the girl of her wet clothes and reclothe her with dry replacements. They could have their bags back when she got warm. The great thing about Germans is that they are really good at following orders.
Next, I turned the stove burners up high to generate some heat. Then I rifled through backpacks and cooked up what food I could find, force-fed it into the scouts, and emptied my bottle of aspirin. For the adult leader, a woman in her thirties who was practically unconscious, I parted with my emergency supply of Jack Daniels.
By the next morning, the frozen girl was warm, the rest were recovering, and the leader was conscious. They thanked me profusely. I told them I was an American “Adler Scout” (Eagle Scout) and was just doing my job.
One of the girls cautiously moved forward and presented me with a small doll dressed in a traditional German Dirndl, which she said was her good luck charm. Since I was her good luck, I should have it. It was the girl who was freezing to death the day before.
Some 20 years later, I look back fondly on that trip and would love to do it again.
Anyone want to go to Iceland?
Iceland 2002
Good Luck and Good Trading,
John Thomas
CEO & Publisher
The Diary of a Mad Hedge Fund Trader
https://www.madhedgefundtrader.com/wp-content/uploads/2022/04/john-thomas-in-iceland.png506776april@madhedgefundtrader.comhttps://madhedgefundtrader.com/wp-content/uploads/2019/05/cropped-mad-hedge-logo-transparent-192x192_f9578834168ba24df3eb53916a12c882.pngapril@madhedgefundtrader.com2025-03-31 09:02:472025-03-31 17:14:14The Market Outlook for the Week Ahead, or Stagflation is On!
One of the most fascinating things I learned when I first joined the equity trading desk at Morgan Stanley during the early 1980s was how to parallel trade.
A customer order would come in to buy a million shares of General Motors (GM), and what did the in-house proprietary trading book do immediately?
It loaded the boat with the shares of Ford Motors (F).
When I asked about this tactic, I was taken away to a quiet corner of the office and read the riot act.
“This is how you legally front-run a customer,” I was told.
Buy (GM) in front of a customer order, and you will find yourself in Sing Sing shortly.
Ford (F), Toyota (TM), Nissan (NSANY), Daimler Benz (DDAIF), BMW (BMWYY), and Volkswagen (VWAPY), were all fair game.
The logic here was very simple.
Perhaps the client completed an exhaustive piece of research concluding that (GM) earnings were about to rise.
Or maybe a client's old boy network picked up some valuable insider information.
(GM) doesn’t do business in isolation. It has thousands of parts suppliers for a start. While whatever is good for (GM) is good for America, it is GREAT for the auto industry.
So through buying (F) on the back of a (GM) might not only match the (GM) share performance, it might even exceed it.
This is known as a Primary Parallel Trade.
This understanding led me on a lifelong quest to understand Cross Asset Class Correlations, which continues to this day.
Whenever you buy one thing, you buy another related thing as well, which might do considerably better.
I eventually made friends with a senior trader at Salomon Brothers while they were attempting to recruit me to run their Japanese desk.
I asked if this kind of legal front-running happened on their desk.
“Absolutely,” he responded. But he then took Cross Asset Class Correlations to a whole new level for me.
Not only did Salomon’s buy (F) in that situation, they also bought palladium (PALL).
I was puzzled. Why palladium?
Because palladium is the principal metal used in catalytic converters, it removes toxic emissions from car exhaust and has been required for every U.S.-manufactured car since 1975.
Lots of car sales, which the (GM) buying implied, ALSO meant lots of palladium buying.
And here’s the sweetener.
Palladium trading is relatively illiquid.
So, if you catch a surge in the price of this white metal, you would earn a multiple of what you would make on your boring old parallel (F) trade.
This is known in the trade as a Secondary Parallel Trade.
A few months later, Morgan Stanley sent me to an investment conference to represent the firm.
I was having lunch with a trader at Goldman Sachs (GS) who would later become a famous hedge fund manager, and asked him about the (GM)-(F)-(PALL) trade.
He said I would be an IDIOT not to take advantage of such correlations. Then he one-upped me.
You can do a Tertiary Parallel Trade here by buying mining equipment companies such as Caterpillar (CAT), Cummins (CMI), and Komatsu (KMTUY).
Since this guy was one of the smartest traders I ever ran into, I asked him if there was such a thing as a QuaternaryParallel Trade.
He answered “Abso******lutely,” as was his way.
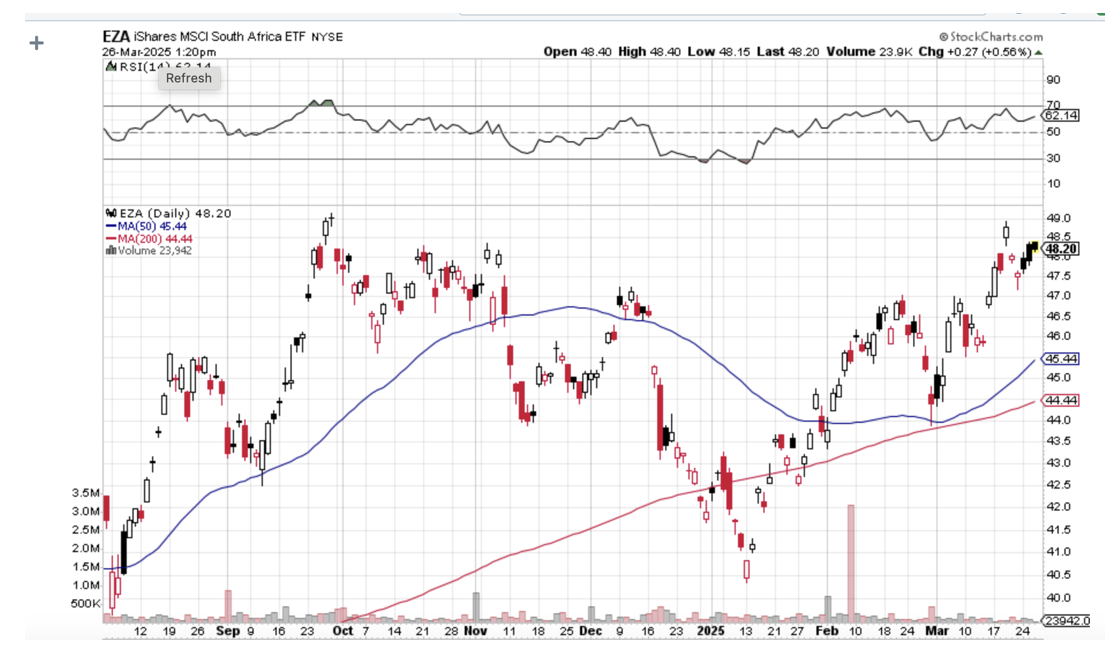
But the first thing he always did when searching for Quaternary Parallel Trades would be to buy the country ETF for the world’s largest supplier of the commodity in question.
In the case of palladium, that would be South Africa (EZA).
Since then, I have discovered hundreds of what I call Parallel Trading Chains and have been actively making money off of them. So have you, you just haven’t realized it yet.
I could go on and on.
If you ever become puzzled or confused about a trade alert I am sending out (Why on earth is he doing THAT?), there is often a parallel trade in play.
Do this for decades as I have and you learn that some parallel trades break down and die. The cross relationships no longer function.
The best example I can think of is the photography/silver connection. When the photography business was booming, silver prices rose smartly.
Digital photography wiped out this trade, and silver-based film development is still only used by a handful of professionals and hobbyists.
Oh, and Eastman Kodak (KODK) went bankrupt in 2012.
However, it seems that whenever one Parallel Trading Chain disappears, many more replace it.
You could build chains a mile long simply based on how well Apple (AAPL) or NVIDIA (NVDA) is doing.
And guess what? There is a new parallel trade in silver developing. Whenever someone builds a solar panel anywhere in the world, they use a small amount of silver for the wiring. Build several tens of millions of solar panels and that can add up to quite a lot of silver.
What goes around comes around.
Suffice it to say that parallel trading is an incredibly useful trading strategy.
Ignore it at your peril.
https://madhedgefundtrader.com/wp-content/uploads/2019/05/cropped-mad-hedge-logo-transparent-192x192_f9578834168ba24df3eb53916a12c882.png00MHFTRhttps://madhedgefundtrader.com/wp-content/uploads/2019/05/cropped-mad-hedge-logo-transparent-192x192_f9578834168ba24df3eb53916a12c882.pngMHFTR2025-03-27 09:02:392025-03-27 10:43:53How to Gain an Advantage with Parallel Trading
There is no doubt that the “underground” economy is growing.
No, I’m not talking about violent crime, drug dealing, or prostitution.
Those are all largely driven by demographics, which right now are at a low ebb.
I’m referring to the portion of the economy that the government can’t see and therefore is not counted in its daily data releases.
This is a big problem.
Most investors rely on economic data to dictate their trading strategies.
When the data is strong, they aggressively buy stocks, assuming that a healthy economy will boost corporate profits.
When data is weak, we get the flip side, and investors bail on equities. They also sell commodities, precious metals, and oil, and plow their spare cash into the bond market.
We are now halfway through a decade that has delivered unrelentingly low annual GDP growth, around the 2% to 2.5% level.
We all know the reasons. Retiring baby boomers, some 85 million of them, are a huge drag on the system, as they save and don’t spend.
Generation X-ers do spend, but there are only 58 million of them. And many Millennials are still living in their parents’ basements—broke and unable to land paying jobs in this ultra-cost-conscious world.
But what if these numbers were wrong? What if the Feds were missing a big part of the picture?
I believe this is, in fact, what is happening.
I think the economy is now evolving so fast, thanks to the simultaneous hyper-acceleration of multiple new technologies that the government is unable to keep up.
Further complicating matters is the fact that many new Internet services are FREE, and therefore are invisible to government statisticians.
They are, in effect, reading from a playbook that is decades or more old.
What if the economy was really growing at a 3% to 4% pace, but we just didn’t know it?
I’ll give you a good example.
The government’s Consumer Price Index is a basket of hundreds of different prices for the things we buy. But the Index rarely changes, while we do.
The figure the Index uses for Internet connections hasn’t changed in 20 years.
Gee, do you think that the price of broadband has risen in a decade, with the 1,000-fold increase in speeds?
In the early 2000s, you could barely watch a snippet of video on YouTube without your computer freezing up.
Now, I can live stream a two-hour movie in High Definition on my Comcast Xfinity 1 terabyte per second business line. And many people now watch movies on their iPhones. I see them in rush-hour traffic and on planes.
I’ll give you another example of the burgeoning black economy: Me.
My business shows up nowhere in the government economic data because it is entirely online. No bricks and mortar here!
Yet, I employ 15 people, provide services to thousands of individuals, institutions, and governments in 140 countries, and take in millions of dollars in revenues in the process.
I pay a lot of American taxes, too.
How many more MEs are out there? I would bet millions.
If the government were understating the strength of the economy, what would the stock market look like?
It would keep going up every year like clockwork, as ever-rising profits feed into stronger share prices.
But multiples would never get very high (now at 20 times earnings) because no one believed in the rally, since the visible economic data was so weak.
That would leave them constantly underweight equities in a bull market.
Stocks would miraculously and eternally climb a wall of worry, as they did until February.
On the other hand, bonds would remain strong as well, and interest rates low, because so many individuals and corporations were plowing excess, unexpected profits into fixed-income securities.
Structural deflation would also give them a big tailwind.
If any of this sounds familiar, please raise your hand.
I have been analyzing economic data for a half-century, so I am used to government statistics being incorrect.
It was a particular problem in emerging economies, like Japan and China, which were just getting a handle on what comprised their economies for the first time.
But to make this claim about the United States government, which has been counting things for 240 years, is a bit like saying the emperor has no clothes.
Sure, there has always been a lag between the government numbers and reality.
In the old days, they used horses to collect data, and during the Great Depression, numbers were kept on 3” X 5” index cards filled out with fountain pens.
But today, the disconnect is greater than it ever has been, by a large margin, thanks to technology.
Is this unbelievable?
Yes, but you better get used to the unbelievable.
There May Be More Here Than Meets the Eye
https://www.madhedgefundtrader.com/wp-content/uploads/2017/06/no-clothes.jpg392561MHFTRhttps://madhedgefundtrader.com/wp-content/uploads/2019/05/cropped-mad-hedge-logo-transparent-192x192_f9578834168ba24df3eb53916a12c882.pngMHFTR2025-03-26 09:02:472025-03-26 10:13:32Why The "Underground" Economy is Growing So Fast
It’s official: Absolutely no one is confident in their long-term economic forecasts right now. I heard it from none other than the chairman of the Federal Reserve himself. The investment rule book has been run through the shredder.
It has in fact been deleted.
That explains a lot about how markets have been trading this year. It looks like it is going to be a reversion to the mean year. Forecasters, strategists, and gurus alike are rapidly paring down their stock performance targets for 2025 to zero.
When someone calls the fire department, it’s safe to assume that there is a fire out there somewhere. That’s what Fed governor Jay Powell did last week. It raises the question of what Jay Powell really knows that we don’t. Given the opportunity, markets will always assume the worst, that there’s not only a fire, but a major conflagration about to engulf us all. Jay Powell’s judicious comments last week certainly had the flavor of a president breathing down the back of his neck.
It's interesting that a government that ran on deficit reduction pressured the Fed to end quantitative tightening. That’s easing the money supply through the back door.
For those unfamiliar with the ins and outs of monetary policy, let me explain to you how this works.
Since the 2008 financial crisis, the Fed bought $9.1 trillion worth of debt securities from the US Treasury, a policy known as “quantitative easing”. This lowers interest rates and helps stimulate the economy when it needs it the most. “Quantitative easing” continued for 15 years through the 2020 pandemic, reaching a peak of $9.1 trillion by 2022. For beginners who want to know more about “quantitative easing” in simple terms,please watch this very funny video.
The problem is that an astronomically high Fed balance sheet like the one we have now is bad for the economy in the long term. They create bubbles in financial assets, inflation, and malinvestment in risky things like cryptocurrencies. That’s why the Fed has been trying to whittle down its enormous balance sheet since 2022.
By letting ten-year Treasury bonds it holds expire instead of rolling them over with new issues, the Fed is effectively shrinking the money supply. This is how the Fed has managed to reduce its balance sheet from $9.1 trillion three years ago to $6.7 trillion today and to near zero eventually. This is known as “quantitative tightening.” At its peak a year ago, the Fed was executing $120 billion a month quantitative tightening.
By cutting quantitative tightening, from $25 billion a month to only $5 billion a month, or effectively zero, the Fed has suddenly started supporting asset prices like stocks and increasing inflation. At least that is how the markets took it to mean by rallying last week.
Why did the Fed do this?
To head off a coming recession. Oops, there’s that politically incorrect “R” word again! This isn’t me smoking California’s largest export. Powell later provided the forecasts that back up this analysis. The Fed expects GDP growth to drop from 2.8% to 1.7% and inflation to rise from 2.5% to 2.8% by the end of this year. That’s called deflation. Private sector forecasts are much worse.
Just to be ultra clear here, the Fed is currently engaging in neither “quantitative easing nor “quantitative tightening,” it is only giving press conferences.
Bottom line: Keep selling stock rallies and buying bonds and gold on dips.
Another discussion you will hear a lot about is the debate over hard data versus soft data.
I’ll skip all the jokes about senior citizens and cut to the chase. Soft data are opinion polls, which are notoriously unreliable, fickle, and can flip back and forth between positive and negative. A good example is the University of Michigan Consumer Confidence, which last week posted its sharpest drop in its history. Consumers are panicking. The problem is that this is the first data series we get and is the only thing we forecasters can hang our hats on.
Hard data are actual reported numbers after the fact, like GDP growth, Unemployment Rates, and Consumer Price Indexes. The problem with hard data is that they can lag one to three months, and sometimes a whole year. This is why by the time a recession is confirmed by the hard data, it is usually over. Hard data often follows soft data, but not always, which is why both investors and politicians in Washington DC are freaking out now.
Bottom line: Keep selling stock rallies and buying bonds and gold (GLD) on dips.
A question I am getting a lot these days is what to buy at the next market bottom, whether that takes place in 2025 or 2026. It’s very simple. You dance with the guy who brought you to the dance. Those are:
Best Quality Big Tech: (NVDA), (GOOGL), (AAPL), (META), (AMZN)
Big tech is justified by Nvidia CEO Jensen Huang’s comment last week that there will be $1 trillion in Artificial Intelligence capital spending by the end of 2028. While we argue over trade wars, AI technology and earnings are accelerating.
Cybersecurity: (PANW), (ZS), (CYBR), (FTNT)
Never goes out of style, never sees customers cut spending, and is growing as fast as AI.
Best Retailer: (COST)
Costco is a permanent earnings compounder. You should have at least one of those.
Best Big Pharma: (AMGN), (ABBV), (BMY)
Big pharma acts as a safety play, is cheap, and acts as a hedge for the three sectors above.
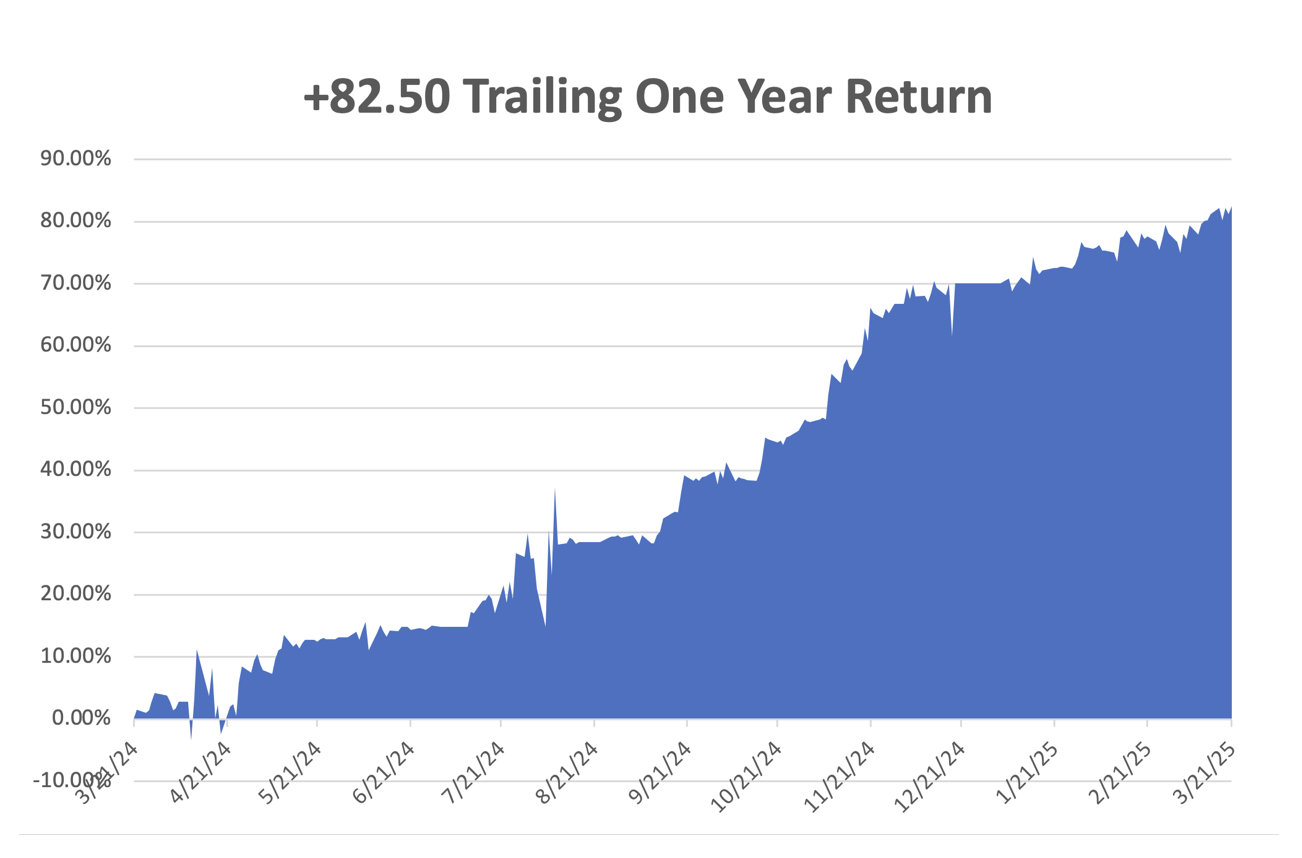
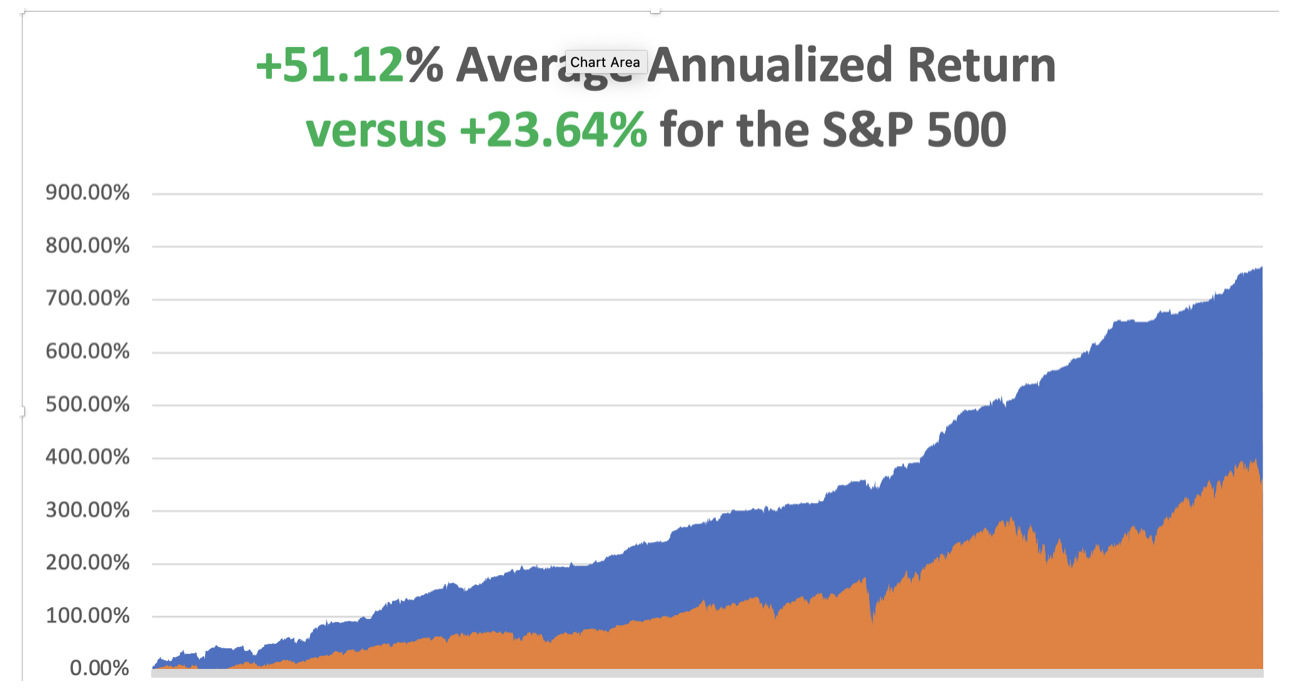
March is now up +2.92% so far. That takes us to a year-to-date profit of +12.29% in 2025. That means Mad Hedge has been operating as a perfect -1X short S&P 500 ETF since the February top. My trailing one-year return stands at a spectacular +82.50%. That takes my average annualized return to +51.12%and my performance since inception to +764.28%.
It has been another busy week for trading. I had four March positions expire at their maximum profit points on the Friday options expiration, shorts in (GM), and longs in (GLD), (SH), and (NVDA). I added new longs in (TSLA) and (NVDA). This is in addition to my existing longs in the (TLT) and shorts in (TSLA), (NVDA), and (GM).
Some 63 of my 70 round trips, or 90%, were profitable in 2023. Some 74 of 94 trades have been profitable in 2024, and several of those losses were really break-even. That is a success rate of +78.72%.
UCLA Andersen School of Business announced a “Recession Watch,” the first ever issued. UCLA, which has been issuing forecasts since 1952, said the administration’s tariff and immigration policies and plans to reduce the federal workforce could combine to cause the economy to contract. Recessions occur when multiple sectors of the economy contract at the same time.
Retail Sales Fade, with consumers battening down the hatches for the approaching economic storm. Retail sales rose by less than forecast in February and the prior month was revised down to mark the biggest drop since July 2021.
This Has Been One of the Most Rapid Corrections in History, leaving no time to readjust portfolios and put on short positions.
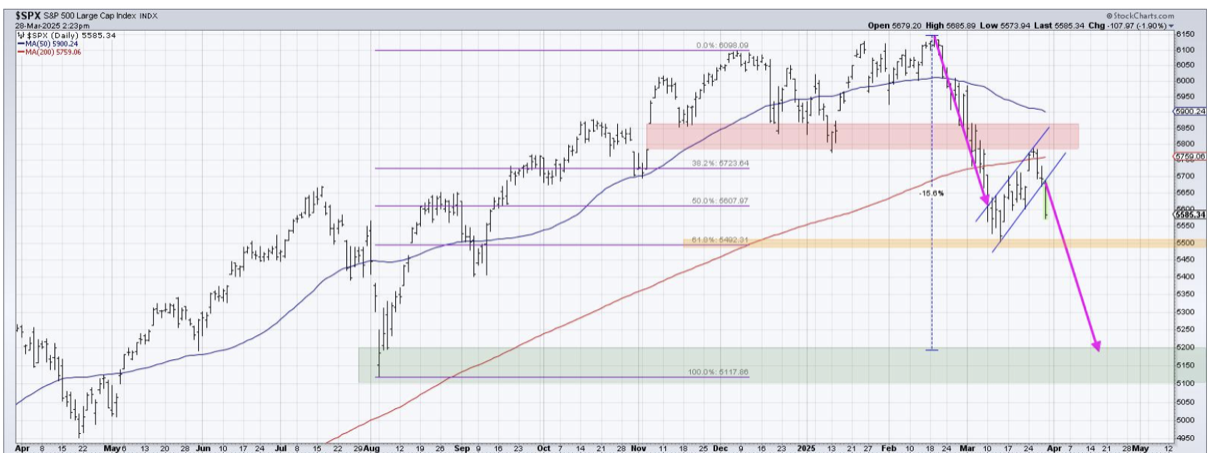
The rapid descent in the S&P 500 is unusual, given that it was accomplished in just 22 calendar days, far shorter than the average of 80 days in 38 other examples of declines of 10% or more going back to World War II.
Home Builder Sentiment Craters to a seven-month low in March as tariffs on imported materials raised construction costs, a survey showed on Monday. The National Association of Home Builders/Wells Fargo Housing Market Index dropped three points to 39 this month, the lowest level since August 2024. Economists polled by Reuters had forecast the index at 42, well below the boom/bust level of 50.
BYD Motors (BYDDF) Shares Rocket, up 72% this year, on news of technology that it claims can charge electric vehicles almost as quickly as it takes to fill a gasoline car. BYD on Monday unveiled a new “Super e-Platform” technology, which it says will be capable of peak charging speeds of 1,000 kilowatts/hr. The EV giant and Tesla rival say this will allow cars that use the technology to achieve 400 kilometers (roughly 249 miles) of range with just 5 minutes of charging. Buy BYD on dips. It’s going up faster than Tesla is going down.
Weekly Jobless Claims Rise 2,000, to 223,000. The number of Americans filing new applications for unemployment benefits increased slightly last week, suggesting the labor market remained stable in March, though the outlook is darkening amid rising trade tensions and deep cuts in government spending.
Copper Hits New All-Time High, at $5.02 a pound. The red metal has outperformed gold by 25% to 15% YTD. It’s now a global economic recovery that is doing this, but flight to safety. Chinese savers are stockpiling copper ingots and storing them at home distrusting their own banks, currency, and government. I have been a long-term copper bull for years as you well know. New copper tariffs are also pushing prices up. Buy (FCX) on dips, the world’s largest producer of element 29 on the Periodic Table.
Boeing (BA) Beats Lockheed for Next Gen Fighter Contract for the F-47, beating out rival Lockheed Martin (LMT) for the multibillion-dollar program. Unusually, Trump announced the decision Friday morning at the White House alongside Defense Secretary Pete Hegseth. Boeing shares rose 5.7% while Lockheed erased earlier gains to fall 6.8%. The deal raises more questions than answers, in the wake of (BA) stranding astronauts in space, their 737 MAX crashes, and a new Air Force One that is years late. Was politics involved? You have to ask this question about every deal from now on.
Carnival Cruise Lines (CCL) Raises Forecasts, on burgeoning demand from vacationers, including me. The company’s published cruises are now 80% booked. Cruise lines continue to hammer away at the value travel proposition they are offering. However, the threat of heavy port taxes from the administration looms over the sector.
My Ten-Year View – A Reassessment
We have to substantially downsize our expectations of equity returns in view of the election outcome. My new American Golden Age, or the next Roaring Twenties is now looking at multiple gale-force headwinds. The economy will completely stop decarbonizing. Technology innovation will slow. Trade wars will exact a high price. Inflation will return. The Dow Average will rise by 600% to 240,000 or more in the coming decade. The new America will be far more efficient and profitable than the old. My Dow 240,000 target has been pushed back to 2035.
On Monday, March 24, at 8:30 AM EST, the S&P Global Flash PMI is announced.
On Tuesday, March 25, at 8:30 AM, the S&P Case Shiller National Home Price Index isreleased.
On Wednesday, March 26, at 1:00 PM, the Durable Goods are published.
On Thursday, March 27, at 8:30 AM, the Weekly Jobless Claims are disclosed. We also get the final report for Q1 GDP.
On Friday, March 28, the Core PCE is released, and important inflation indicator. At 2:00 PM, the Baker Hughes Rig Count is printed.
As for me, I received calls from six readers last week saying I remind them of Ernest Hemingway. This, no doubt, was the result of Ken Burns’ excellent documentary about the Nobel Prize-winning writer on PBS last week.
It is no accident.
My grandfather drove for the Italian Red Cross on the Alpine front during WWI, where Hemingway got his start, so we had a connection right there.
Since I read Hemingway’s books in my mid-teens I decided I wanted to be him and became a war correspondent. In those days, you traveled by ship a lot, leaving ample time to finish off his complete work.
I visited his homes in Key West, Cuba, and Ketchum Idaho.
I used to stay in the Hemingway Suite at the Ritz Hotel on Place Vendome in Paris where he lived during WWII. I had drinks at the Hemingway Bar downstairs where war correspondent Ernest shot a German colonel in the face at point-blank range. I still have the ashtrays.
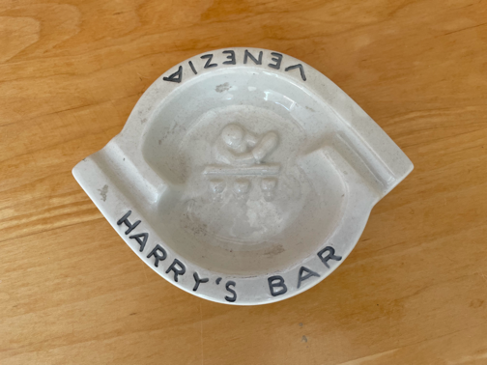
Harry’s Bar in Venice, a Hemingway favorite, was a regular stopping-off point for me. I have those ashtrays too.
I even dated his granddaughter from his first wife, Hadley, the movie star Mariel Hemingway, before she got married, and when she was also being pursued by Robert de Niro and Woody Allen. Some genes skip generations and she was a dead ringer for her grandfather. She was the only Playboy centerfold I ever went out with. We still keep in touch.
So, I’ll spend the weekend watching Farewell to Arms….again, after I finish my writing.
Oh, and if you visit the Ritz Hotel today, you’ll find the ashtrays are now glued to the tables.
As for last summer, I stayed in the Hemingway Suite at the Hotel Post in Cortina d’Ampezzo Italy where he stayed in the late 1940’s to finish a book. Maybe some inspiration will run off on me.
Hemingway’s Living Room in Cuba, Untouched Since 1960
Earnest in 1918
Typing at Hemingway’s Typewriter in Italy from the 1940’s
The Red Cross Uniform Hemingway Wore when He was Blown Up in 1917
Good Luck and Good Trading
John Thomas
CEO & Publisher
The Diary of a Mad Hedge Fund Trader
https://www.madhedgefundtrader.com/wp-content/uploads/2024/01/John-thomas-typewriter.png11861124april@madhedgefundtrader.comhttps://madhedgefundtrader.com/wp-content/uploads/2019/05/cropped-mad-hedge-logo-transparent-192x192_f9578834168ba24df3eb53916a12c882.pngapril@madhedgefundtrader.com2025-03-24 09:02:532025-03-24 13:19:15The Market Outlook for the Week Ahead, or The Special No Confidence Issue
Below please find subscribers’ Q&A for the March 19 Mad Hedge Fund Trader Global Strategy Webinar, broadcast from Incline Village, NV.
Q: I tried to get into ProShares Short S&P500 (SH), it seems pretty illiquid. How did you get in?
A: Well, before I actually sent out the trade alert, I tested the liquidity of the SH seeing if you could get anything done. This is an easy thing to buy on up days in the market when others are taking profits. It is a really difficult thing to get into on down days in the market because you have so many long-only mutual funds trying to hedge their exposure through buying the (SH). We literally had just one up day at the beginning of the month, and I was able to increase my position tenfold and had no trouble getting my price on the LEAPS at $0.50. If you waited one day, you would have had to pay $0.60 for the same position, and that’s because the volatility explodes on this thing. If you look at the charts, the 1x short play has actually delivered enormous returns, as well as the 2x. It’s outperforming 2 to 1. So you have to buy when other people are selling, that’s the only way to get in and out of the (SH). Of course, I’m buying these things with the intention of running these to expiration.
Q: Is it time to sell US stocks?
A: Yes but only on the up days like today. Don’t sell into a pit, don’t sell into bottoms—wait for rally days like today. That's a good place to reduce risk and add some short positions like the ProShares Short S&P500 (SH) and the ProShares UltraShort S&P500 (SDS).
Q: How did you miss the rotation to Europe and China in emerging markets?
A: Very simple—if you ignore something for 15 years, it’s easy to miss a turn. I also missed the turn in Japan, which I ignored for 35 years. The real reason though is that I underestimated the extremity of this government, its economic policies, and the chaos it would create. I think almost everyone underestimated what the new government would actually do and how it would affect the stock market. If I knew ahead of time that the government would adopt recessionary policies, I would have done everything to get my money out of the US and into Europe and China, but this kind of unfolded with a shock a day, sometimes a shock an hour, and markets don’t like shocks and surprises, so they sold off. The more a stock had gone up in the last six months, the more it went down when the new government came into office.
Q: What are your downside targets for the market?
A: Now that we are in recession, I think any 5% rally off the recent low at 5500, you want to sell. The market could rally 3-5% off the bottom—that would be half of the recent loss. Then you’d want to get rid of more longs, cut your portfolio down to a few very high-quality positions, and add downside protection by buying the ProShares Short S&P500 (SH), the ProShares UltraShort S&P500 (SDS), doing buy rights on the calls and buying outright puts. That would be my recommendation. Eventually I see the S&P 500 falling to 5,000 by the summer, and if I’m wrong, it’s going down 30% to 4,500. That is a deep recession scenario, which we are on the track for unless the government suddenly reverses its draconian policies. This is the most extreme government in American history.
Q: Are you going to use the selloff to get into Costco (COST) after a 20% selloff?
A: Absolutely. I’ve been trying to get into Costco for years and it’s just always been too expensive. They keep increasing earnings every year —investors are willing to pay very high multiples for that. This time around, I am going to get into Costco because they are an absolutely outstanding company. By the way, my mentor at Morgan Stanley was a guy named Barton Biggs, who created the asset management division some 40 years ago. He was close friends with Sam Walton, the founder of Walmart, and Sam Walton was a huge admirer of Costco, which was just starting up then. I’m surprised they never took over the company, which is too big to take over now.
Q: What to buy at the bottom?
A: You want to buy what was leading right before we went into this collapse. Those are financials, and the highest quality profit making of the Mag7 which include Nvidia (NVDA), Amazon (AMZN), Alphabet (GOOGL), Meta (META), as well as cybersecurity stocks like Palo Alto Networks (PANW), Fortinet (FTNT), Zscaler (ZS) and so on.
Q: Why are you making your recession call when we have no evidence of that fact?
A: If you wait for proof of recession, that often is the market bottom. And that could be August of this year. You know, I talk to hundreds of businessmen around the world, and everyone is saying business is slowing. Companies stop making decisions. Customers stop buying. Everyone's afraid of the tariffs. Nobody knows what's going to happen next. Business confidence is terrible. That adds up to a recession, but data tends to move very slowly, so we won't see it in the data for months. If you're a stock trader, you don't have the luxury of waiting for confirmation of the data. By the time you get it, the move is over. But if you cut half of government spending or 12% of GDP, the recession outcome is guaranteed. It's not a speculation. That is the government's goal: to cause a recession, so they can have a recovery going into the next election to take credit for.
Q: If Alphabet (GOOGL) is broken up, what will happen to the company?
A: With all of these big tech breakups, the parts will be worth a lot more than the whole. The individual pieces can be sold off at much bigger premiums creating new companies with more stock liquidity. This is what happened with AT&T (T) in 1982. I participated in that, and the parts were worth more than the original AT&T was within two years. I expect that to happen to Alphabet, and I expect that to happen if Amazon (AMZN) is broken up— eventually, these companies become so big, they become too big to manage. And if the management sees they can get 100% premium on a spinoff, they'll take it so fast it makes your head spin.
Q: None of the 90% gain in stock prices during the Biden administration was a result of his policies.
A: That's absolutely correct. He stayed out of the way, which is the best thing that governments can do—get the hell out of the way. American capitalism on its own will innovate and create profits far faster than any other economic system in history. Biden did quite a good job of staying away.
Q: Why are credit spreads still okay to do in this environment?
A: Because the implied volatility on the options are so high, you can get insane amounts of money—in the money like 30% or 40% —and get trades done and have a 0% chance of taking a loss on that. Suddenly you're being paid double to take risks on these option trades. The classic example is the $88-$90 call spread in Nvidia (NVDA), which we have expiring on Friday, March 21. We never even got close to $90, but the implied volatility on the day we added that trade was a ridiculous 75%. So, it's almost impossible to lose money when you put on trades with implied volatility in the options of 75%.
Q: What's your long-term target on gold now that your last long-term target of 3,000 finally got hit?
A: Yes, we've been recommending gold (GLD) for seven years now. In that time, it's doubled: $1,500 to $3,000. I'm now looking for $5,000 in gold by 2030, in five years. I got a feeling that flight-to-safety plays are going to be very popular in the world going forward. And by the way, people who did look for Bitcoin to protect them in any downturns: Bitcoin actually went down three times faster than the S&P 500 in the last month.
Q: Will stocks rise if the Fed cuts interest rates?
A: No, they won't, because the only reason the Fed will cut interest rates is if inflation falls, and right now, inflation is about to see a big upturn as those import duties of 25% or 50% work their way through the system. A lot of companies are front-running price increases before they even pay the tariffs and try to carve out some extra margin for themselves in advance. On Wednesday, Jay Powell said he expects inflation to rise from 2.5% to 2.8% by yearend and this will prove to be a low number. That is his “president breathing down the back of his next” forecast.
Q: What are your favorite Chinese stocks?
A: Well, a lot of these leading stocks have already gone up 50% or more since the beginning of the year as capital flees the United States and goes abroad. But if you held a gun to my head and said you had to buy two, I would buy Baidu (BIDU), and I would buy Alibaba (BABA). Those would be my Chinese picks. Alibaba is the closest thing you get to an Amazon in China.
Q: Has the dollar hit its lows this year?
A: No. Risk of the next Fed rate move is an interest rate cut. That is going to hang over the dollar and the currency markets for the entire year. And I don't see any recovery in the dollar this year. In fact, it's easy to see much lower lows, and higher highs in the foreign currencies. Buy (FXA), (FXE), (FXC), and (FXB) on dips.
Q: How do you feel about natural gas?
A: I would not be a buyer here. I think we've had a terrific run off of extreme cold weather—believe me, we got some of that in Nevada too—and that is starting to fade now. This is historically when that gas starts to fade for the year. Long term, my view on gas is bullish because of increased exports to China. We have a very pro-energy administration here; that means taking off the export restraints on natural gas, which can only be good for the gas companies and the gas price. China has basically told us they'll take all the natural gas they can get from us because every shipload of gas they buy (LNG) means less coal they have to burn.
To watch a replay of this webinar with all the charts, bells, whistles, and classic rock music, just log in to www.madhedgefundtrader.com, go to MY ACCOUNT, click on GLOBAL TRADING DISPATCH, then WEBINARS, and all the webinars from the last 12 years are there in all their glory.
Good Luck and Good Trading
John Thomas
CEO & Publisher
The Diary of a Mad Hedge Fund Trader
The original purpose of this letter was to build a database of ideas to draw on in the management of my hedge fund.
When a certain trade comes into play, I merely type in the symbol, name, currency, or commodity into the search box, and the entire fundamental argument in favor of that position pops up.
You can do the same. Just type anything into the search box with the little magnifying glass in the upper right-hand corner of my home page, and a cornucopia of data, charts, and opinions will appear.
Even the prices of camels in India (click here to find out why they’re going up).
The database goes back to February 2008, totaling 4 million words.Watching the traffic over time, I can tell you how the database is being used:
1) Small hedge funds want to see what the large hedge funds are doing.
2) Large hedge funds look to see what they have missed, which is usually nothing.
3) Midwestern advisors to find out what is happening in New York and Chicago.
4) American investors to find out if there are any opportunities overseas (there always are).
5) Foreign investors to find out what the heck is happening in the US (about 1,000 inquiries a day come in through Google’s translation software).
6) Specialist traders in stocks, bonds, currencies, commodities, and precious metals looking for cross-market insights which will give them a trading advantage with their own book.
7) High net-worth individuals managing their own portfolios so they don’t get screwed on management fees.
8) Low net worth individuals, students, and the military looking to expand their knowledge of financial markets (lots of free online time in the Navy).
9) People at the Treasury and the Fed trying to find out what the private sector is doing.
10) Staff at the SEC and the CFTC to see if there is anything new they should be regulating.
11) More staff at the Congress and the Senate looking for new hot-button issues to distort and obfuscate.
12) Yet, even more staff in Obama’s office gauging his popularity and the reception of his policies.
13) As far as I know, no justices at the Supreme Court read my letter. They’re all closet indexers.
14) Potential investors/subscribers attempting to ascertain if I have the slightest idea of what I am talking about.
15) Me trying to remember trades that I recommended long ago, but have forgotten.
16) Me looking for trades that worked so I can say ‘I told you so.’
It’s there, it’s free, so please use it.
https://madhedgefundtrader.com/wp-content/uploads/2019/05/cropped-mad-hedge-logo-transparent-192x192_f9578834168ba24df3eb53916a12c882.png00april@madhedgefundtrader.comhttps://madhedgefundtrader.com/wp-content/uploads/2019/05/cropped-mad-hedge-logo-transparent-192x192_f9578834168ba24df3eb53916a12c882.pngapril@madhedgefundtrader.com2025-03-20 09:02:012025-03-20 10:09:28Please Use My Free Database Search
Legal Disclaimer
There is a very high degree of risk involved in trading. Past results are not indicative of future returns. MadHedgeFundTrader.com and all individuals affiliated with this site assume no responsibilities for your trading and investment results. The indicators, strategies, columns, articles and all other features are for educational purposes only and should not be construed as investment advice. Information for futures trading observations are obtained from sources believed to be reliable, but we do not warrant its completeness or accuracy, or warrant any results from the use of the information. Your use of the trading observations is entirely at your own risk and it is your sole responsibility to evaluate the accuracy, completeness and usefulness of the information. You must assess the risk of any trade with your broker and make your own independent decisions regarding any securities mentioned herein. Affiliates of MadHedgeFundTrader.com may have a position or effect transactions in the securities described herein (or options thereon) and/or otherwise employ trading strategies that may be consistent or inconsistent with the provided strategies.