Featured Trade:
(DON'T MISS THE MAY 9 GLOBAL STRATEGY WEBINAR),
(A DAY IN THE LIFE OF THE MAD HEDGE FUND TRADER),
(SPY), (TLT), (TBT), (FXE),(GLD), (GDX), (USO),
(AMLP), (STBX), (NFLX), (DIS), (AAPL), (GM)
My next global strategy webinar will be held live from Silicon Valley on Wednesday, May 9, at 12:00 PM EST.
Co-hosting the show will Mad Day Trader?Bill Davis.
I'll be giving you my updated outlook on stocks, bonds, commodities, currencies, precious metal, and real estate.
The goal is to find the cheapest assets in the world to buy, the most expensive to sell short, and the appropriate securities with which to take these positions.
I will also be opining on recent political events around the world and the investment implications therein.
I usually include some charts to highlight the most interesting new developments in the capital markets. There will be a live chat window with which you can pose your own questions.
The webinar will last 45 minutes to an hour. International readers who are unable to participate in the webinar live will find it posted on my website within a few hours.
I look forward to hearing from you.
To register for the webinar, please click on the link we emailed you entitled, "Next Bi-Weekly Webinar - May 9, 2018" or click here.
https://www.madhedgefundtrader.com/wp-content/uploads/2018/04/John-Thomas.jpg337369MHFTRhttps://madhedgefundtrader.com/wp-content/uploads/2019/05/cropped-mad-hedge-logo-transparent-192x192_f9578834168ba24df3eb53916a12c882.pngMHFTR2018-05-04 01:07:262018-05-04 01:07:26Don't Miss the May 9 Global Strategy Webinar
Everyone who has been reading this letter for the past decade (yes, there are quite a few of you), know that I am a fundamentalist first and a technician second.
Of course, you need to use both, as those who mistakenly leave one tool in the bag reliably underperform indexes.
The one-liner here is that I use fundamentals to identify broad, long-term, even epochal trends, and technicals for the short-term timing of my Trade Alerts.
Do both well, and you will prosper mightily.
Strategists often like to cloak themselves in the fundamental or technical mantels alone. But parse their words carefully, and the best fundamentalists talk about support and resistance levels, while the ace technicians refer to the latest economic data points.
The reality is that the best of the best are using both all the time. The differential titles have more to do with marketing purposes than anything else.
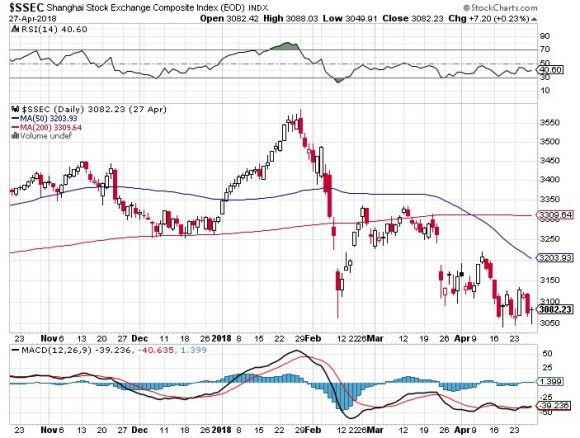
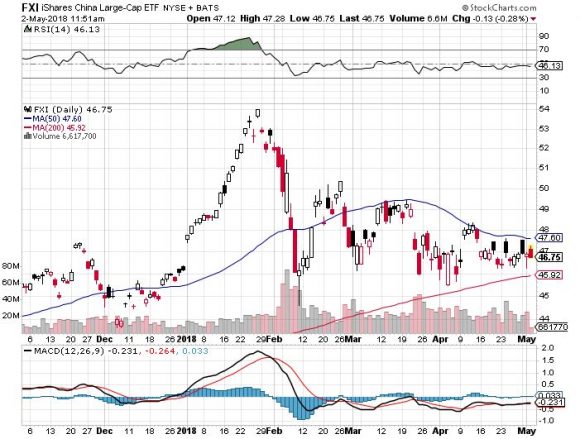
Having said all that, you better take a good, hard look at the chart below for the Shanghai Stock Exchange Composite Index ($SSEC). The 2016 low has held and the long-term uptrend lives.
My bet is that it resolves to the upside. All it would be doing then is coming in line with the rest of the global equity markets, including those of many emerging markets.
Since the last top, the earnings multiple of Chinese companies has plunged, from 35 times to a mere 15 times. This means that the 6.5% a year growing economy (China) is trading at a lower multiple than the 2.3% a year growing one (the U.S.). The big question among strategists since 2009 has been how far these valuations would diverge.
If I am right, then you can expect a rally of at least 25% in the Shanghai market soon, and more in peripheral markets, such as Hong Kong (EWH) and in single Chinese names. My bet is that it starts in August, when the current correction ends and we resume the year-end ramp-up.
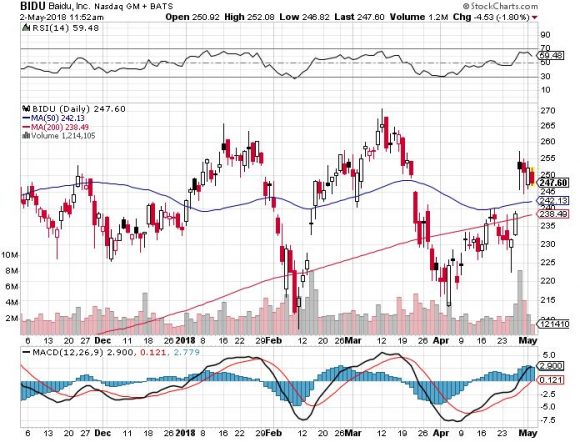
You should place a laser-like focus on the Chinese Internet sector, so you won't go wrong picking up some Baidu (BIDU) around $180, if you can get it (click here for my original recommendation to buy the stock at $12 nine years ago).
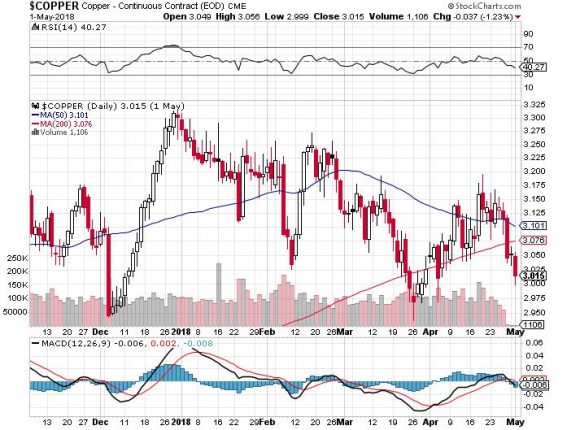
If you are looking for further confirmation of the coming bull move in China across asset classes, please peruse the chart below for copper. The red metal has one of the closest correlations out there with the fate of the Middle Kingdom's economy and stock markets. It appears to be breaking out of a major five-year downtrend as well.
The other nice thing about this scenario is that it provides more fodder for my expectation of another global bull market move in the fall, when you can expect major indexes to tack on another 10% by year-end.
Jim Chanos, watch your back!
https://www.madhedgefundtrader.com/wp-content/uploads/2018/05/Man-in-China-story-2-image-6.jpg225336MHFTRhttps://madhedgefundtrader.com/wp-content/uploads/2019/05/cropped-mad-hedge-logo-transparent-192x192_f9578834168ba24df3eb53916a12c882.pngMHFTR2018-05-03 01:06:152018-05-03 01:06:15Don't Be Short China Here
"I can calculate the motions of heavenly bodies, but never the madness of crowds," said Sir Isaac Newton, the inventor of calculus and discoverer of Newton's Laws, who lost his entire fortune in a 17th century investment scam called "the South Sea Bubble."
https://www.madhedgefundtrader.com/wp-content/uploads/2018/05/Issac-Newton-quote-of-the-day.jpg137129MHFTRhttps://madhedgefundtrader.com/wp-content/uploads/2019/05/cropped-mad-hedge-logo-transparent-192x192_f9578834168ba24df3eb53916a12c882.pngMHFTR2018-05-03 01:05:102018-05-03 01:05:10May 3, 2018 - Quote of the Day
Featured Trade:
(TRADING THE U.S. STEEL FIASCO),
(X), (XLI), (TSLA), (BA)
(ANNOUNCING THE MAD HEDGE LAKE TAHOE, NEVADA, CONFERENCE, OCTOBER 26-27, 2018) (THE COOLEST TOMBSTONE CONTEST)
Talk about unintended consequences. Tamper with the free market and it will usually blow up in your face.
You would have thought that U.S. Steel was going to announce blockbuster earnings in the wake of the new 25% steel tariff imposed by the administration, right?
Wrong.
Instead, it has triggered a disaster of epic proportions. The reasons why provide a crash course on how fast the modern economy is evolving.
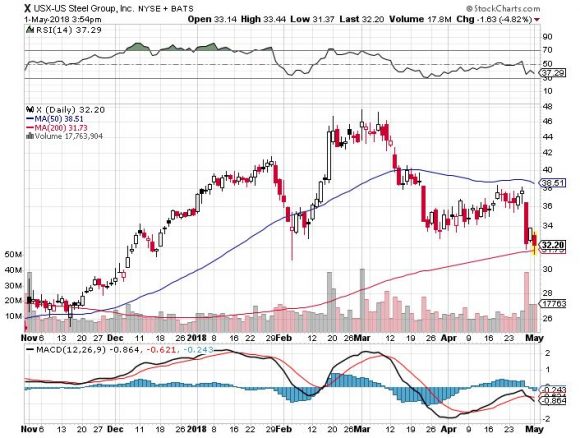
Of course, the stock market didn't like it, the shares crashing some 17.1% since the announcement. U.S. Steel, far and away the biggest beneficiary of administration policies, is now down on the year.
You may recall that we made a fortune when we bought U.S. Steel last summer at $21 a share, well before the run up into the passage of the tax package. The shares gained a mind-blowing 127%.
Not only did the company deliver a shocking disappointment on Q1 earnings, bringing in net profits of only 10 cents a share, it guided lower for Q2. Expectations had been far higher. Still, that is far better than the $180 million loss it brought in a year ago.
The CEO, David Burritt, cited unexpected "operational volatility." Take that to mean the chaos created by the steel tariffs. There is also trouble with its Great Lakes factory.
Flat rolled steel used to manufacture cars swung from an $88 million loss to a $23 million profit. But tubular steel used for pipelines incurred a $23 million loss.
What is really amazing is that the company made only a dime per share off an increase in total steel shipments YOY of 15.6%. Clearly, there is trouble in Pittsburgh.
And here is what U.S. Steel didn't expect. Instead of paying the extra 25% for imported steel, many customers are simply designing steel out of their products to cut costs rather than shifting to (X).
Three decades ago, this might have taken years to achieve. Thanks to advanced software applications this can now be accomplished in weeks. Companies are vastly more sensitive to costs than they were only a few years ago, and mere pennies can make all the difference.
It's only a matter of time before the entire auto industry shifts to carbon fiber, which has four times the strength of steel at one fifth the weight. That gives you a 20X improvement in performance and safety. Cost and mass manufacturing are the only issues.
Tesla (TSLA) is planning to make the jump in a couple of years. Boeing (BA) and the U.S. Air Force already have.
Where is U.S. Steel in a carbon fiber world? Try Chapter 11.
In the meantime, U.S. Steel consumers are scrambling to get exemptions from the punitive tariffs, creating a bureaucratic nightmare for all involved.
Wilber Ross's Commerce Department has been flooded with some 3,500 requests, each one of which takes months to review. The agency has boosted staff, but it is still overwhelmed. It looks like the only new American jobs the tariff will create will be government ones.
It turns out that many types of high grade steel, such as for razor blades and specialized carbon steel parts, aren't made in the U.S.
To prove that I learn something new every day, I discovered that even France is an important steel supplier. And I thought it was all about wine, cheese, and those cute black berets.
The net result for consumers has been uncertainty in the extreme. That purgatory has just been extended with the government's 30-day postponement of the tariffs announced yesterday.
If companies wait long enough the tariffs will simply disappear. They will certainly be declared illegal by the World Trade Organization.
The national security rationale for the steel tariffs was always completely bogus and will be laughed out of court. If steel really were a national security issue the Defense Department would have its own steel mill, as it already does with semiconductors.
The chips in U.S. weapons systems are 100% made in the USA to keep foreign back doors out of the design process.
Wars of the future will be bought with software, not M1 Abrams tanks or battleships. If fact, they already are.
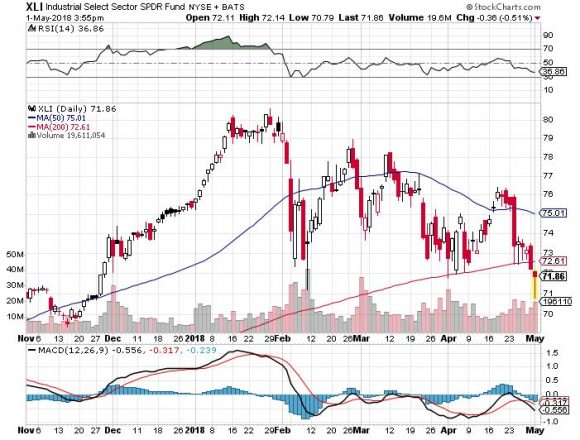
As for the shares of U.S. Steel, I'm not touching them here. If the economic data continues to weaken as it has, you don't want to be anywhere near this sector.
The stock market already has reached that conclusion.
On the USS Missouri; Made in the USA
https://www.madhedgefundtrader.com/wp-content/uploads/2018/05/John-Thomas-on-USS-Missouri-story-1-image-4-e1525209087753.jpg259250MHFTRhttps://madhedgefundtrader.com/wp-content/uploads/2019/05/cropped-mad-hedge-logo-transparent-192x192_f9578834168ba24df3eb53916a12c882.pngMHFTR2018-05-02 01:08:252018-05-02 01:08:25Trading the U.S. Steel Fiasco
Tickets for the Mad Hedge Lake Tahoe Conference are selling briskly. If you want to obtain a ticket that includes a dinner with John Thomas and Arthur Henry you better get your order in soon.
The conference date has been set for Friday and Saturday, October 26-27.
Come learn from the greatest trading minds in the markets for a day of discussion about making money in the current challenging conditions.
How soon will the next bear market start and the recession that inevitably follows?
How will guarantee you retirement in these tumultuous times?
What will destroy the economy first, rising interest rates or a trade war?
Who will tell you what to buy at the next market bottom?
John Thomas is a 50-year market veteran and is the CEO and publisher of the Diary of a Mad Hedge Fund Trader. John will give you a laser-like focus on the best-performing asset classes, sectors, and individual companies of the coming months, years, and decades. John covers stocks, options, and ETFs. He delivers your one-stop global view.
Arthur Henry is the author of the Mad Hedge Technology Letter. He is a seasoned technology analyst, and speaks four Asian languages fluently. He will provide insights into the most important investment sector of our generation.
The event will be held at a five-star resort and casino on the pristine shores of Lake Tahoe in Incline Village, NV, the precise location of which will be emailed to you with your ticket purchase combination.
It will include a full breakfast on arrival, a sit-down lunch, coffee break. The wine served will be from the best Napa Valley vineyards.
Come rub shoulders with some of the savviest individual investors in the business, trade investment ideas, and learn the secrets of the trading masters.
Ticket Prices
Copper Ticket - $599: Saturday conference all day on October 27, with buffet breakfast, lunch, and coffee break, with no accommodations provided
Silver Ticket - $1,299: Two nights of double occupancy accommodation for October 26 & 27, Saturday conference all day with buffet breakfast, lunch and coffee break
Gold Ticket - $1,499: Two nights of double occupancy accommodation for October 26 & 27, Saturday conference all day with buffet breakfast, lunch, and coffee break, and an October 26, 7:00 PM Friday night VIP Dinner with John Thomas
Platinum Ticket - $1,499: Two nights of double occupancy accommodation for October 26 & 27, Saturday conference all day with buffet breakfast, lunch, and coffee break, and an October 27, 7:00 PM Saturday night VIP Dinner with John Thomas
Diamond Ticket - $1,799: Two nights of double occupancy accommodation for October 26 & 27, Saturday conference all day with buffet breakfast, lunch, and coffee break, an October 26, 7:00 PM Friday night VIP Dinner with John Thomas, AND an October 27, 7:00 PM Saturday night VIP Dinner with John Thomas
Schedule of Events
Friday, October 26, 7:00 PM
7:00 PM - Exclusive dinner with John Thomas and Arthur Henry for 12 in a private room at a five-star hotel for gold and diamond ticket holders only
Saturday, October 27, 8:00 AM
8:00 AM - Breakfast for all guests
9:00 AM - Speaker 1: Arthur Henry - Mad Hedge Technology Letter editor Arthur Henry gives the 30,000-foot view on investing in technology stocks
10:00 AM - Speaker 2: Brad Barnes of Entruity Wealth on "An Introduction to Dynamic Risk Management for Individuals"
11:00 AM - Speaker 3: John Thomas - An all-asset class global view for the year ahead
12:00 PM - Lunch
1:30 PM - Speaker 4: Arthur Henry - Mad Hedge Technology Letter editor on the five best technology stocks to buy today
2:30 PM - Speaker 5: John Triantafelow of Renaissance Wealth Management
3:30 PM - Speaker 6: John Thomas
4:30-6:00 PM - Closing: Cocktail reception and open group discussions
7:00 PM - Exclusive dinner with John Thomas for 12 in a private room at a five-star hotel for Platinum or Diamond ticket holders only
https://www.madhedgefundtrader.com/wp-content/uploads/2018/05/Lake-Tahoe-story-2-e1525208464406.jpg384580MHFTRhttps://madhedgefundtrader.com/wp-content/uploads/2019/05/cropped-mad-hedge-logo-transparent-192x192_f9578834168ba24df3eb53916a12c882.pngMHFTR2018-05-02 01:07:142018-05-02 01:07:14Announcing the Mad Hedge Lake Tahoe, Nevada, Conference, October 26-27, 2018
"We have not been investing this year, we have been on a battleground," said noted UK hedge fund manager Crispin Odey.
https://www.madhedgefundtrader.com/wp-content/uploads/2018/05/Mel-Gibson-quote-of-the-day-e1525207821571.jpg200300MHFTRhttps://madhedgefundtrader.com/wp-content/uploads/2019/05/cropped-mad-hedge-logo-transparent-192x192_f9578834168ba24df3eb53916a12c882.pngMHFTR2018-05-02 01:05:452018-05-02 01:05:45May 2, 2018 - Quote of the Day
Featured Trade:
(FRIDAY, JUNE 15, 2018, DENVER, CO, GLOBAL STRATEGY LUNCHEON)
(ANATOMY OF A GREAT TRADE)
(TLT), (TBT), (SPY), (GLD), (USO),
(CYBERSECURITY IS ONLY JUST GETTING STARTED),
(PANW), (HACK), (FEYE), (CSCO), (FTNT), (JNPR), (CIBR)
There is a very high degree of risk involved in trading. Past results are not indicative of future returns. MadHedgeFundTrader.com and all individuals affiliated with this site assume no responsibilities for your trading and investment results. The indicators, strategies, columns, articles and all other features are for educational purposes only and should not be construed as investment advice. Information for futures trading observations are obtained from sources believed to be reliable, but we do not warrant its completeness or accuracy, or warrant any results from the use of the information. Your use of the trading observations is entirely at your own risk and it is your sole responsibility to evaluate the accuracy, completeness and usefulness of the information. You must assess the risk of any trade with your broker and make your own independent decisions regarding any securities mentioned herein. Affiliates of MadHedgeFundTrader.com may have a position or effect transactions in the securities described herein (or options thereon) and/or otherwise employ trading strategies that may be consistent or inconsistent with the provided strategies.