I am pleased to announce the Mad Hedge Fund Trader Executive Concierge Service, a program that is aimed at our most valuable clients.
The goal is to provide high net worth individuals with the extra degree of assistance they may require in managing diversified portfolios. Tax, political, and economic issues will all be covered.
It is also the ideal service for the small and medium-sized hedge fund that lacks the resources to support their own in-house global strategist full time.
The service includes the following:
1) A risk analysis of your own personal portfolio with the goal of focusing your investment in the highest return sectors for the long term.
2) A monthly phone call from John Thomas to update you on the current state of play in the global financial markets.
3) An in- personal meeting with John Thomas anywhere in the world once a year to continue our in-depth discussions.
The cost for this highly personalized, bespoke service is $10,000 a year.
To best take advantage of the ExecutiveConcierge Service, you should possess the following:
1) an existing subscription to Mad Hedge Fund TraderPro so you are already well aware of our strengths and limitations;
2) a liquid net worth of over $500,000; and
3) a degree of knowledge and sophistication of financial markets.
https://www.madhedgefundtrader.com/wp-content/uploads/2016/08/john-headshot-e1475724748969.png400304DougDhttps://madhedgefundtrader.com/wp-content/uploads/2019/05/cropped-mad-hedge-logo-transparent-192x192_f9578834168ba24df3eb53916a12c882.pngDougD2016-10-06 01:06:292016-10-06 01:06:29Introducing the Mad Hedge Fund Trader Executive Concierge Service
Featured Trade: (LAST CHANCE TO ATTEND OCTOBER 7th INCLINE VILLAGE, NV GLOBAL STRATEGY LUNCHEON), (11 SURPRISES THAT WOULD DESTROY THIS MARKET), (SPY), (TLT), (FXE), (USO)
SPDR S&P 500 ETF (SPY) iShares 20+ Year Treasury Bond (TLT) CurrencyShares Euro ETF (FXE) United States Oil (USO)
Come join me for lunch at the Mad Hedge Fund Trader?s Global Strategy Update, which I will be conducting in Incline Village, NV on Friday, October 7, 2016. An excellent meal will be followed by a wide-ranging discussion and an extended question and answer period.
I?ll be giving you my up to date view on stocks, bonds, currencies, commodities, precious metals, and real estate. And to keep you in suspense, I?ll be throwing a few surprises out there too. Tickets are available for $218.
I?ll be arriving at 11:30 and leaving late in case anyone wants to have a one on one discussion, or just sit around and chew the fat about the financial markets.
The lunch will be held at the premier restaurant in Incline Village, Nevada on the sparkling shores of Lake Tahoe. Those who live there already know what it is. The precise location will be emailed with your purchase confirmation.
I look forward to meeting you, and thank you for supporting my research. To purchase tickets for the luncheon, please click here.
https://www.madhedgefundtrader.com/wp-content/uploads/2015/10/Lake-Tahoe-e1445285284640.jpg297400DougDhttps://madhedgefundtrader.com/wp-content/uploads/2019/05/cropped-mad-hedge-logo-transparent-192x192_f9578834168ba24df3eb53916a12c882.pngDougD2016-10-04 01:07:212016-10-04 01:07:21Last Chance to Attend October 7th Incline Village, NV Global Strategy Luncheon
It?s a good thing I went to an Oktoberfest last week.
That gave me a chance to get my German up to snuff just in time for Deutsche Bank to run into financial troubles.
Since 2008, the knee jerk reaction to bad news about any major bank is that the Lehman Brothers nightmare is about to repeat itself.
It only took a few calls to Frankfurt and some reminiscing about the good old days in West Berlin for me to figure out that Deutsche Bank is no Lehman. They have tons of liquid cash and a rock solid balance sheet.
A systemic threat it is not.
Do you really think the Germans are going to bail out Greece, but let its largest bank go? I don?t think so.
It is only fear of a 50% dilution from a new capital raise that is driving investors out of the stock.
Not helping is the $14 billion in fines the mega bank still owes the US Justice Department related to abuses committed in the run up to the 2008 crash.
Does that sound remarkably similar to the $14 billion Apple (AAPL) owes the Irish government? I?m sure it?s just a coincidence. And I am equally shocked they allow gambling in the casino.
However, automatic fears like this will probably continue for another generation, much like they did after the great 1929 crash, leaving investors on the sidelines.
That all adds up to a giant SELL for all asset classes. There really is no place to hide.
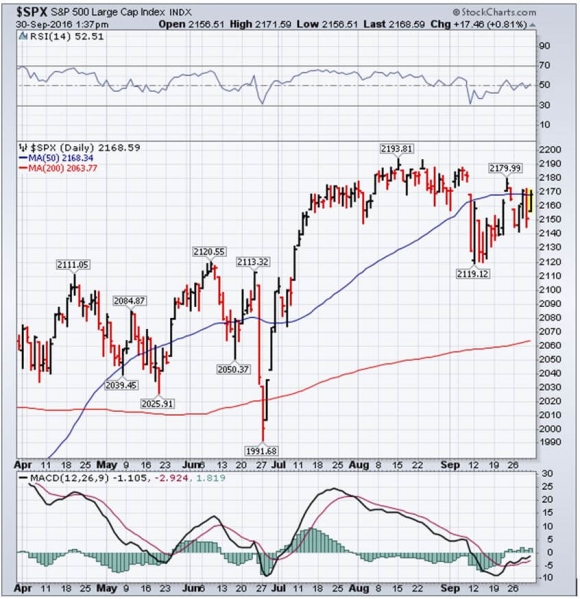
So far, every puke-out has been met by a wall of buying from underweight, underperforming, performance-chasing investors targeting 2,013 in the S&P 500 (SPX).
If this behavior continues, we could be in for what I call ?The dreaded flat line of death?.
This occurs when markets trade in incredibly tight ranges creating opportunities for virtually no one. That is exactly what we saw during the five-month period during the spring and summer of this year.
This could last all the way until the presidential election on November 8th.
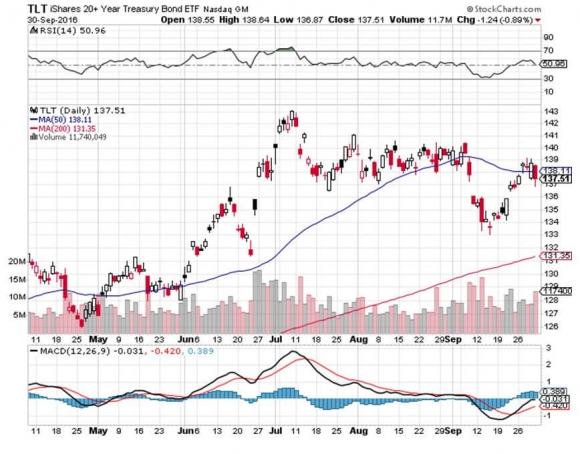
So I have been hiding out with a nice little short position in the bond market (TLT), which delivered a convenient two point dump on the last trading day of the month, just pushing my performance mercifully into the green.
Hey, in these miserable trading conditions, I?ll take a push any time.
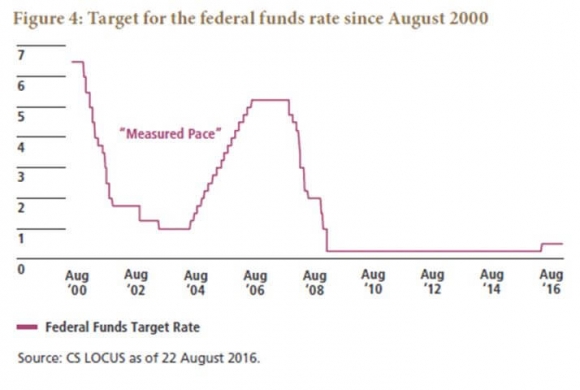
Isn?t that what?s supposed to happen when the Fed promises to raise interest rates in December?
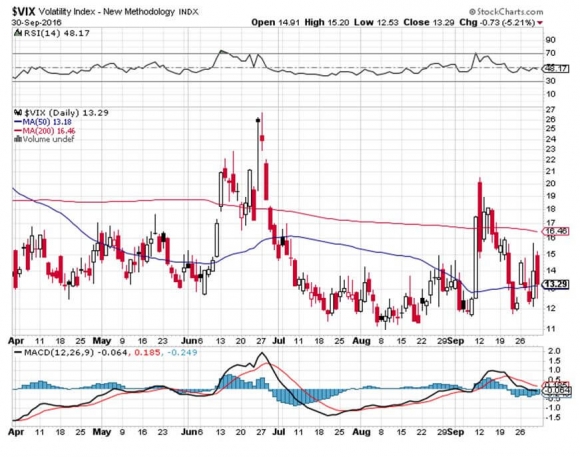
You could have made a lot of money last week trading the Volatility Index (VIX) which made two round trips between $12-$15, a 25% range.
When will the next market panic ensue?
When a confident, assured, even tempered, and well prepared Donald Trump, brimming with facts, wins the Sunday, October 9th presidential debate at Washington University in St. Louis, Missouri.
CNN?s Anderson Cooper will be the moderator, and the questions will be randomly posed by individual citizens in a town hall format and via social media.
It will be a real ?think on your feet? challenge for both candidates.
I can?t wait.
Finally, since I am basically a positive person, I like to end on a high note.
San Jose, CA based Nutanix (NTNX) launched the best performing IPO of the year on Friday, up 131% on the first day.
The performance had the airwaves in Silicon Valley burning up.
Yes, I know these deals are engineered to create a structural short squeeze at the beginning.
But is this the deal that gets unicorn giants like Uber and Airbnb off the bench? Are another 100 unicorns behind them ready to go public? Are extravagant IPO parties making a return after a 16-year hiatus?
Most importantly, IS THE DOTCOM BUBBLE BACK?
The possibilities boggle the mind.
On Monday, October 3 at 8:30 AM, we get August Gallup Consumer Spending which should show that Americans are using their credit cards as much as ever.
On Tuesday, October 4 at 8:55 AM EST, we learn the Redbook for the week, tracking the behavior of consumers at chain stores, discounters, and department stores.
On Wednesday, October 5 at 10:00 AM EST, we get September Factory Orders and the ISM non-Manufacturing Index.
On Thursday, October 6 at 8:30 AM EST, we get the Weekly Jobless Claims which should confirm that employment remains at four decade highs.
Friday, October 7 delivers us the September Nonfarm Payroll report at 8:30 AM EST, the big release of the week. Expect a big bounce back from the disappointing 151,000 print last month, as well as substantial upside revisions.
We wind up with the Baker HughesRig Count on Friday at 1:00 PM EST. Worryingly, the trend has been up for the past 13 out of the past 14 weeks. Given OPEC?s surprise, and not believed, production cap last week, this report should garner more interest than usual.
All in all, I expect us to continue trading in narrow ranges, with profits accruing only to the quick and the nimble.
?If my analysis about Deutsche Bank proves correct,? all of the volatility could be confined to Friday morning.
Good luck and good trading. Keep your hard hat on.
John Thomas The Mad Hedge Fund Trader
All is Good With Deutsche Bank
https://www.madhedgefundtrader.com/wp-content/uploads/2016/10/John-at-Oktoberfest-e1475383525796.jpg400310DougDhttps://madhedgefundtrader.com/wp-content/uploads/2019/05/cropped-mad-hedge-logo-transparent-192x192_f9578834168ba24df3eb53916a12c882.pngDougD2016-10-03 01:07:012016-10-03 01:07:01Market Outlook for the Coming Week
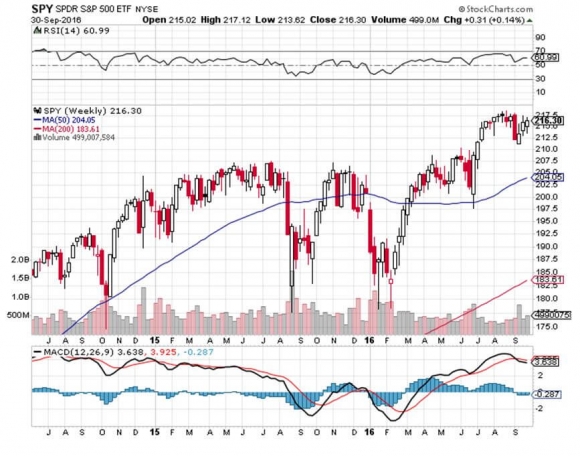
The S&P 500 has just bounced off the 214 level for the second time this month.
Is it safe to come out of your cave? Is to time to take the hard hat back to the basement?
If you had taken Cunard?s round-the-world cruise three months ago, as I recommended, you would be landing in New York about now, wondering what the big deal was. Indexes are unchanged since you departed.
This truly has been the Teflon market. Nothing will stick to it. In June when Brexit hit, many predicted the end of the world. The market crashed. Then within days, it recovered the loss and moved on to new all time highs..
Go figure.
It makes you want to throw up your hands in despair and throw your empty beer can at the TV. All this work, and I?ve delivered the perfectly wrong conclusions?
Let me point out a few harsh lessons learned from this most recent melt down, and the rip your face off rally that followed.
Remember all those market gurus poo pooing the effectiveness of the ?Sell in May and go away? strategy? This year it worked better than ever.
This is why almost every Trade Alert I shot out for the past five months has been from the short side. It is also why I was so quick to cover my most recent shorts for a loss.
We are about to move from a ?Sell in May? to a ?Buy in November? posture.
The next six months are ones of historical seasonal market strength (click here for the misty origins of this trend at ?If You Sell in May, What To Do in April??).? You must be logged into your account to read this article.
The other lesson learned this summer was the utter uselessness of technical analysis. Usually these guys are right only 50% of the time. This year, they missed the boat entirely.
When the S&P 500 (SPY) was meandering in a narrow nine point range, and the Volatility Index ($VIX) hugged the 12-15 neighborhood, they said this would continue for the rest of the year.
It didn?t.
When the market finally broke down in June, cutting through imaginary support levels like a hot knife through butter, they said the market would plunge to 175, and possibly as low as 158.
It didn?t do that either.
When the July rally started, pitiful technical analysts told you to sell into it.
If you did, you lost your shirt. The market just kept going, and going, and going like the Energizer Bunny.
This is why technical analysis is utterly useless as an investment strategy. How many hedge funds use a pure technical strategy?
Absolutely none, as it doesn?t make any money.
At best, it is just one of 100 tools you need to trade the market effectively. The shorter the time frame, the more accurate it becomes.
On an intraday basis, technical analysis is actually quite useful. But I doubt few of you engage in this hopeless pursuit.
This is why I advise portfolio managers and financial advisors to use technical analysis as a means of timing order executions and nothing more.
Most professionals agree with me.
Technical analysis derives from humans? preference for looking at pictures instead of engaging in abstract mental processes. A picture is worth 1,000 words and probably a lot more.
This is why technical analysis appeals to so many young people entering the market for the first time. Buy a book for $5 on Amazon, and you too can become a Master of the Universe.
Who can resist that?
The problem is that high frequency traders also bought that same book from Amazon a long time ago and have designed algorithms to frustrate every move the technical analyst makes.
Sorry to be a buzz kill, but that is my take on technical analysis.
Hope you enjoyed your cruise.
Correction? What Correction?
https://www.madhedgefundtrader.com/wp-content/uploads/2013/07/John-Thomas-breakfast.jpg364490Mad Hedge Fund Traderhttps://madhedgefundtrader.com/wp-content/uploads/2019/05/cropped-mad-hedge-logo-transparent-192x192_f9578834168ba24df3eb53916a12c882.pngMad Hedge Fund Trader2016-10-03 01:06:162016-10-03 01:06:16Why Technical Analysis Doesn?t Work
As most of my subscribers? know, I try to call all of them at least once a year and address their individual concerns.
Not only do I pick up some great information about regions, industries, businesses, and companies, I also learn how to rapidly evolve the Diary of a Mad Hedge Fund Trader service to best suit my voracious readers.
So when a gentleman asked me the other day to reveal to him the top performing asset of the next 30 years, I didn?t hesitate: your home. He was shocked.
I listed off the many reasons why residential housing is just entering a Golden Age that will drive prices up tenfold, if not 100-fold in the decades to come.
1) Demographics
This has been the hard decade for housing, when 80 million downsizing baby boomers unloaded their homes for greener pastures at retirement condos and assisted living facilities.
The 65 million Gen Xers who followed were not only far fewer in number, they earned much less, thanks to globalization and hyper accelerating technology.
All of this conspired to bring us a real estate crash that bottomed out in 2011.
During the 2020s, the demographics reverse. That?s when 85 million millennials start chasing the homes owned by 65 million Gen Xers. And, as they age, this group will be earning a lot more disposable income, thanks to a coming labor shortage.
2) Population Growth
If you think it's crowded now, you haven?t seen anything yet.
Over the next 30 years, the US population is expected to soar from 322 million today to 400 million. California alone will rocket from 38 million to 50 million.
That means housing for 78 million new Americans will have to come from somewhere. It sets up a classic supply/demand squeeze.
That?s why megaprojects like the San Francisco to Los Angeles bullet train, which may seem wasteful and insane today, might be totally viable by the time they are finished.
3) They?re Not Building Them Anymore
Or at least not as much as they used to.
In August, 2016, new home building delivered an annualized pace of a scant 609,000 new units, compared to a peak of 2 million a month prior to 2008. That means they are producing less than a third of peak levels.
The home building industry has to more than double just to meet current demand.
Builders blame regulations, zoning, the availability of buildable land, lack of financing, and labor shortages.
The reality is that the companies that survived the 2008 crash are a much more conservative bunch than they used to be. They are not looking for market share.
Instead, they are targeting a specific return on capital for their business, probably 20% a year pre tax.
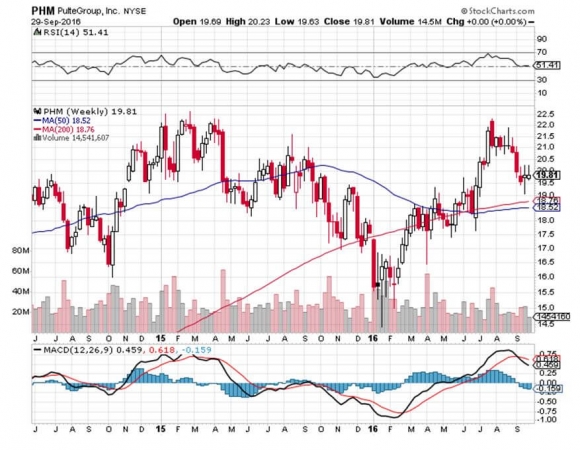
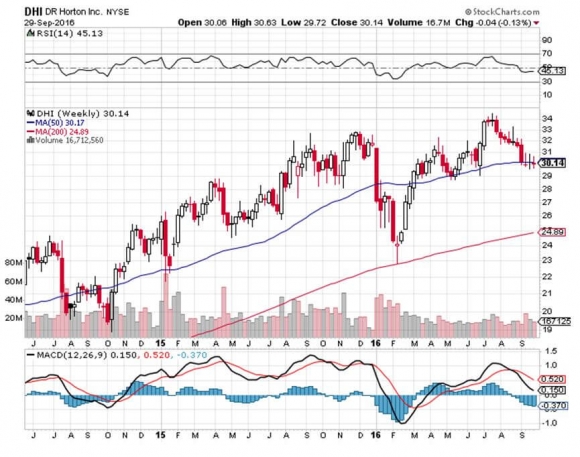
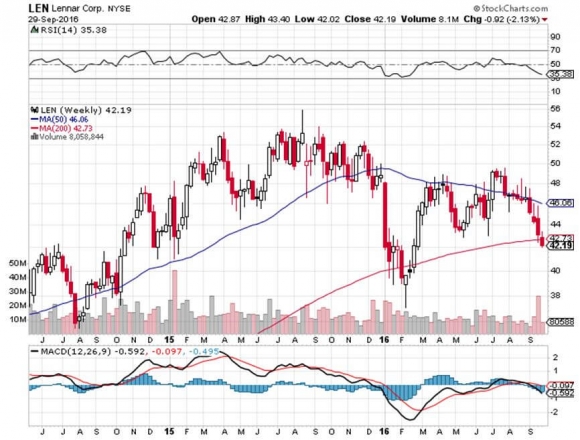
It is no accident that new home builders like Lennar (LEN), Pulte Homes (PHM) and DR Horton (DHI) make a fortune when building into rising prices and restricted supply.
This strategy is creating a structural shortage of 5 million new homes in this decade alone.
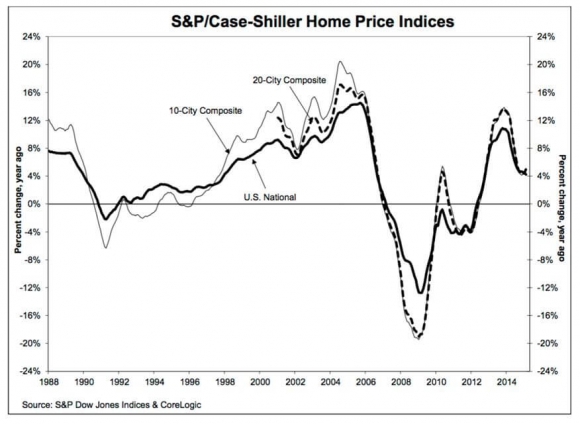
4) The Rear View Mirror
The S&P 500 Real Estate Price Index (see below) is currently running at an annual increase of 5.1%. Net out the many tax breaks that come with ownership, the real annual return is closer to 7%.
That beats cash at 0%, municipal bonds at 1.25%, US Treasury bonds at 1.55%, S&P 500 equities with dividends at 5%, and junk bonds at 5.5%.
Unless you have a new Internet start up percolating in your garage, it is going to be very hard to beat your own home?s return.
5) The Last Leverage Left
A typical down payment on a new home these days is 25%. That gives you leverage of 4:1. So in a market that is rising by 5.1% a year, your increase in home equity is really 20.4% a year.
Pay a higher interest rate, and down payments as low as 10% are possible, bringing your annual increase in home equity to an eye popping 51%.
There are very few traders who can make this kind of return, even during the most spectacular runaway bull market. And to earn this money on your house, all you have to do is sleep in it at night.
6) The Tax Breaks are Great
The mortgage interest on loans up to $1 million are deductible on your Form 1040, Schedule ?A?.
You can duck the capital gains entirely if the profit is less than $500,000, you?re married, and lived in the house for 2 years or more.?
Any gains above that are taxed at only a maximum 20% rate. These are the best tax breaks you can get anywhere without being a member of the 1%.
7) Job Growth is Good and Getting Better
The monthly Non Farm Payroll reports are averaging out at about 200,000 a month. As long as we maintain this level or higher, enough entry level homeowners are entering the market to keep prices rising.
And you know those much-maligned millennials? They are finally starting to have kids, need larger residences, and are turning from renting to buying. 8) There is No Overbuilding Anywhere
Never in the history of the industry have we been so far into an economic recovery, now seven years, without any sign of overbuilding.
You know those forests of cranes that blighted the landscape in 2006? They are nowhere to be seen, except in San Francisco.
The other signs of excess speculation:? liars' loans, artificially high appraisals, and rapid flipping are also nowhere to be seen.
No bubble means no crash. Prices should just continue grinding upwards in a very boring nonvolatile way.
9) Foreign Capital is Pouring In
Here in the San Francisco Bay Area stories abound of Chinese showing up with suitcases of cash and buying million-dollar homes.
The problem has become so endemic that the US Treasury is demanding proof of beneficial ownership on sales over $2 million to get behind shell companies and frustrate money laundering and tax evasion.
And with yields at 4.5%-6.5% in US commercial real estate, foreign institutions are pouring in tens of billions of dollars in capital. Remember, they are fleeing negative rates at home.
US real estate has become the world?s largest high yield asset class.
So the outlook is pretty rosy for individual home ownership for the foreseeable future.
Just don?t forget to sell by 2030.
That's when the next round of trouble begins.
https://www.madhedgefundtrader.com/wp-content/uploads/2016/09/Johns-House.jpg356473DougDhttps://madhedgefundtrader.com/wp-content/uploads/2019/05/cropped-mad-hedge-logo-transparent-192x192_f9578834168ba24df3eb53916a12c882.pngDougD2016-09-30 01:07:172016-09-30 01:07:17Your Best Performing Asset Just Got Better
If you have been living in a cave for the last 75 years and missed the work of management guru, Peter F. Drucker, here is your chance to catch up.
I finished reading The Essential Drucker, a weighty tome of 368 pages which summarized the high points and pearls of wisdom of the author's 38 books published since 1939.
A self-described?social ecologist?, Drucker was a journalist who moved to Germany because job prospects in his native Austria-Hungary were so poor following its defeat in WWI.
He became a close friend of Austrian economist Joseph Schumpeter, who popularized the term ?creative destruction?, and attended lectures by John Maynard Keynes. He fled to the US in 1934 after his writings were burned by the Nazis.
For most of human history, armies were the predominant management model, and most corporations today show the military influence.
Management only emerged as a science during the 1920s, and Drucker was one of the founding fathers. Early adopters, like Coca Cola, Du Pont, IBM, and General Electric, went on to prosper mightily.
He observed that Franklin Delano Roosevelt set up the most productive administration in history. Taking even a single step was so painful for him that he, and all those who worked around him, had to organize the government with the maximum efficiency possible.
This was a key element in America's victory in WWII.
Drucker writes at length on the risks and opportunities of entrepreneurship, and argues that all companies must innovate or die, no matter how pedestrian their product.
He predicted many of the trends that came to dominate the late 20th and early 21st century, such as privatization, decentralization, globalization, and the rise of the knowledge worker.
He had a huge following when I was in Japan during the seventies, and his mark can be seen in today's global presence of the major Japanese keiretsu.
While most define a company in terms of producing products and making a profit, Drucker sees it's mission as?creating a customer?. He presents a rigorous process for decision making.
He lauds nonprofits as the best-run organizations in the country because they have to be. Groups like the Girl Scouts, the Red Cross, and United Way maintain an effective global presence without paying their people any money.
He makes the distinction between efficiency and effectiveness, doing things right, versus doing the right things.
Anyone who manages a business, from a Fortune 500 company to a single individual banging away on a PC at home, will benefit from reading this book.
It forces you to take a look at your own operation with fresh eyes. It even advises on how to manage one's own time, from dispensing with unnecessary meetings to minimizing paperwork and bureaucracy.
Drucker moved to California during the seventies, where he set up one of the early MBA programs for Claremont College.
He died in 2005 at the age of 96. To order this insightful book from Amazon, please click here.
https://www.madhedgefundtrader.com/wp-content/uploads/2013/02/The-Essential-Drucker.jpg513339Mad Hedge Fund Traderhttps://madhedgefundtrader.com/wp-content/uploads/2019/05/cropped-mad-hedge-logo-transparent-192x192_f9578834168ba24df3eb53916a12c882.pngMad Hedge Fund Trader2016-09-30 01:06:102016-09-30 01:06:10Peter F. Drucker on Management
Legal Disclaimer
There is a very high degree of risk involved in trading. Past results are not indicative of future returns. MadHedgeFundTrader.com and all individuals affiliated with this site assume no responsibilities for your trading and investment results. The indicators, strategies, columns, articles and all other features are for educational purposes only and should not be construed as investment advice. Information for futures trading observations are obtained from sources believed to be reliable, but we do not warrant its completeness or accuracy, or warrant any results from the use of the information. Your use of the trading observations is entirely at your own risk and it is your sole responsibility to evaluate the accuracy, completeness and usefulness of the information. You must assess the risk of any trade with your broker and make your own independent decisions regarding any securities mentioned herein. Affiliates of MadHedgeFundTrader.com may have a position or effect transactions in the securities described herein (or options thereon) and/or otherwise employ trading strategies that may be consistent or inconsistent with the provided strategies.