Featured Trade: (MAY 8 LAS VEGAS STRATEGY LUNCHEON), (HERE COMES THE ROLLING TOP), (VIX), (BAC), (UAL), (SPX), (IWM), (A DIFFERENT VIEW OF THE US)
VOLATILITY S&P 500 (VIX)
Bank of America Corporation (BAC)
United Continental Holdings, Inc. (UAL)
S&P 500 Large Cap Index (SPX)
iShares Russell 2000 Index (IWM)
https://madhedgefundtrader.com/wp-content/uploads/2019/05/cropped-mad-hedge-logo-transparent-192x192_f9578834168ba24df3eb53916a12c882.png00Mad Hedge Fund Traderhttps://madhedgefundtrader.com/wp-content/uploads/2019/05/cropped-mad-hedge-logo-transparent-192x192_f9578834168ba24df3eb53916a12c882.pngMad Hedge Fund Trader2013-03-26 09:19:072013-03-26 09:19:07March 26, 2013
Come join me for lunch at the Mad Hedge Fund Trader?s Global Strategy Update, which I will be conducting in Las Vegas, Nevada on Wednesday, May 8, 2013. An excellent meal will be followed by a wide-ranging discussion and an extended question and answer period.
I?ll be giving you my up to date view on stocks, bonds, currencies, commodities, precious metals, and real estate. I will also explain how I have been able to deliver a blowout 40% return since the November, 2012 market bottom. And to keep you in suspense, I?ll be throwing a few surprises out there too. Tickets are available for $179.
I?ll be arriving at 11:00 and leaving late in case anyone wants to have a one on one discussion, or just sit around and chew the fat about the financial markets. The PowerPoint presentation will be emailed to you three days before the event.
The lunch will be held at a major Las Vegas hotel on the Strip, the details will be emailed with your purchase confirmation. Please make your own hotel reservations, as business there is booming.
I look forward to meeting you, and thank you for supporting my research. To purchase tickets for the luncheons, please go to my online store.
https://www.madhedgefundtrader.com/wp-content/uploads/2012/08/las-vegas-welcome-sign.jpg487325Mad Hedge Fund Traderhttps://madhedgefundtrader.com/wp-content/uploads/2019/05/cropped-mad-hedge-logo-transparent-192x192_f9578834168ba24df3eb53916a12c882.pngMad Hedge Fund Trader2013-03-26 09:18:102013-03-26 09:18:10May 8 Las Vegas Strategy Luncheon
The S&P 500 is now at 1,564, and most strategist forecasts for the end of 2013 hover around 1,550-1,600, plus or minus some spare change. So the next nine months are going to be incredibly boring. Or they won?t.
Even in a bull market, one expects to see pullbacks of at least one third of the recent gain. Apply that logic towards the 224 points the (SPX) has tacked on since the November low, and that adds up to a 74 point, or a 4.7% correction down to 1,490.
There is massive liquidity in the system, many individuals and institutions are underweight, and interest rates are still at incredibly low levels. It also appears that every foreign financial disaster results in more money getting sent to the US for safety.
Usually, the (SPX) never rises more than 9% above the 200 day moving average without hitting a correction. This year is different. I can?t remember the last time the index spent this much time at that level without a pullback.
We are therefore likely to see a rolling type market top that unfolds over the next several months. That is in contrast to a spike top, which you can spot on a chart without your glasses from 20 feet away. These tops can be devilishly difficult to trade, with the limits defined more by time than price.
If you want to see what such a rolling top looks like, take a peak at the chart for my old friend, Dr. Copper, that great prognosticator of future economic activity. He put in such a rolling top during the first eight months of 2011, and has been trying to recover ever since, to no avail.
This no doubt reflects the slowing economy and the building copper inventories in China, where the red metal is widely used as a monetary instrument. China, in effect, is on a copper standard. It is rare to see the (SPX) going up and copper dropping like, well, a bar of copper.
While the broader indexes are likely to deliver a rolling top, that is not the case with individual sectors and stocks. That means you can use these individual spikes to assist in your timing of the overall market. You need to watch the market leaders like a hawk, such as the financials and the transports. If Bank of America (BAC) and United Continental Group (UAL), suddenly crash and burn, you can bet the rest of the market won?t be far behind. This is one of the reasons why I have these two names in my model-trading portfolio, on which you should maintain your laser focus.
The consumer discretionary and retail sectors are two additional pathfinder sectors that are the most economically sensitive in the market, which also make great canaries in the coalmine. As long as consumers are packing MacDonald?s (MCD), Home Depot (HD), and Target (TGT), or burning up their Comcast (CMCSA) broadband connections buying stuff from Amazon (AMZN), you won?t see appreciable market weakness. Earnings disappointments at these businesses, which could start in three weeks, are another great precursor of market trouble.
Finally, there is another class of stocks that may lead the charge on the downside, and that is small caps. Look at the chart below for the ETF for the Russell 2000 (IWM). Small companies are always hardest hit in any slowdown because they are more highly leveraged and have less access to external financing, like bank loans and equity floatations. I made a bundle last year shorting the (IWM) into the ?Sell in May? market meltdown, and plan to do so again this year.
Of course, timing is everything, and I?ll tell you what worries me the most. The overdependence of this bull market on the largess of the Federal Reserve cannot be underestimated. Any hint that quantitative easing is about to join the dustbin of history will take the market with it.
The conventional wisdom is that our esteemed central bank won?t embark on this path until year-end. What if it surprises us with a June tightening? The bull market would die of an instant heart attack. What would trigger this? A blowout monthly nonfarm payroll number approaching 300,000, which would quickly take the headline unemployment rate close to the Fed?s publicly announced 6.5% target. With the economy perhaps growing at a 3% rate this quarter, such a development might be only a handful of Friday?s away.
So how is the genius, aggressive hedge fund trader going to deal with these opaque markets? Bet that the market is going to stay in a broad range for a few more months. We aren?t going to the moon, nor are we going to crash. We are more likely to die of ice than fire. That?s what the volatility markets (VIX) are telling us.
There are several ways to play this kind of market. If you have a plain vanilla stock portfolio, you should be executing ?buy writes? against your existing holdings to take in extra premium income. With the bull move five months old, call options are trading at historically rich levels. This low risk, high return strategy involves selling short call options against existing stock positions. If your stock gets called away, you just say ?thank you very much? and buy it back on the way down.
For the more aggressive, you can add naked short sales of deep out of the money calls one month out. You don?t get rich with a strategy like this, but you earn a living.
You might also buy some deep out-of-the-money index puts for pennies. They are now trading near the cheapest prices in history. One market hiccup, and these things double very quickly.
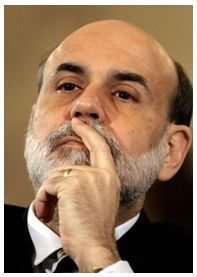
Hmmm. Doesn?t Look Like Ben Bernanke
https://www.madhedgefundtrader.com/wp-content/uploads/2013/03/Gorilla.jpg203181Mad Hedge Fund Traderhttps://madhedgefundtrader.com/wp-content/uploads/2019/05/cropped-mad-hedge-logo-transparent-192x192_f9578834168ba24df3eb53916a12c882.pngMad Hedge Fund Trader2013-03-26 09:15:452013-03-26 09:15:45Here Comes the Rolling Top
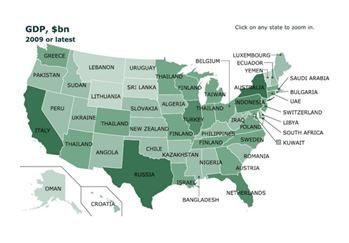
My mother lives in Pakistan, my daughter in Greece, and I have a ski chalet in Peru. What's more, I have strategy luncheons planned for Australia, Thailand, and Turkey.
At least these would be my conclusions after looking at a map of the United States prepared by my esteemed former employer, The Economist magazine, renaming each state with its international equivalent in GDP.
There are other tongue-in-cheek comparisons to be made. Texas is portrayed by Russia, which makes sense, as both are oil exporters. Ditto for Alaska, which is represented by Oman. As for Hawaii? It is renamed Croatia. Now that would really give president Obama birth certificate problems!
I worked for this august publication for a decade during the seventies, and have been reading the best business magazine in the world for nearly over four decades. They never cease to inform, entertain, and titillate.
An April 1 issue once did a full page survey on a fictitious country off the coast on India called San Serif. It noted that if the West coast kept eroding, and the East coast continued silting up, the country would eventually run into the subcontinent, creating serious geopolitical problems.
It wasn't until someone figured out that the country, the prime minister, and every town on the map was named after a type font that the hoax was uncovered. This was way back, in the pre-Microsoft Word era, when no one outside the typesetters union knew what 'Times Roman' meant.
https://www.madhedgefundtrader.com/wp-content/uploads/2013/03/US-GDP.jpg243349Mad Hedge Fund Traderhttps://madhedgefundtrader.com/wp-content/uploads/2019/05/cropped-mad-hedge-logo-transparent-192x192_f9578834168ba24df3eb53916a12c882.pngMad Hedge Fund Trader2013-03-26 09:09:072013-03-26 09:09:07A Different View of the US
When I was a young, clueless investment banker at Morgan Stanley 30 years ago, the head of equity sales took me aside to give me some fatherly advice. Never touch the airlines.
The profitability of this industry was totally dependent on fuel costs, interest rates, and the state of the economy, and management hadn't the slightest idea of what any of these were going to do. If I were ever tempted to buy an airline stock, I should lie down and take a nap first.
At the time, the industry had just been deregulated, and was still dominated by giants like Pan Am, TWA, Eastern Air, Western, Laker, Braniff, and a new low cost upstart called People Express. None of these companies exist today. It was the best investment advice that I ever got.
If you total up the P&L's of all of the US airlines that ever existed since Orville and Wilber Wright first flew in 1903 (their pictures are on my new anti-terrorism edition commercial pilots license), it is a giant negative number, well in excess of $100 billion. This is despite the massive government subsidies that have prevailed for much of the industry's existence.
The sector today is hugely leveraged, capital intensive, heavily regulated, highly unionized, offers customers terrible service, and is constantly flirting with, or is in bankruptcy. Its track record is horrendous. They are a prime terrorist target. A worse nightmare of an industry never existed.
I became all too aware of the travails of this business while operating my own charter airline in Europe as a sideline to my investment business. The amount of paperwork involved in a single international flight was excruciating. Every country piled on fees and taxes wherever possible. The French air traffic controllers were always on strike, the Swiss were arrogant, and the Italians unintelligible and out of fuel.
The Greek military controllers once lost me over the Aegean Sea for two hours, while the Yugoslavs sent out two MIGs to intercept me. As for the US? Did you know that every rivet going into an American built aircraft must first be inspected by the government and painted yellow before it can be used in manufacture?
While flying a Red Cross mission into Croatia, I got shot down by the Serbians, crash landed at a small Austrian Alpine River, and lost a disc in my back. I had to make a $300 donation to the Zell Am Zee fire department Christmas fund to get their crane to lift my damaged aircraft out of the river. Talk about killing the competition!
So you may be shocked to hear that I think there is a great opportunity here in airline stocks. A Darwinian weeding out has taken place over the last 30 year that has concentrated the industry so much that it would attract the interest of antitrust lawyers, if consumers weren?t such huge beneficiaries.
If the American-US Air (AAMRQ) ? (LCC) deal goes through, as expected, the top four carriers (along with United-Continental, Delta, and Southwest) will control 90% of the market. That is up from 60% only five years ago. The industry has fewer seats than in 1982; while inflation adjusted fares are down 40%. Analysts are referring to this as the industry?s new ?oligopoly advantage.?
Any surprise bump up in oil prices is met with a blizzard of higher fares, fees, and fuel surcharges. I can't remember the last time I saw an empty seat on a plane, and I travel a lot. Lost luggage rates are near all time lows because so few now check in bags. Interest rates staying at zero don?t hurt either.
The real kicker here is that stock in an airline is, in effect, a free undated short volatility play on oil. If oil doesn?t move, airline stocks go up. You may have noticed that I have written at length on the rough balance that has emerged in the global oil markets, where rising Chinese demand is offset by increasing US production from fracking. The end result has been the lowest volatility in the oil market in years. On top of that, you can add the huge economies offered by the soon to be reintroduced Boeing 787, which uses 40% less fuel than existing models.
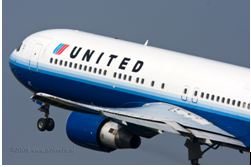
I picked United Continental Group (UAL) because it suffered from some integration problems from their recent merger, like a reservations system that wouldn?t work. That gives them the greatest snap back potential.
And even if the fuel savings turn out to be modest, a recovering US economy should boost profitability, given its recent maniacal pursuit of controlling costs. Some airlines have become so cost conscious that they are no longer painting their planes to gain fuel savings from carrying 100 pounds less weight! Just the missing pretzels alone should be worth a few cents a share in earnings.
This is not just a US development, but an international one. The International Air Transport Association (IATA) has just raised it forecast of member earnings from $7.6 billion in 2012 to $10.6 billion this year, a gain of 40%. The biggest earnings are based in Asia (China Southern Airlines, China Eastern Airlines, Air China), followed by those in the US, with $3.6 billion in profits.
Add all this together, and the conclusion is clear. The checklist is complete, the IFR clearance is in hand, and it is now time to push the throttles to the firewall for the airline stocks. And no, I didn't get free frequent flier points for writing this piece.
Time to Consider Another Career
Fly the Friendly Skies With a Long Position
https://www.madhedgefundtrader.com/wp-content/uploads/2013/03/3.21.2013-B.jpg167251Mad Hedge Fund Traderhttps://madhedgefundtrader.com/wp-content/uploads/2019/05/cropped-mad-hedge-logo-transparent-192x192_f9578834168ba24df3eb53916a12c882.pngMad Hedge Fund Trader2013-03-25 09:20:522013-03-25 09:20:52Airline Stocks Are Cleared for Take Off
Featured Trade: (BUY EVERY BLACK SWAN), (SPY), (QQQ), (IWM), (AAPL), (UAL) (REVISITING CHENIERE ENERGY), (LNG), (UNG), (USO), (DVN), (CHK)
SPDR S&P 500 (SPY)
PowerShares QQQ (QQQ)
iShares Russell 2000 Index (IWM)
Apple Inc. (AAPL)
United Continental Holdings, Inc. (UAL)
Cheniere Energy, Inc. (LNG)
United States Natural Gas (UNG)
United States Oil (USO)
Devon Energy Corporation (DVN)
Chesapeake Energy Corporation (CHK)
https://madhedgefundtrader.com/wp-content/uploads/2019/05/cropped-mad-hedge-logo-transparent-192x192_f9578834168ba24df3eb53916a12c882.png00Mad Hedge Fund Traderhttps://madhedgefundtrader.com/wp-content/uploads/2019/05/cropped-mad-hedge-logo-transparent-192x192_f9578834168ba24df3eb53916a12c882.pngMad Hedge Fund Trader2013-03-21 23:03:272013-03-21 23:03:27March 22, 2013
At least that?s what Ben Bernanke thinks. He said as much in his press conference yesterday in the wake of the latest Fed statement. He might as well have waved a red Flag at a bull.
The central bank took the opportunity to downgrade its US growth forecasts going forward as a result of sequestration imposed government spending cuts. What is impressive is how minimal the impact will be, each year only pared back 0.1%. Armageddon, not! Here are the new GDP numbers:
2013? +2.55%
2014? +3.15%
2015? +3.30%
These are at the high end of most private sector predictions. Does Uncle Ben know something that he is not telling us? If the Fed is anywhere close to being right on these predictions, it justifies the meteoric rise in share prices we have seen so far this year. It also suggests we have more upside to go.
Let me throw out a theory here. Ben Bernanke is so fearful of repeating the Federal Reserve mistakes of 1938 that he is going to ere on the side of caution on the monetary easing front. That is when the government tightened too soon, triggering the second leg of the Great Depression and another 50% fall in the Dow average. He certainly is getting a free pass on the inflation front. When is the last time you heard of a worker getting a pay increase?
All of this paints an outlook for stocks that is pretty bullish. We could well continue on up for the rest of 2013, save for a 5%-10% correction in the summer. In the meantime, I added more longs to my model-trading portfolio this morning, using the Oracle (ORCL) inspired dip to tack on positions in United Continental Holdings (UAL) and Apple (AAPL).
By the way Ben, how much is a gallon of milk at the supermarket? Watch this space.
Something on Your Mind, Ben?
https://www.madhedgefundtrader.com/wp-content/uploads/2013/03/Ben-Bernanke.jpg277197Mad Hedge Fund Traderhttps://madhedgefundtrader.com/wp-content/uploads/2019/05/cropped-mad-hedge-logo-transparent-192x192_f9578834168ba24df3eb53916a12c882.pngMad Hedge Fund Trader2013-03-21 23:02:332013-03-21 23:02:33Buy Every Black Swan
Occasionally, I so totally knock the ball out of the park that I qualify for a place in the stock picker?s Hall of Fame. That was the case when I put out a recommendation to buy LNG exporter, Cheniere Energy (LNG), a year ago (click here? for Take a Look at Cheniere Energy (LNG).
Since then, the stock has soared an eye popping 85%. The great thing here is that I think the stock is still a buy. An upside target of $30 is a chip shot, and the all time high at $45 is within range. So get a 10%-20% dip in the price, and you might shovel some into your long-term portfolio. I quote below the entire original piece:
?I am constantly asked if there are any ways investors can take advantage of the collapse of the natural gas market, where at $2.34/MMBTU prices are plumbing decade lows. I have recently made good money buying puts on the ETF (UNG), but these are not for the faint of heart. They call this contract the ?widow maker? for a good reason.
You don?t want to touch the gas producing companies, like Chesapeake (CHK) and Devon (DVN), because prices are probably going to stay down for years. Good firms that benefit from the increased volume of gas pumped are few and far between. Unless you are a large consumer of this despised molecule, such as an electric power company or a petrochemical plant, it is tough to find a profitable niche.
However, there is one company that delivers a narrow rifle shot that could do extremely well in coming years, and that is Cheniere Energy (LNG). I first started following (LNG) a decade ago when I was still wildcatting for CH4 in the Texas Barnet Shale.
Back when natural gas was trading at a loft $5/MBTU, Qatar invested $50 billion in in developing its own substantial gas resources. The plan was to liquefy the gas at -256 degrees Fahrenheit in the Middle East, ship it to the US in a fleet of specialized LNG carriers, and have Cheniere convert it back into gas at its Sabine River plant for distribution to an energy hungry US market through the Creole Trail pipeline. It all looked like a great plan, and (LNG) shares traded up to $45.
Then ?fracking? technology came along and blew up the entire model. The discovery of a new 100-year supply of gas under our feet caused gas prices to crash from a post Amaranth peak of $17/MMBTU down to $2/MMBTU. Any plans to import LNG from the other side of the world were rendered utterly worthless. Chenier?s billion-dollar investment in a gasification plant was now worth only so much scrap metal. (LNG) shares plumbed low single digits as the firm flirted with bankruptcy.
Enter China. The Middle Kingdom?s voracious demand for energy in this recovery has caused the price of oil (USO) to soar from a 2008 low of $30 to $110. Despite accounting for an overwhelming share of the world?s new energy purchases, Chinese cities are suffering from brown outs due to power shortages. This is why China is resisting immense American pressure to quit buying Texas tea from Iran.
Enter the arbitrage. While oil has been spiking, gas has been crashing. Gas is now selling at 15% of the cost of oil on an adjusted BTU basis. Another way of saying this is that you can buy oil for $16 a barrel instead of $110. It only takes a second with an abacus to understand the appeal of such a disparity.
Gas also has the additional benefits in that it is much cleaner burning than crude, lacks the sulfur and nitrogen dioxides, and produces half the carbon dioxide. That?s a big deal in Beijing where the air is so thick you can cut it with a knife on a bad day.
Enter the long-term contracts. During the 1960?s and 1970?s Japan entered into huge long term contracts to buy LNG from Australia and Indonesia to feed their own economic miracle of the day. Because very expensive and hard to get, offshore supplies were tapped, the price was set at $16/MBTU. Those contacts are now expiring. Do you think they?ll renew at the old price, or go to Cheniere for the $2 stuff? Gee, let me think about that one for a bit.
Enter Fukushima. The nuclear meltdown last March prompted Japan to shut down 49 of 54 nuclear power plants that accounted for 25% of the country?s electric power generation. The brownouts that followed forced a sweltering summer on millions as the government urged consumers to shut off air conditioners to save juice. Power companies there have been scrambling to obtain conventional energy supplies, and have been a major factor in driving oil up from $75 to $100 since the fall. Cheap gas supplies from the US would meet this demand nicely.
The trigger. Last May, Cheniere got US government permission to export 2.2 billion cubic feet a day for 20 years. That would require it to convert the existing gasification plant to a liquifaction plant, something that can be done with some expensive re-engineering. It has already found several large international buyers to take delivery of the new end product. All that was missing was the money to finish the plant. My hedge fund buddies have been accumulating this stock since October, when it bottomed at $3, expecting an angel investor to appear. But it was one of those ?someday, it might happen? kind of stories better left to long term players.
Then last week, Blackstone jumped in with a beefy $2 billion investment in Cheniere. That will enable them to obtain an additional $3 billion in debt financing needed to finish the first of two export facilities. They are now expected to come online in 2016.
How does Cheniere stack up as an investment? Frankly, it is kind of scary. The market cap is only $2 billion, and it pays no dividend. When the current spate of deals are done, it will have $5 billion in debt. The Stock has just run up from $3 to $17. And these facilities are dangerous to operate. One blew up in Texas in 1937 and killed 300 schoolchildren. As a result, local permits for these are very hard to come by.
But as you can see, a whole host of geopolitical, technology and economic strands tie together in this one company, all of which are positive for the share price. If the story comes true, as Blackstone hopes, then there could be a double or triple in the shares for the patient. To learn more about Cheniere Energy, please click here for their website at http://www.cheniere.com/default.shtml .?
Did Somebody Light a Match?
https://www.madhedgefundtrader.com/wp-content/uploads/2013/03/Homes-rubble.jpg260385Mad Hedge Fund Traderhttps://madhedgefundtrader.com/wp-content/uploads/2019/05/cropped-mad-hedge-logo-transparent-192x192_f9578834168ba24df3eb53916a12c882.pngMad Hedge Fund Trader2013-03-21 23:01:552013-03-21 23:01:55Revisiting Cheniere Energy (LNG)
Featured Trade: (TRADE ALERT SERVICE SEIZES 31.8% GAIN IN 2013), (SPY), (FXY), (IWM, (BAC), (AIG), (FCX), (FXE), (FXB), (GLD), (USO), (THE BULL CASE FOR BANK OF AMERICA), (BAC), (WHEN STERILIZATION IS NOT A FORM OF BIRTH CONTROL), (TLT), (PCY), (MUB), (JNK), (TESTIMONIAL)
SPDR S&P 500 (SPY)
CurrencyShares Japanese Yen Trust (FXY)
iShares Russell 2000 Index (IWM)
Bank of America Corporation (BAC)
American International Group, Inc. (AIG)
Freeport-McMoRan Copper & Gold Inc. (FCX)
CurrencyShares Euro Trust (FXE)
CurrencyShares British Pound Sterling Tr (FXB)
SPDR Gold Shares (GLD)
United States Oil (USO)
iShares Barclays 20+ Year Treas Bond (TLT)
PowerShares Emerging Mkts Sovereign Debt (PCY)
iShares S&P National AMT-Free Muni Bd (MUB)
SPDR Barclays High Yield Bond (JNK)
https://madhedgefundtrader.com/wp-content/uploads/2019/05/cropped-mad-hedge-logo-transparent-192x192_f9578834168ba24df3eb53916a12c882.png00Mad Hedge Fund Traderhttps://madhedgefundtrader.com/wp-content/uploads/2019/05/cropped-mad-hedge-logo-transparent-192x192_f9578834168ba24df3eb53916a12c882.pngMad Hedge Fund Trader2013-03-21 09:20:072013-03-21 09:20:07March 21, 2013
The Trade Alert Service of the Mad Hedge Fund Trader has posted a 31.8% profit year to date, taking it to another new all time high. The 27-month total return has punched through to an awesome 86.9%, compared to a miserable 18.5% return for the Dow average during the same period. That raises the average annualized return for the service to 36.5%, elevating it to the pinnacle of hedge fund ranks.
My bet that the stock markets would continue to grind up to new all time highs in the face of complete disbelief and multiple international shocks paid off big time, as I continued to run long positions in the S&P 500 and Bank of America (BAC).
My substantial short volatility positions are contributing to profits daily, with the closely watched (VIX) Index plummeting to a new five year low at 11.5%. I booked nice profits from holdings in American International Group (AIG) and copper producer, Freeport McMoRan (FCX), and the Russell 2000 (IWM). I also prudently doubled up my short positions in the Japanese yen for the third time this year.
It has truly been a month where everything is working. Even my short positions in deep out-of-the-money calls on the (SPY) are breaking even. While the (SPY) has been going up like clockwork, it has not been appreciated fast enough to hurt the position.
Trade Alerts that I wrote up, but never sent, worked. That?s because I have been 100% invested for the entire year in long stock/short positions. However, followers of my biweekly strategy webinars caught my drift and benefited from the thinking, and many did these trades on their own. These included shorts in the Treasury bond market, (TLT), the Euro (FXE), (EUO), and the British pound (FXB).
Sometimes the best trades are the ones you don?t do. I have been able to dodge the bullets that have been killing off other hedge funds, including those in gold (GLD), oil (USO), and commodities (CORN), (CU).
All told, the last 24 consecutive recommendations of the Trade Alert Service have been profitable. I have two trades to go to beat this record. Watch this space.
Global Trading Dispatch, my highly innovative and successful trade-mentoring program, earned a net return for readers of 40.17% in 2011 and 14.87% in 2012. The service includes my Trade Alert Service, daily newsletter, real-time trading portfolio, an enormous trading idea database, and live biweekly strategy webinars. To subscribe, please go to my website at www.madhedgefundtrader.com, find the ?Global Trading Dispatch? box on the right, and click on the lime green ?SUBSCRIBE NOW? button.
00Mad Hedge Fund Traderhttps://madhedgefundtrader.com/wp-content/uploads/2019/05/cropped-mad-hedge-logo-transparent-192x192_f9578834168ba24df3eb53916a12c882.pngMad Hedge Fund Trader2013-03-21 09:18:552013-03-21 09:18:55Trade Alert Service Seizes 31.8% Profit in 2013
Legal Disclaimer
There is a very high degree of risk involved in trading. Past results are not indicative of future returns. MadHedgeFundTrader.com and all individuals affiliated with this site assume no responsibilities for your trading and investment results. The indicators, strategies, columns, articles and all other features are for educational purposes only and should not be construed as investment advice. Information for futures trading observations are obtained from sources believed to be reliable, but we do not warrant its completeness or accuracy, or warrant any results from the use of the information. Your use of the trading observations is entirely at your own risk and it is your sole responsibility to evaluate the accuracy, completeness and usefulness of the information. You must assess the risk of any trade with your broker and make your own independent decisions regarding any securities mentioned herein. Affiliates of MadHedgeFundTrader.com may have a position or effect transactions in the securities described herein (or options thereon) and/or otherwise employ trading strategies that may be consistent or inconsistent with the provided strategies.