While the Diary of a Mad Hedge Fund Trader focuses on investment over a one week to six-month time frame, Mad Day Trader, provided by Bill Davis, will exploit money-making opportunities over a brief ten minute to three day window. It is ideally suited for day traders, but can also be used by long-term investors to improve market timing for entry and exit points. Read more
Global Market Comments
October 2, 2018
Fiat Lux
Featured Trade:
(HOW FINTECH IS EATING THE BANKS LUNCH),
(BAC), (C), (WFC), (SQ), (PYPL),
(WCAGY), (FISV), (INTU), (BABA),
(WE’RE MAKING SOME CHANGES HERE AT MAD HEDGE FUND TRADER)
When John identifies a strategic exit point, he will send you an alert with specific trade information as to what security to sell, when to sell it, and at what price. Most often, it will be to TAKE PROFITS, but, on rare occasions, it will be to exercise a STOP LOSS at a predetermined price to adhere to strict risk management discipline. Read more
While the Diary of a Mad Hedge Fund Trader focuses on investment over a one week to six-month time frame, Mad Day Trader, provided by Bill Davis, will exploit money-making opportunities over a brief ten minute to three day window. It is ideally suited for day traders, but can also be used by long-term investors to improve market timing for entry and exit points. Read more
Given the ballistic growth of our business here at the Mad Hedge Fund Trader, you will soon be seeing some major improvements in the service.
You may have already noticed a substantial upgrade to our website. Further changes will be ongoing in the coming months promising better functionality and faster speeds. Some 10,000 pages of content is a lot to manage.
Mad Hedge Hot Tips started six weeks ago and have proven wildly successful. It enables us to have a more immediate and constant contact with our readers which has become crucial in this hyper accelerating fast forward world.
Our online customer support telephone number has changed. The new one is 347-480-1034. This is a high tech global online telephone number that operates 24 hours a day. If you can’t get through just leave a voicemail with the English lady with the posh accent. It will be transcribed instantly and emailed to us wherever we are.
Hey, what’s the point in publishing the Mad Hedge Technology Letter if you can’t use the new tech to spice up our own service?
Our mailing address has changed to a conveniently tax free domicile at:
John Thomas-Mad Hedge Fund Trader
Conifer Group LLC
PO Box 4470
Stateline, NV 89449
USA
If you want to mail me a bottle of The Glenlivet because you made so much money on you last Trade Alert, please feel free to do so.
Globalizing our production means there will be a slight delay in getting our daily content to you. Instead of 1:00 AM EST you should receive you letter by 9:00 AM EST, or 30 minutes before the New York Stock Exchange opens. Today is the exception.
Finally, it is with a heavy heart that I announce the retirement of Nancy at the end of the year, who has been diligently performing our customer support for the past six years. She is the one who has been instructing you on navigating the site, getting a new password, and dealing with the general ins and out of the Mad Hedge Fund Trader. I understand that a long cruise is in the offing.
Again, thanks for supporting our research and I look forward to meeting you at my next strategy luncheon or the Lake Tahoe conference in October.
John Thomas
CEO & Publisher
The Diary of a Mad Hedge Fund Trader

Mad Hedge Hot Tips
October 2, 2018
Fiat Lux
The Five Most Important Things That Happened Today
(and what to do about them)
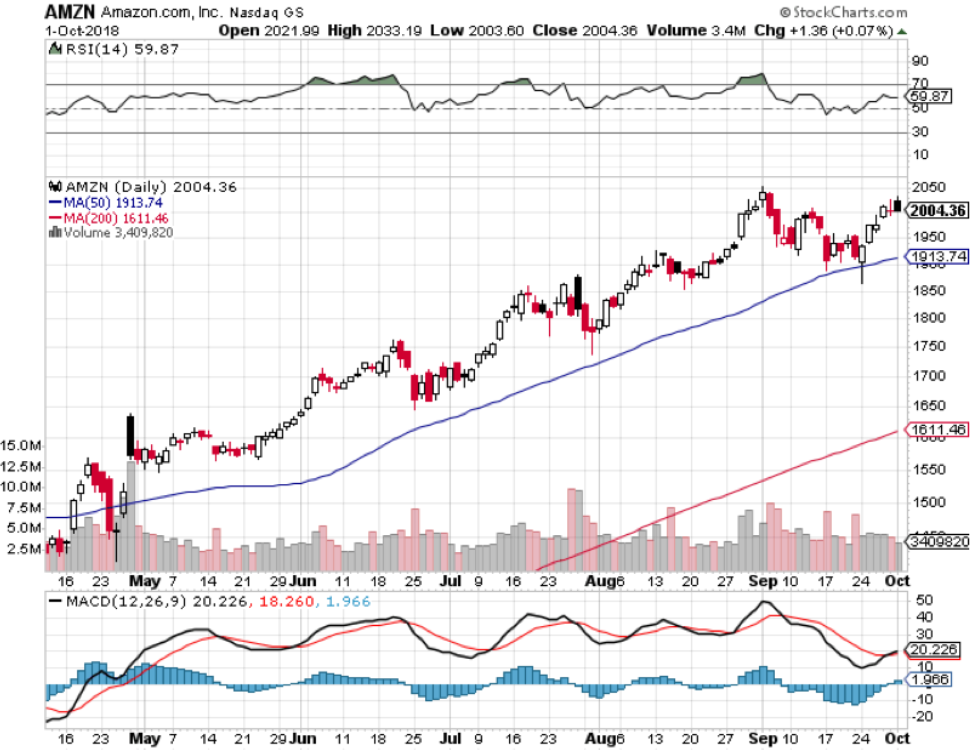
1) Amazon Raises Minimum Wage to $15. It’s about time. Too many of their 350,000 employees were sleeping in their cars. It will cost Jeff Bezos one day of extra income. Another stick on the inflation camel’s back. Click here.
2) It’s the Best Time Ever to Cheat on Your Taxes. Thanks to budget cuts audits are at a ten-year low. Suddenly, you wife has become a valuable business partner who needs entertaining on weekends. Click here.
3) Euro Hits a Six-Week Low Against the US Dollar. That’s what a Fed interest rate hike will do. Already planning next year’s European vacation. Will small caps (IWM) now make a comeback? Click here.
4) General Motors Q3 Sales Collapse by 11.1% YOY, as new Tesla 3 sales wipe out the electric Chevy Bolt, down 44%. The two hurricanes didn’t help either. Click here.
5) Oil Prices Continue to Soar. The short squeeze is on, as Europeans scramble to make up lost Iran supplies. The last time this happened we went into a recession. Click here.
Published today in the Mad Hedge Global Trading Dispatch and Mad Hedge Technology Letter:
(HOW FINTECH IS EATING THE BANKS’ LUNCH),
(BAC), (C), (WFC), (SQ), (PYPL),
(WCAGY), (FISV), (INTU), (BABA),
(WE’RE MAKING SOME CHANGES HERE AT MAD HEDGE FUND TRADER)
(TAKE A LOOK AT ENGLAND’S AMAZON),
(LON: OCDO), (KR), (AMZN),
(WE’RE MAKING SOME CHANGES HERE AT MAD HEDGE FUND TRADER)
testtest
Amazon’s reign doesn’t touch everything – there are still nooks and crannies of the business world it still doesn’t dominate.
Hard to believe, right?
As Amazon (AMZN) branches off into every known and unknown crevice of the economy to excavate fresh growth drivers, it’s hard to fathom where they won’t be in the future.
Supermarkets are one of the most innovative parts of technology right now, and even with Amazon’s grocery prize of Whole Foods, they are yet to rule over a broad-based grocer empire.
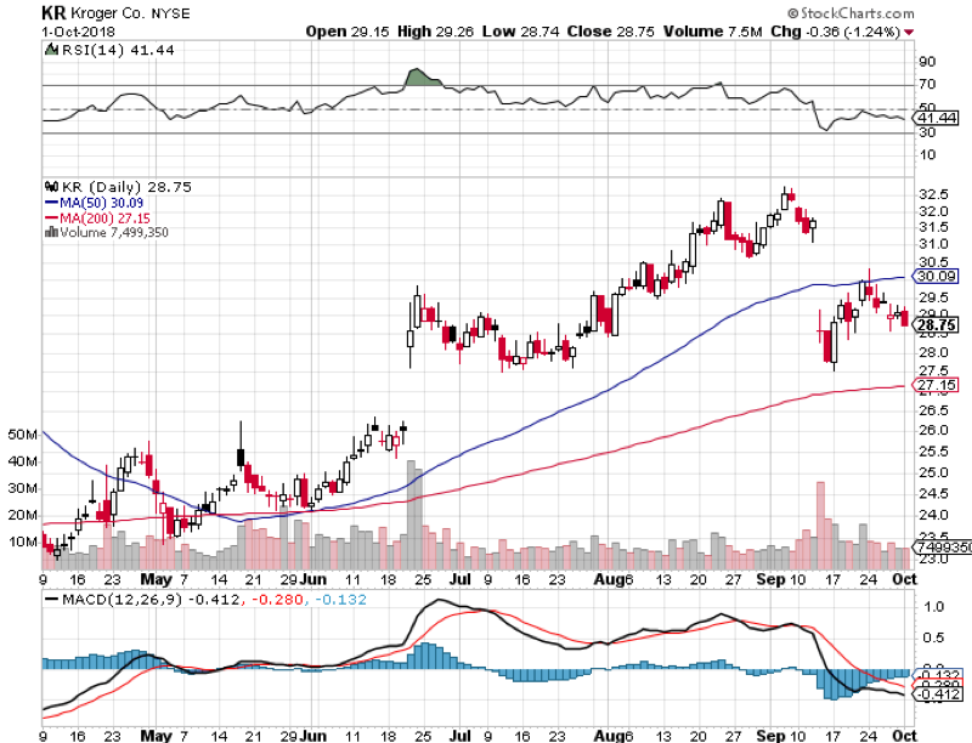
It might behoove you to discover that Kroger (KR) is on the brink of constructing a high-tech, cutting edge supermarket business that could juice up their crusade against Amazon.
In May, Kroger decided on partnering up with British-based online grocer Ocado (LON: OCDO) to build out a full-fledged, automated warehouse acting as the launching pad to their high-tech supermarket aspirations.
Kroger just announced they will identify 3 of the 20 new warehouse sites by the end of 2018 and the search is “making good progress.” These three warehouses should be functional within a year.
This is the best investment Kroger has ever made in the history of the company.
The deal also gave Kroger a 5% stake in Ocado which has no brick and mortar stores.
Even more brilliant, the deal bans Ocado from selling the technology to other American competitors.
Ocado has been voted the best online U.K. grocer by Consumers' Association magazine Which? every year since 2010.
The company went public on the London Stock Exchange in 2010 and its share price has had a banner year.
Shares were trading at £245 just 11 months ago.
The stock has been a battleground company with massive short interest because a contingent of investors believe this is just a simple grocer company.
Some investors value Ocado as a high-tech company and it is obvious which group has won out as this online grocer saw shares catapult to a tad below £1200 only to slightly retrace and consolidate.
Ocado shares are still hovering around £900 giving credence to this high-tech grocer amidst a country that is bereft of technology companies.
Softbank’s buy of Arm Holdings was the crown jewel of British tech companies to be pocketed and taken off the public markets.
Imagination Technologies was also a blockbuster name that went private after Apple infamously announced it would stop incorporating Imagination Technologies’ system-on-a-chip accounting for over half of total revenue.
Shares cratered by 70% and the company was picked up on the cheap like hawks swooping on prey by private equity fund Canyon Bridge, who is backed by the Chinese communist government.
Ocado is the torch bearer for Britain now and the smorgasbord of deals signed with France, Sweden, Canada and America indicate their intent to be a major tech player.
The breathtaking short-squeeze has put bears on alert shying away from their oversized sell button as they have been epically burnt on this trade.
This love them or hate them online grocer plans to license out its industry leading proprietary technology to revolutionize legacy supermarkets such as Kroger.
The stellar performance by Amazon has fueled its competition’s ambition to up its game in any way possible, boding well for the consumer who will benefit from better services and lower prices.
Ocado’s 20 automated warehouses dotted around America will take three years to complete.
Simply put, Ocado is best in show at building these supermarket automated warehouses and could receive a windfall of revenue around the world as grocers from all corners of the world revolutionize logistical processes.
Of the 260,000 orders they receive per week in Britain, error rates have plummeted to a subterranean level of less than 1%.
The whole process is closely monitored by algorithms, scanning, identifying and optimizing each step of the process.
Ocado’s algorithms are quite masterful – they have been programmed to even sort a bag of groceries so the eggs aren’t squashed at the bottom of the order by a sack of potatoes.
The insides are placed for perfection like the interior of Château de Malmaison straddling the suburbs of Paris, France.
These ideally placed items can travel up to 20 miles in Ocado’s boxes.
This might be fine for a land-challenged country like Britain, but distances are grotesquely larger in America, and making sure perishables arrive fit as a fiddle offers complexities to Ocado’s engineering team.
To root out any bugs, Ocado’s phalanx of engineers create digital clones of a functional warehouse mimicking the location-specific conditions and operations to eradicate any faulty processes that crop up.
This has allowed Ocado to refine different models adding to the team’s scope of versatility.
Each set of geographies will present unique challenges and adapting to local needs of each grocer will be a key to harness profitability.
Ultimately, Ocado is not new to this – they have been cultivating this type of technology for 15 years.
Drench Ocado’s model with more technology and it has become faster, more efficient, and systematically accurate.
Humans have been shipped out in favor of a bagging robot that separates out the orders needing to be placed in certain crates.
Humans are redeployed up the value chain of work and retrained as management delegates the lower grade tasks to be taken over by machines.
Ocado’s delivery vehicles are tricked out with telemetry systems, an automated communications process by which measurements and other data are collected remotely in order to ameliorate the delivery time schedules.
Betting the ranch on enhancing the technology, Ocado has rolled out a freshly designed robot that can stack and sort boxes in stacks of up to 21 boxes high.
And here is the kicker – the artificially intelligence-based technology has outsized cross-over effect applicable to a myriad of industries that require warehouses as a main input in an operation which could spawn massive layers of potential profits.
The deep commitment to innovation is costly and investors will always be anxious about the margin story, but that should not be reason to jump ship.
There is no seat at the table if a company is not armed and wielding the best technology current engineering can create.
Top-class engineers aren’t cheap, and like their brethren in Silicon Valley, engineers continue to be tech firm’s largest cost but their best asset.
Machine learning is also deployed across the customer service support platforms to ensure any complaints do not repeat.
Eventually, Ocado hopes to automate everything and once self-driving technologies become customary, they will do away with the human driver too.
They have already carried out tests showing their capabilities of functioning with this technology and did a stint of 2 weeks with little problem.
This May was the first time Ocado netted a nations big fish supermarket business with 1,300-store strong ICA Sweden.
ICA has carved out Swedish market share approaching a third.
Ocado is capitalizing on the new sense of urgency from legacy supermarkets to pivot towards technology to bolster profits.
Online supermarkets were once discarded but now seek to seize 15% of the grocery market share on the way to 20%.
Assuming that 10% is the peak is wrong especially with Ocado’s supermarket warehouse technology.
Most recently, Instacart partnered with German discount supermarket Aldi to offer delivery service.
Ocado has absolutely started to spread its wings by licensing its robot-laden supermarket warehouse technology and this is just the beginning.
More deals will be in the pipeline and consumers will much rather shop for groceries online now.
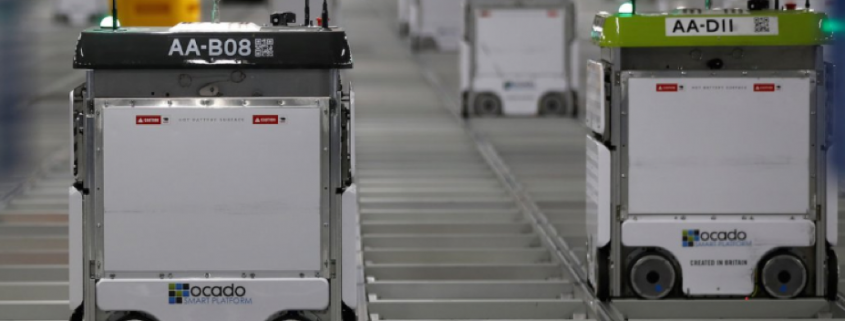
To admire the scope of Ocado’s pioneering expertise, this is their revolutionary warehouse system controlled by air traffic control technology with R2-D2-like robots careening around on a grid set-up fulfilling orders – click here to watch the video.
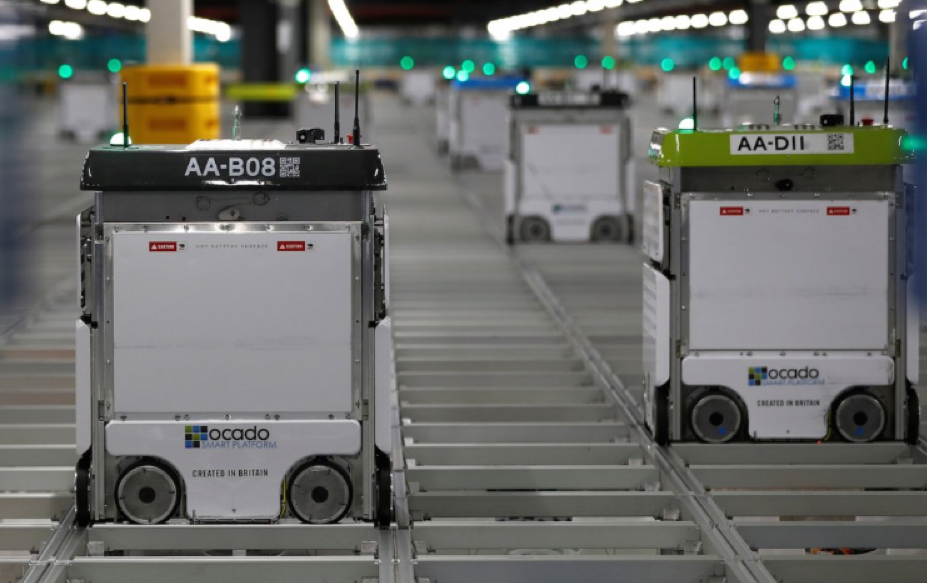
BEST OF BREED WAREHOUSE TECHNOLOGY
Mad Hedge Technology Letter
October 2, 2018
Fiat Lux
Featured Trade:
(TAKE A LOOK AT ENGLAND’S AMAZON),
(LON: OCDO), (KR), (AMZN)
(WE'RE MAKING SOME CHANGES HERE AT THE MAD HEDGE FUND TRADER)

“Only the mediocre are always at their best,” said the late American comedian Jonathan Winters.