• support@madhedgefundtrader.com
  • Member Login
Mad Hedge Fund Trader
  • Home
  • About
  • Store
  • Luncheons
  • Testimonials
  • Contact Us
  • Click to open the search input field Click to open the search input field Search
  • Menu Menu
MHFTR

The Market Outlook for the Week Ahead, or Here Comes The Four Horsemen of the Apocalypse

Diary, Newsletter, Research

Have you liked 2018 so far?

Good.

Because if you are an index player, you get to do it all over again. For the major stock indexes are now unchanged on the year. In effect, it is January 1 once more.

Unless of course you are a follower of the Mad Hedge Fund Trader. In that case, you are up an eye-popping 19.75% so far in 2018. But more on that later.

Last week we caught the first glimpse in this cycle of the investment Four Housemen of the Apocalypse. Interest rates are rising, the yield on the 10-year Treasury bond (TLT) reaching a four-year high at 2.96%. When we hit 3.00%, expect all hell to break loose.

The economic data is rolling over bit by bit, although it is more like a death by a thousand cuts than a major swoon. The heavy hand of major tariff increases for steel and aluminum is making itself felt. Chinese investment in the US is falling like a rock.

The duty on newsprint imports from Canada is about to put what's left of the newspaper business out of business. Gee, how did this industry get targeted above all others?

The dollar is weak (UUP), thanks to endless talk about trade wars.

Anecdotal evidence of inflation is everywhere. By this I mean that the price is rising for everything you have to buy, like your home, health care, college education, and website upgrades, while everything you want to sell, such as your own labor, is seeing the price fall.

We're not in a recession yet. Call this a pre-recession, which is a long-leading indicator of a stock market top. The real thing shouldn't show until late 2019 or 2020.

There was a kerfuffle over the outlook for Apple (AAPL) last week, which temporarily demolished the entire technology sector. iPhone sales estimates have been cut, and the parts pipeline has been drying up.

If you're a short-term trader, you should have sold your position in April 13 when I did. If you are a long-term investor, ignore it. You always get this kind of price action in between product cycles. I still see $200 a share in 2018. This too will pass.

This month, I have been busier than a one-armed paper hanger, sending out Trade Alerts across all asset classes almost every day.

Last week, I bought the Volatility Index (VXX) at the low, took profits in longs in gold (GLD), JP Morgan (JPM), Alphabet (GOOGL), and shorts in the US Treasury bond market (TLT), the S&P 500 (SPY), and the Volatility Index (VXX).

It is amazing how well that "buy low, sell high" thing works when you actually execute it. As a result, profits have been raining on the heads of Mad Hedge Trade Alert followers.

That brings April up to an amazing +12.99% profit, my 2018 year-to-date to +19.75%, my trailing one-year return to +56.09%, and my eight-year performance to a new all-time high of 296.22%. This brings my annualized return up to 35.55% since inception.

The last 14 consecutive Trade Alerts have been profitable. As for next week, I am going in with a net short position, with my stock longs in Alphabet (GOOGL) and Citigroup (C) fully hedged up.

And the best is yet to come!

I couldn't help but laugh when I heard that Republican House Speaker Paul Ryan announced his retirement in order to spend more time with his family. He must have the world's most unusual teenagers.

When I take my own teens out to lunch to visit with their friends, I have to sit on the opposite side of the restaurant, hide behind a newspaper, wear an oversized hat, and pretend I don't know them, even though the bill always mysteriously shows up on my table.

This will be FANG week on the earnings front, the most important of the quarter.

On Monday, April 23, at 10:00 AM, we get March Existing-Home Sales. Expect the Sohn Investment Conference in New York to suck up a lot of airtime. Alphabet (GOOGL) reports.

On Tuesday, April 24, at 8:30 AM EST, we receive the February S&P CoreLogic Case-Shiller Home Price Index, which may see prices accelerate from the last 6.3% annual rate. Caterpillar (CAT) and Coca Cola (KO) report.

On Wednesday, April 25, at 2:00 PM, the weekly EIA Petroleum Statistics are out. Facebook (FB), Advanced Micro Devices (AMD), and Boeing (BA) report.

Thursday, April 26, leads with the Weekly Jobless Claims at 8:30 AM EST, which saw a fall of 9,000 last week. At the same time, we get March Durable Goods Orders. American Airlines (AAL), Raytheon (RTN), and KB Homes (KBH) report.

On Friday, April 27, at 8:30 AM EST, we get an early read on US Q1 GDP.

We get the Baker Hughes Rig Count at 1:00 PM EST. Last week brought an increase of 8. Chevron (CVX) reports.

As for me, I am going to take advantage of good weather in San Francisco and bike my way across the San Francisco-Oakland Bay Bridge to Treasure Island.

Good Luck and Good Trading.


https://www.madhedgefundtrader.com/wp-content/uploads/2018/04/Trailing-one-year-story-1-image-1-2-e1524264283463.jpg 384 580 MHFTR https://madhedgefundtrader.com/wp-content/uploads/2019/05/cropped-mad-hedge-logo-transparent-192x192_f9578834168ba24df3eb53916a12c882.png MHFTR2018-04-23 01:08:102018-04-23 01:08:10The Market Outlook for the Week Ahead, or Here Comes The Four Horsemen of the Apocalypse
MHFTR

Diving Back Into the (VIX)

Diary, Newsletter, Research

I think we are only days, at the most weeks, away from the next crisis coming out of Washington. It can come for any of a dozen different reasons.

Wars with Syria, Iran or North Korea. The next escalation of the trade war with China. The failure of the NAFTA renegotiation. Another sex scandal. The latest chapter of the Mueller investigation.

And then there's the totally unexpected, out of the blue black swan.

We are spoiled for choice.

For stock investors, it's like hiking on the top of Mount Whitney during a thunderstorm with a steel ice axe in hand.

So, I am going to buy some fire insurance here while it is on sale to protect my other long positions in technology and financial stocks.

Since April 1, the Volatility Index (VIX) has performed a swan dive from $26 to $15, a decline of 42.30%.

I have always been one to buy umbrellas during parched summers, and sun tan lotion during the frozen depths of winter. This is an opportunity to do exactly that.

Until the next disaster comes, I expect the (VXX) to trade sideways from here, and not plumb new lows. These days, a premium is paid for downside protection.

The year is playing out as I expected in my 2018 Annual Asset Class Review (Click here for the link.). Expect double the volatility with half the returns.

So far, so good.

If you don't do options buy the (VXX) outright for a quick trading pop.

You may know of the Volatility Index from the many clueless talking heads, beginners, and newbies who call (VIX) the "Fear Index."

For those of you who have a PhD in higher mathematics from MIT, the (VIX) is simply a weighted blend of prices for a range of options on the S&P 500 index.

The formula uses a kernel-smoothed estimator that takes as inputs the current market prices for all out-of-the-money calls and puts for the front month and second month expirations.

The (VIX) is the square root of the par variance swap rate for a 30-day term initiated today. To get into the pricing of the individual options, please go look up your handy-dandy and ever-useful Black-Scholes equation.

You will recall that this is the equation that derives from the Brownian motion of heat transference in metals. Got all that?

For the rest of you who do not possess a PhD in higher mathematics from MIT, and maybe scored a 450 on your math SAT test, or who don't know what an SAT test is, this is what you need to know.

When the market goes up, the (VIX) goes down. When the market goes down, the (VIX) goes up. Period.

End of story. Class dismissed.

The (VIX) is expressed in terms of the annualized movement in the S&P 500, which today is at $806.06.

So, for example, a (VIX) of $15.48 means that the market expects the index to move 4.47%, or 121.37 S&P 500 points, over the next 30 days.

You get this by calculating $15.48/3.46 = 4.47%, where the square root of 12 months is 3.46 months.

The volatility index doesn't really care which way the stock index moves. If the S&P 500 moves more than the projected 4.47%, you make a profit on your long (VIX) positions. As we know, the markets these tumultuous days can move 4.47% in a single day.

I am going into this detail because I always get a million questions whenever I raise this subject with volatility-deprived investors.

It gets better. Futures contracts began trading on the (VIX) in 2004, and options on the futures since 2006.

Since then, these instruments have provided a vital means through which hedge funds control risk in their portfolios, thus providing the "hedge" in hedge fund.

If you make money on your (VIX) trade, it will offset losses on other long positions. This is how the big funds most commonly use it.

If you lose money on your long (VIX) position, it is only because all your other long positions went up.

But then no one who buys fire insurance ever complains when their house doesn't burn down.


"Chance Favors the Prepared," said French scientist Louis Pasteur.

https://www.madhedgefundtrader.com/wp-content/uploads/2018/04/John-and-swans-story-1-image-4-e1524088218881.jpg 250 300 MHFTR https://madhedgefundtrader.com/wp-content/uploads/2019/05/cropped-mad-hedge-logo-transparent-192x192_f9578834168ba24df3eb53916a12c882.png MHFTR2018-04-19 01:07:062018-04-19 01:07:06Diving Back Into the (VIX)
MHFTR

The Great American Jobs Mismatch

Diary, Newsletter, Research

With the Weekly Jobless Claims bouncing around a new 43-year low at 220,000, it's time to review the state of the US labor market.

Yes, I know this research piece isn't going to generate an instant Trade Alert for you.

But it is essential in your understanding of the big picture.

There are also thousands of students who read my website looking for career advice, and I have a moral obligation to read the riot act to them.

With a 4.1% headline unemployment rate, the US economy is now at its theoretical employment maximum. If you can't get a job now, you never will.

We may see a few more tenths of a percent decline in the rate from here, but no more. To get any lower than that you have to go all the way back to WWII.

Then there was even a shortage of one-armed, three-fingered, illiterate recruits with venereal disease, the minimum US Army recruitment standards of the day.

Speaking to readers across the country and perusing the Department of Labor data, I can tell you that not all is equal in the jobs market today.

You can blame America's halls of higher education, which are producing graduates totally out of sync with the nation's actual skills needs.

Take a look at this table of graduating majors to job offers, and you'll see what I am talking about:

Major - Job Offers Offered per Graduating Major

Computer Science - 21:1
Engineering - 15:1
Physical Sciences (oil) - 13:1
Humanities - 5:1
Business and accounting - 4:1
Economics - 4:1
Agriculture - 2:1
Education - 0.4:1
Health Sciences - 0.2:1

To clarify the above data, there are 21 companies attempting to hire each computer science graduate today, while there are five kids battling it out to get each job in Health Sciences.

To understand what's driving these massive jobs per applicant disparities, take a look at the next table nationally ranking graduating majors desired by corporations.

Graduating Majors Desired by Employers

81% - Business and Accounting
76% - Engineering
64% - Computer science
34% - Economics
21% - Physical Science
12% - Humanities
5% - Agriculture
2% - Health Science

There is something screamingly obvious about these numbers.

Colleges are not producing what employers want.

This is creating enormous imbalances in the jobs market.

It explains why computer science students are landing $150,000-a-year jobs straight out of school, complete with generous benefits and health care. Many employers in Silicon Valley are now offering to pay down student debt in order to get the most desirable candidates to sign a contract.

In the meantime, Health Sciences and Humanities graduates are lucky to land a $25,000-a-year posting at a nonprofit with no benefits and Obamacare. And there are no offers to pay down student debt, which can rise to as much as $200,000 for an Ivy League degree.

Agriculture grads usually go to work on a family farm, which they eventually inherit.

As a result of these dismal figures, the character of American education is radically changing.

With students now graduating with an average of $35,000 in debt, no one can afford to remain jobless upon graduation for long.

That's why the number of Humanities graduates has declined from 9% in 2012 to 6% today.

Colleges are getting the message. Since 1990, one-third of those with the words "liberal arts" in their name or prospectus have dropped the term.

Students who do stick with anthropology, philosophy, English literature, or history are learning a few tricks as well.

Add a minor in Accounting and Management and it will increase your first-year salary by $13,000. Toss in some Data Base Management skills, and the increase will be even greater.

And online marketing? The world is your oyster!

These realities have even come home to my own family.

I have a daughter working on a PhD in Education from the University of California, and the mathematics workload is enormous, especially in statistics.

It is all so she can qualify for government research grants upon graduation.

The students themselves are partly to blame for this mismatch.

While recruiters report an average of $45,000 a year as an average first year offer, the graduates themselves are expecting an average first-year income of $53,000.

Companies almost universally report that interviewees have a "bloated" sense of their own abilities, poor interviewing skills, and unrealistic pay expectations.

Some one-third of all applicants are unqualified for the jobs for which they are applying.

The good news is that everyone gets a job eventually. A National Association of Colleges and Employers survey says that companies plan to hire 5% more college graduates than last year.

And where do all of those Humanities grads eventually go.

A lot become financial advisors.

Just ask.


Sorry, STEM Students Only!

https://www.madhedgefundtrader.com/wp-content/uploads/2018/04/College-photo-story-2-image-1-e1524087053435.jpg 225 300 MHFTR https://madhedgefundtrader.com/wp-content/uploads/2019/05/cropped-mad-hedge-logo-transparent-192x192_f9578834168ba24df3eb53916a12c882.png MHFTR2018-04-19 01:06:582018-04-19 01:06:58The Great American Jobs Mismatch
MHFTR

Why the Homebuilders Are Not Dead Yet

Diary, Newsletter, Research

It was as if someone had turned out the lights.

The homebuilders, after delivering one of the most prolific investment performance of any sector until the end of January, suddenly collapsed.

Since then, they have been dead as a door knob, flat on their backs, barely exhibiting a breath of life. While most of the market has since seen massive short covering rallies, the homebuilders have remained moribund.

The knee-jerk reaction has been to blame rising interest rates. But in fact, rates have barely moved since the homebuilders peaked, the 10-year US treasury yield remaining confined to an ultra-narrow tedious 2.72% to 2.95% yield.

The surprise Canadian limber import duty has definitely hurt, raising the price of a new home by an average of $3,000. But that is not enough to demolish the entire sector, especially given long lines at homebuilder model homes.

Are the homebuilders gone for good? Or are they just resting.

I vote for the later.

For years now, I have begged, pleaded, and beseeched readers to pour as much money as they can into residential real estate.

Investing in your own residence has generated far and away the largest returns on investment for the past five years, and this will continue for the next 10 to 15 years.

For we are still in the early innings of a major real estate boom.

A home you buy today could increase in value tenfold by 2030, and more if you do so on the high-growth coasts.

And while I have been preaching this view to followers for years, I have been assaulted by the slings and arrows of naysayers predicting that the next housing crash is just around the corner - only this time, it will be worse.

I have recently gained some important new firepower in my campaign.

My friends at alma mater UC Berkley (Go Bears!), specifically the Fisher Center for Real Estate and Urban Economics, have just published a report written by the Rosen Consulting Group that is blowing the socks off the entire real estate world.

The implications for markets, and indeed the nation as a whole, are nothing less than mind-blowing.

It's like having a Marine detachment of 155 mm howitzers suddenly come in on your side.

The big revelation is that only a few minor tweaks and massaging of the Dodd-Frank Wall Street Reform and Consumer Protection Act of 2010 could unleash a new tidal wave of home buyers that will send house prices, and the shares of homebuilders (ITB) ballistic.

The real estate industry would at last be restored to its former glory.

That's the happy ending. Now let's get down to the nitty gritty.

First, let's review the wreckage of the 2008 housing crash.

Real estate probably suffered more than any other industry during the Great Recession.

After all, the banks received a federal bailout, and General Motors was taken over by the Feds. Remember Cash for Clunkers?

No such luck with politically unconnected real estate agents and homebuilders.

As a result, private homeownership in the US has cratered from 69.2% in 2006 to 63.4% in 2016, a 50-year low.

Homeownership for married couples was cut from 84.1% to 79.6%.

Among major cities, San Diego led the charge to the downside, an area where minority and immigrant participation in the market is particularly high, with homeownership shrinking from 65.7% to a lowly 51.8%.

Home price declines were worse in the major subprime cities of Las Vegas, Phoenix, and Miami.

There were a staggering 9.4 million foreclosures during 2007-2014, with adjustable rate loans accounting for two-thirds of the total.

Some 8.7 million jobs were lost from 2007-2010, while the unemployment rate soared from 5.0% to 10%. The collapse in disposable income that followed made a rapid recovery in home prices impossible.

As a result, real estate's contribution to US GDP growth fell from 17.9% of the total to only 15.6% in 2016.

That is a big hit for the economy and is a major reason why growth has remained stuck in recent years at a 2% annual rate.

While the ruins were still smoking, Congress passed Dodd-Frank in 2010. The bill succeeded in preventing any more large banks from going under, with massive recapitalization requirements.

As a result, US banks are now the strongest in the world (and also a great BUY at these levels).

But it also clipped the banks' wings with stringent new lending restrictions.

I recently refinanced my homes to lock in 3% interest rates for the long term, since inflation is returning, and I can't tell you what a nightmare it was.

I had to pay a year's worth of home insurance and county property taxes in advance, which were then kept in an impound account.

I was forced to supply two years worth of bank statements for five different accounts.

Handing over two years worth of federal tax returns wasn't good enough.

To prevent borrowers from ginning up their own on TurboTax, a common tactic for marginal borrowers before the last crash, they must be independently verified with a full IRS transcript.

Guess what? A budget constrained IRS is remarkably slow and inefficient at performing this task. Three attempts are common, while your loan sits in limbo.

(And don't even think of asking for Donald Trump's return when you do this. They have NO sense of humor at the IRS!)

Heaven help you if you have a FICO score under 700.

I had to hand over a dozen letters of explanation dealing with assorted anomalies in my finances. My life is complicated.

Their chief goal seemed to be to absolve the lender from any liability whatsoever.

And here's the real killer.

From 2014, banks were forced to require from borrowers a 43% debt service to income ratio. In other words, your monthly interest payment, property taxes, and real estate taxes can't exceed 43% of your monthly gross income.

This hurdle alone has been the death of a thousand loans.

It is no surprise then that the outstanding balance of home mortgages has seen its sharpest drop in history, from $11.3 trillion to $9.8 trillion during 2008-2014. It is down by a third since the 2007 peak.

Loans that DO get done have seen their average FICO scores jump from 707 to 760.

Rocketing home prices are making matters worse, by reducing affordability.

Only 56% of the population can now qualify to buy the mean American home priced at $224,000, which is up 7.7% YOY.

Residential fixed investment is now 32% lower than the 2005 peak.

Also weighing on the market was a student loan balance that rocketed by 400% to $1.3 trillion since 2003. This eliminated a principal source of first-time buyers from the market, a major source of new capital at the low end.

Now for the good news.

Keep Dodd-Frank's capital requirements, but ease up on the lending standards only slightly, and all of the trends that have been a drag on the market quickly reverse.

And yes, some 2.3% in missing US GDP comes back in a hurry, and then some. That's a whole year's worth of economic growth at current rates.

Rising incomes generated by a full employment economy increase loan approvals.

Foreclosure rates will fall.

More capital will pour into homebuilding, alleviating severely constrained supply.

More investment in homes as inflation hedges steps up from here.

The entry of Millennials into the market in a serious way for the first time further increases demand.

Promised individual tax cuts will add a turbocharger to this market.

There is one way the Trump administration could demolish this housing renaissance.

If the deductibility of home mortgage interest from taxable income on Form 1040 Schedule "A" is cut back or eliminated to pay for tax cuts for the wealthy, a proposal now being actively discussed in the White House, the whole party is canceled.

The average American will lose his biggest tax break, and the impact on housing will be huge.

A continued war on immigrants will also hurt, which accounted for one-third of all new households from 1994-2015.

You see, we let them in for a good reason.

Assuming this policy self-inflicted wound doesn't happen, the entire homebuilding sector is a screaming "BUY."

On the menu are Toll Brothers (TOL), DH Horton (DHI), and Pulte Homes (PHM).

You can also add the IShares US Home Construction ETF (ITB), a basket of the leading homebuilding names (For the prospectus, click here.)

To read the UC Berkeley report in its entirety, entitled Homeownership in Crisis: Where Are We Now? a must for any serious real estate professional or investor, please download the PDF file for free by clicking here.

The bottom line here is that after a three-month break, the stirrings of a recovery in homebuilders may be just beginning.


Where It's Hot


It's Always Better on the Coasts

https://www.madhedgefundtrader.com/wp-content/uploads/2018/04/Coast-image-6-e1524006948851.jpg 327 580 MHFTR https://madhedgefundtrader.com/wp-content/uploads/2019/05/cropped-mad-hedge-logo-transparent-192x192_f9578834168ba24df3eb53916a12c882.png MHFTR2018-04-18 01:06:012018-04-18 01:06:01Why the Homebuilders Are Not Dead Yet
MHFTR

Has the Recession Already Started?

Diary, Newsletter, Research

It started with a slow drip.

Then it became a trickle.

Now it is an undeniable torrent.

Negative economic data reports, once as rare as hen's teeth, have suddenly become as common as NRA bumper stickers at a Trump rally. The economic data flow has definitely turned sour.

Is this a growth scare? Or is it the beginning of a full-blown recession, the return of which investors have been dreading for the past nine years.

The data flow was hotter than hot going into January, taking the stock market to a new all-time high.

We only got final confirmation of this a few weeks ago, when the last report on Q4 GDP rose by 0.2% to 2.9%, one of the best readings in years.

Then the rot began.

At first it was just one or two minor, inconsequential reports here and there. Then they ALL turned bad. Not by large amounts, but by small incremental ones, frequent enough to notice.

The February Dallas Fed General Business Activity Index dropped from 28 to 21, the March Institute of Supply Management Manufacturing Activity declined from 61 to 59, while Services Activity shaved a point, from 59 to 58.

The big one has been the March Nonfarm Payroll Report - that printed a soft 103,000 - which was far below the recent average of 200,000.

As recently as this morning, the National Association of Home Builders Sentiment Index dropped a point from 70 to 69.

When you see one cockroach, it is easy to ignore. When it becomes a massive infestation, it is a different story completely.

The potential explanations for the slowdown abound.

There is no doubt that the Trade War with China is eroding business confidence, as is the secret renegotiation of the North American Free Trade Agreement (NAFTA).

Decisions on major capital investments by companies were a slam dunk three months ago. Now, many are definitely on hold.

There is abundant evidence that the Chinese are scaling back investment in the US and pausing new trade deals with American counterparties. They have been boycotting purchases of new US Treasury bonds for eight months.

The new import duty for Canadian timber is raising the cost of low-end housing, worsening affordability and causing builders to cut back.

Instead they are refocusing efforts on high-end housing where profit margins are much wider.

Shooting wars with Syria, North Korea, and Iran are permanently just over the horizon, further giving nervous investors pause.

And the general level of chaos coming out of Washington, including the unprecedented level of administrations firings and resignations, are scaring a lot of people.

Since I am a person who puts my money where my mouth is every day of the year, I'll give you my 10 cents worth on what all this really means.

Two weeks ago I started piling into to an ultra-aggressive 100% "RISK ON" trading book, loading the boat with a range of asset classes, including longs in financial and technology stocks, and gold and big shorts in the bond market.

My bet is that while however serious all of the above concerns may be, they pale in comparison with Q1 2018 earnings growth of historic proportions that is now unfolding, prompted by the December tax bill.

The second 10$ correction of 2018 had nothing to do with fundamentals. It was all about hot money retreating to the sideline until the bad news waned and the good news returned.

And so it has. Forecast Q1 earnings are now looking to come in above 20% YOY. These will be reports for the ages.

My bet has paid off in spades, with followers of my Mad Hedge Trade Alert Service up 10.70% so far in April, up +17.46% in 2018, and up a breathtaking 54.04% on a trailing 12-month basis. It is a performance that causes my competitors to absolutely weep.

If fact, the rest of 2018 could play out exactly as it has done so far, with frantic sell-offs following the end of each quarterly reporting period, followed by slow grind-up rallies leading into the next. Technology will lead the rallies every time.

Which means we may go absolutely nowhere in the indexes 2018, but have a whole lot of fun getting there. If you see this coming you can make a ton of money trading around it.

With our current positions, Mad Hedge followers could be up 25% on the year as soon as mid-May.

Which raises the question of, "When will the recession really start?"

My bet is sometime in 2019, when earnings growth downshifts from 20% to 10% or even 5%.

If this happens in the face of an inverting yield curve where short-term interest rates are higher than long-term ones, and a continuing trade war AND shooting wars, and broadening Washington scandals, then a recession becomes a sure thing.

A bear market should precede that by about six months.

So date those high-risk positions, don't marry them.


https://www.madhedgefundtrader.com/wp-content/uploads/2018/04/JT-story-2-image-e1523656976555.jpg 237 300 MHFTR https://madhedgefundtrader.com/wp-content/uploads/2019/05/cropped-mad-hedge-logo-transparent-192x192_f9578834168ba24df3eb53916a12c882.png MHFTR2018-04-17 01:07:412018-04-17 01:07:41Has the Recession Already Started?
MHFTR

Where The Economist "Big Mac" Index Finds Currency Value

Diary, Newsletter, Research

My former employer, The Economist, once the ever-tolerant editor of my flabby, disjointed, and juvenile prose (Thanks Peter and Marjorie), has released its "Big Mac" index of international currency valuations.

Although initially launched as a joke three decades ago, I have followed it religiously and found it an amazingly accurate predictor of future economic success.

The index counts the cost of McDonald's (MCD) premium sandwich around the world, ranging from $7.20 in Norway to $1.78 in Argentina, and comes up with a measure of currency under and over valuation.

What are its conclusions today? The Swiss franc (FXF), the Brazilian real, and the Euro (FXE) are overvalued, while the Hong Kong dollar, the Chinese Yuan (CYB), and the Thai baht are cheap.

I couldn't agree more with many of these conclusions. It's as if the august weekly publication was tapping The Diary of the Mad Hedge Fund Trader for ideas.

I am no longer the frequent consumer of Big Macs that I once was, as my metabolism has slowed to such an extent that in eating one, you might as well tape it to my ass. Better to use it as an economic forecasting tool than a speedy lunch.


The World's Most Expensive Big Mac

https://www.madhedgefundtrader.com/wp-content/uploads/2018/04/Worlds-most-expensive-big-mac-story-2-image-2-e1523918262313.jpg 225 300 MHFTR https://madhedgefundtrader.com/wp-content/uploads/2019/05/cropped-mad-hedge-logo-transparent-192x192_f9578834168ba24df3eb53916a12c882.png MHFTR2018-04-17 01:06:412018-04-17 01:06:41Where The Economist "Big Mac" Index Finds Currency Value
MHFTR

The Market Outlook for the Week Ahead, or The Week That Nothing Happened

Diary, Newsletter, Research

This was the week that American missiles were supposed to rain down upon war-torn Syria, embroiling Russia in the process. It didn't happen.

This was the week that the president was supposed to fire special prosecutor Robert Mueller, who with his personal lawyer is currently reading his private correspondence for the past decade with great interest. That didn't happen either.

It was also the week that China was supposed to raise the stakes in its trade war with the United States. Instead, President Xi offered a conciliatory speech, taking the high road.

What happens when you get a whole lot of nothing?

Stocks rally smartly, the S&P 500 (SPY) rising by 2.87% and the NASDAQ (QQQ) tacking on an impressive 3.45%. Several of the Mad Hedge long positions jumped by 10%.

And that pretty much sums up the state of the market today.

Get a quiet week and share prices will naturally rise, thanks to the power of that fastest earnings growth in history, stable interest rates, a falling dollar, and gargantuan share buybacks that are growing by the day.

With a price earnings multiple of only 16, shares are offering investors the best value in three years, and there is very little else to buy.

This is why I am running one of the most aggressive trading books in memory with a 70% long 30% short balance.

Something else unusual happened this week. I added my first short position of the year in the form of puts on the S&P 500 right at the Friday highs.

And, here is where I am sticking to my guns on my six-month range trade call. If you buy every dip and sell every rally in a market that is going nowhere, you will make a fortune over time.

Provided that the (SPY) stays between $250 and $277 that is exactly what followers of the Mad Hedge Fund Trader are going to do.

By the way, 3 1/2 months into 2018, the Dow Average is dead unchanged at 24,800.

Will next week be so quiet?

I doubt it, which is why I'm starting to hedge up my trading book for the first time in two years. Washington seems to be an endless font of chaos and volatility, and the pace of disruption is increasing.

The impending attack on Syria is shaping up to more than the one-hit wonder we saw last year. It's looking more like a prolonged air, sea, and ground campaign. When your policies are blowing up, nothing beats like bombing foreigners to distract attention.

Expect a 500-point dive in the Dow Average when this happens, followed by a rapid recovery. Gold (GLD) and oil prices (USO) will rocket. The firing of Robert Mueller is worth about 2,000 Dow points of downside.

Followers of the Mad Hedge Trade Alert Service continued to knock the cover off the ball.

I continued to use weakness to scale into long in the best technology companies Alphabet (GOOGL) and banks J.P. Morgan Chase (JPM), and Citigroup (C). A short position in the Volatility Index (VXX) is a nice thing to have during a dead week, which will expire shortly.

As hedges, I'm running a double short in the bond market (TLT) and a double long in gold (GLD). And then there is the aforementioned short position in the (SPY). I just marked to market my trading book and all 10 positions are in the money.

Finally, I took profits in my Apple (AAPL) long, which I bought at the absolute bottom during the February 9 meltdown. I expect the stock to hit a new all-time high in the next several weeks.

That brings April up to a +5.81% profit, my trailing one-year return to +50.23%, and my eight-year average performance to a new all-time high of 289.19%. This brings my annualized return up to 34.70%.

The coming week will be a slow one on the data front. However, there has been a noticeable slowing of the data across the board recently.

Is this a one-off weather-related event, or the beginning of something bigger? Is the trade war starting to decimate confidence and drag on the economy?

On Monday, April 16, at 8:30 AM, we get March Retail Sales. Bank of America (BAC) and Netflix (NFLX) report.

On Tuesday, April 17, at 8:30 AM EST, we receive March Housing Starts. Goldman Sachs (GS) and United Airlines (UAL) report.

On Wednesday, April 18, at 2:00 PM, the Fed Beige Book is released, giving an insider's view of our central bank's thinking on interest rates and the state of the economy. Morgan Stanley (MS) and American Express (AXP) report.

Thursday, April 19, leads with the Weekly Jobless Claims at 8:30 AM EST, which saw a fall of 9,000 last week. Blackstone (BX) and Nucor (NUE) report.

On Friday, April 20, at 10:00 AM EST, we get the Baker Hughes Rig Count at 1:00 PM EST. Last week brought an increase of 8. General Electric (GE) and Schlumberger (SLB) report.

As for me, I'll be heading into San Francisco's Japantown this weekend for the annual Northern California Cherry Blossom Festival. I'll be viewing the magnificent flowers, listening to the Taiko drums, eating sushi, and practicing my rusty Japanese.

Good Luck and Good Trading.


https://www.madhedgefundtrader.com/wp-content/uploads/2018/04/Japan-pix-story-1-image-6.jpg 330 219 MHFTR https://madhedgefundtrader.com/wp-content/uploads/2019/05/cropped-mad-hedge-logo-transparent-192x192_f9578834168ba24df3eb53916a12c882.png MHFTR2018-04-16 01:07:542018-04-16 01:07:54The Market Outlook for the Week Ahead, or The Week That Nothing Happened
MHFTR

Trading the New Volatility

Diary, Newsletter, Research

I have been trading the Volatility Index (VIX) since it was first created in 1993.

Let me tell you, the Volatility Index we have today is not your father's Volatility Index.

The (VIX) was originally a weighted measure of the implied volatility of just eight S&P 100 at-the-money put and call options.

Ten years later, in 2004, it expanded to use options based on a broader index, the S&P 500, which allows for a more accurate view of investors' expectations on future market volatility. That formula continues until today.

There were two generational lows in the (VIX) that have taken place since inception.

The first was in 1998 during the heyday of the mammoth hedge fund Long-Term Capital Management. The firm sold short volatility down to the $8 level and used the proceeds to buy every bullish instrument in the universe, from Japanese equities to Danish mortgage bonds and Russian government debt.

Then the Russian debt default took place and the (VIX) rocketed to $40. LTCM suffered losses in excess of 125% of its capital, and went under in two weeks. It took two years to unwind all the positions, while the (VIX) remained $40 for a year.

To learn more detail about this unfortunate chapter in history, please read When Genius Failed by Roger Lowenstein. The instigator of this whole strategy, John Meriwether, once tried to hire me and is now safely ensconced in a massive estate at Pebble Beach, CA.

The second low came in January of 2018, when the (VIX) traded down to the $9 handle. This time around, short exposure was industrywide. By the time the (VIX) peaked on the morning of February 6, some $8 billion in capital was wiped out.

So here we are back with a (VIX) of $20.48. But I can tell you that there is no way we have a (VIX) $20.48 market.

This is because (VIX) is calculated based on a daily closing basis. It in no way measures intraday volatility, which lately has become extreme.

During 11 out of the last 12 trading days, the S&P 500 intraday range exceeded 2%. This is unprecedented in stock markets anywhere any time.

It has driven traders to despair, driven them to tear their hair out, and prompted consideration of early retirements. The price movements imply we are REALLY trading at a (VIX) of $50 minimum, and possibly as high as $100.

Of course, everyone blames high frequency traders, which go home flat every night, and algorithms. But there is a lot more to it than that.

Heightened volatility is normal in the ninth year of a bear market. Natural buyers diminish, and volume shrinks.

At this point the only new money coming into equities is through corporate share buybacks. That makes us hostage to a new cycle, that of company earnings reports.

Firms are now allowed to buy their own stock in the run up to quarterly earnings reports to avoid becoming afoul of insider trading laws. So, the buyers evaporate a few weeks before each report until a few weeks after.

So far in 2018 this has created a cycle of stock market corrections that exactly correlate with quiet periods. This is when the Volatility Index spikes.

And because the entire short volatility industry no longer exists, the (VIX) soars higher than it would otherwise because there are suddenly no sellers.

So, what happens next when companies start reporting Q1, 2018 earnings? They announce large increases in share buybacks, thanks to last year's tax bill. And a few weeks later stocks take off like a scalded chimp, and the (VIX) collapses once again.

That's why the Mad Hedge Fund Trader Alert Service is short the (VIX) through the IPath S&P 500 VIX Short Term Futures ETN (VXX) April, 2018 $60-$65 in-the-money vertical bear put spread.

Just thought you'd like to know.


https://www.madhedgefundtrader.com/wp-content/uploads/2018/04/John-story-1-image-3-e1523400566228.jpg 291 200 MHFTR https://madhedgefundtrader.com/wp-content/uploads/2019/05/cropped-mad-hedge-logo-transparent-192x192_f9578834168ba24df3eb53916a12c882.png MHFTR2018-04-11 01:07:422018-04-11 01:07:42Trading the New Volatility
MHFTR

It's All About What Happens Next

Diary, Newsletter, Research

Stock markets are only in the business of discounting what happens next. I spend so much time anticipating the coming moves in shares that I can't even remember what I had for breakfast.

This is why technical analysis is such a bust as an investment strategy, except on an intraday basis only, as it is entirely founded on historical data. It is 100% backward looking.

So, I'll take you through the same thought experiments that convinced me to adopt a much more aggressive stance toward the markets after spending two months hiding in the weeds.

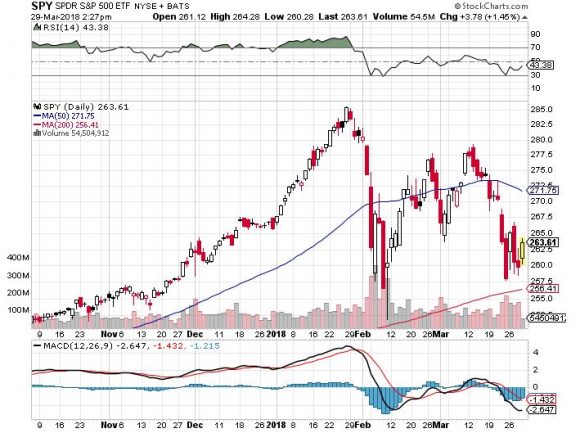
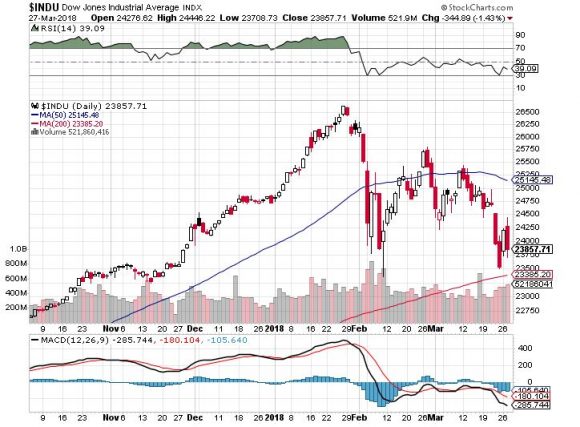
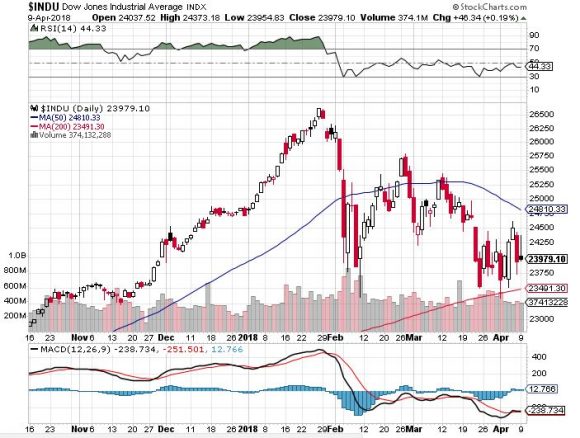
What happens after stocks hit new highs? They hit new lows, as they did on April 1, when the Dow Average plunged to 23,600.

What happens after markets hit new lows? They hit new highs again, supported by the strongest earning reports in history, which begin on Friday, April 13.

What happens after the inflation scare we received in the January Nonfarm Payroll Report with the surprise pop in average hourly earnings?

Inflation non-events, which unfolded with average hourly wages that came in subdued with the February and March Nonfarm Payroll Reports.

What follows a trade war? Trade peace, which is yet to come, but will arrive eventually nevertheless.

All of this points to stock markets that are in the process of putting in the lows for 2018. That means it is time to start ramping up your risk, as I did with three rapid Trade Alerts yesterday.

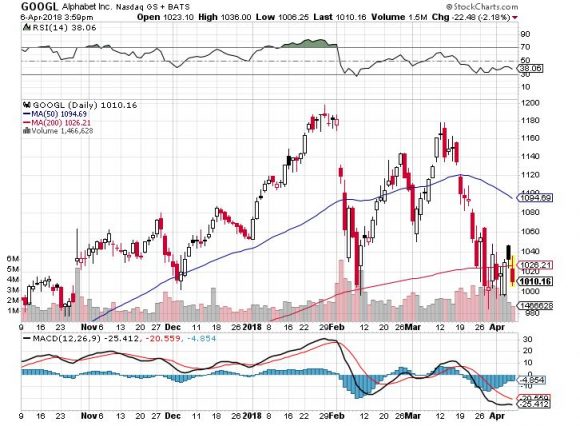
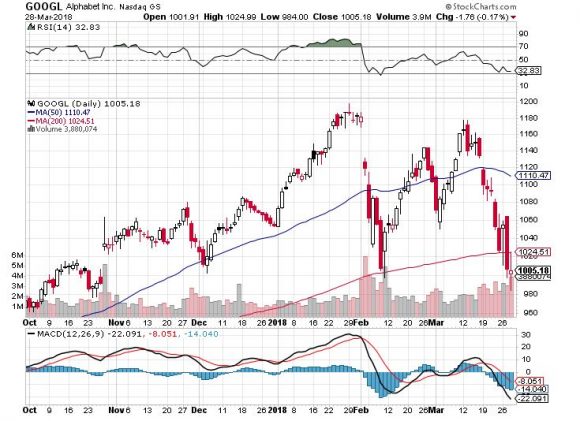
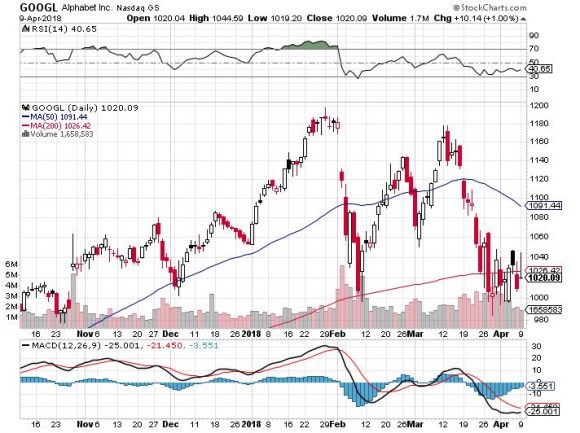
What does this look like on the charts? Alphabet (GOOGL) is a perfect example, which is in the process of putting in a very convincing triple bottom around the $1,000 level, right around the 200-day moving average.

What if I'm wrong?

After all the trade war continues to inflame by the day, the algorithms are still running amok, and the president still has a Twitter account.

What did it today? The Congressional Budget Office forecast of $1 trillion deficits running indefinitely? Or the FBI raids on the offices of the president's personal lawyer?

Then markets will edge down to the next support levels, about 4% lower than the most recently visited bottom, or about 22,600 in the Dow Average.

So, it would seem that the really smart thing to do here is to build options positions that can take that 4% hit, and STILL expire at their maximum profit points.

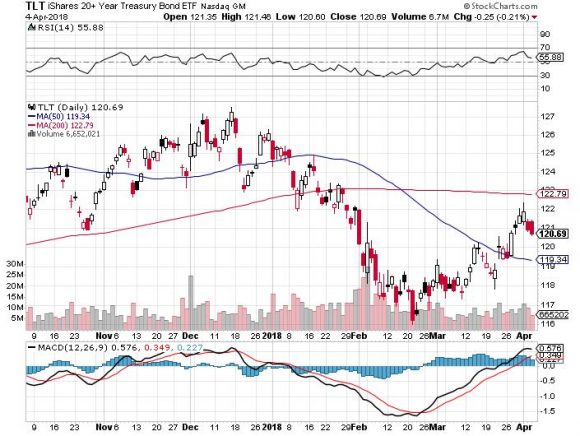
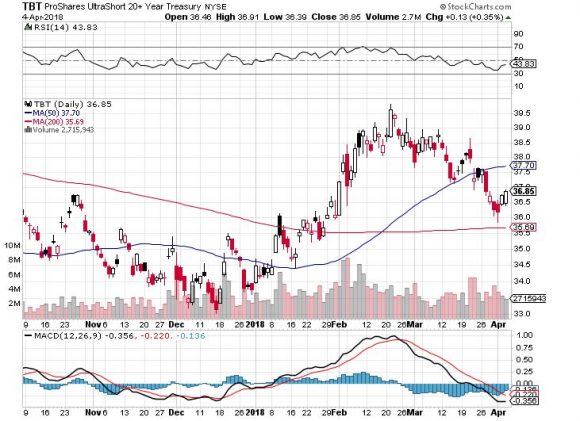
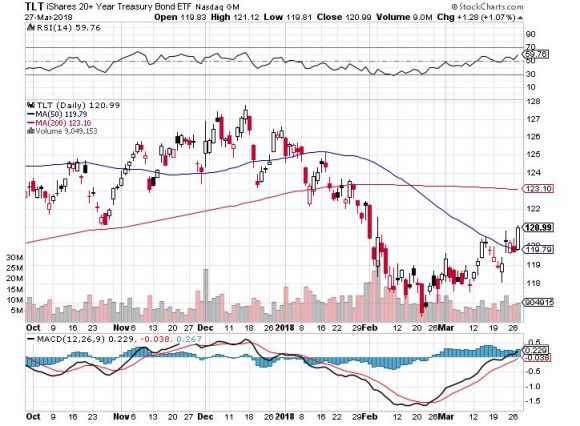
And this is exactly what I have been doing for the past two weeks: piling on long positions in the best technology stocks, and adding to short positions in bonds.

For fans of LEAPS, long dated out-of-the-money option call spreads one year or more out, this is the best time this year to get involved.

I'll give you an example.

BUY one June 21, 2019 $1,000 call at $145.00
SELL one June 21, 2019 $1,050 call at $120.00

NET COST = $25.00

In the event that (GOOGL) closes over $1,050 on June 21, 2019, or up 3% from today's closing level, the profit on this position would amount to $25.00 from an initial cost of $25.00, or a 100% gain in 14 months.

The only catch is that if the recession comes sooner than expected, the value of this position falls to zero in 14 months.

If you go deeper out-of-the-money with your strike prices, the potential profit rises by a multiple.

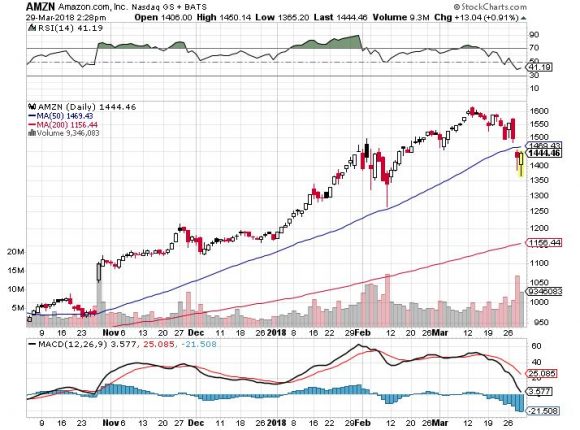
You can generate this kind of astronomical return with any of the FANGs assuming no real movement of the stock in a year.

It looks pretty good to me.

You heard it here first.


Winter Is Ending

https://www.madhedgefundtrader.com/wp-content/uploads/2018/04/John-skiing-store-2-image-3-e1523312994495.jpg 263 350 MHFTR https://madhedgefundtrader.com/wp-content/uploads/2019/05/cropped-mad-hedge-logo-transparent-192x192_f9578834168ba24df3eb53916a12c882.png MHFTR2018-04-10 01:07:502018-04-10 01:07:50It's All About What Happens Next
MHFTR

How America's Plunging Education Surplus Will Damage Your Portfolio

Diary, Newsletter, Research

For the first time in 40 years, the number of foreign students applying for American colleges and universities is declining.

The drop is particularly noticeable at University of California, Berkeley, where Asian students account for about 10% of incoming freshmen. This is turning the Golden State's education budget upside-down, because foreigners pay almost triple the tuition of in-state residents, some $41,942 a year for the 2018-2019 school year.

Trump's China bashing has been widely reported throughout the Middle Kingdom, scaring away prospective applicants.

Who wants to attend school in a country at war with the homeland - trade or the shooting kind?

So has the upturn in attacks in the US on minorities, be they religious, ethnic, national, or otherwise.

Trump certainly made that attitude crystal with his attempted immigration bans, now blocked by the courts.

Students are worried they will be physically attacked, or deported by an aggressive immigration department. That is if they can even get into the country in the first place.

It isn't just California schools that are getting hit. Institutions of higher learning across the nation are reporting similar drawdowns.

Foreign students are instead applying to British and European schools, or not going abroad at all to save money.

If this sorry trend continues, it will cause substantial damage to the American education system, the US economy as a whole, US influence abroad, and the US dollar (UUP).

Higher education has grown into a gigantic service industry for America, with a massively positive impact on our balance of payments, generating an impact on the world far beyond the dollar amounts involved.

According to the nonprofit Institute of International Education, there are 819,644 foreign students in the US today.

This combined student body pays an average out-of-state tuition of $25,000 a year each totaling some $24 billion. The positive impact on the US balance of payments and the US dollar exchange rate is huge.

China is far and away the dominant origin of these students, accounting for 235,597.

South Korea and India take the No. 2 and No. 3 slots, thanks to the generous scholarships provided by their home governments. Saudi Arabia and Brazil are showing the fastest growth rates.

A fortunate few, backed by endowed chairs and buildings financed by wealthy and eager parents, land places at prestigious universities such as Harvard, Princeton, and Yale.

The top destinations of foreign students are the University of Southern California in Los Angeles, CA, the University of Illinois at Urbana-Champaign, Indiana's Perdue University, and New York University, with each of these claiming 9,000 foreign students.

However, the overwhelming majority enroll in the provinces in a thousand rural state universities and junior colleges of which most of us have never heard.

Many of these schools now have diligent admissions officers scouring the Chinese hinterlands looking for new applicants.

A college degree once was a uniquely American privilege. In 1974 the US led the world, with 24% of the population getting a sheepskin.

Today, it has fallen to 16th, with 28% completing a four-year program, lagging countries such as South Korea, Canada, and Japan.

The financial windfall has enabled once sleepy little schools to build themselves into world-class institutions of higher learning, with 30,000 or more students.

They boast state-of-the-art facilities, much to the joy of local residents and budget-constrained state education officials.

Furthermore, the overwhelming leadership of education industry is steadily Americanizing the global establishment.

I can't tell you how many times over the decades I have run into the Persian Gulf sovereign fund manager who went to Florida State, the Asian CEO who attended Cal State Hayward, or the African finance minister who fondly recalled rooting for the Kansas State Wildcats.

Remember the recently ousted president of Egypt, Mohamed Morsi? He was a former classmate of mine at the University of Southern California. Go Trojans! Do you think he was singing "Fight on For Old SC" in his jail cell?

Those who constantly bemoan the impending fall of the Great American Empire can take heart by merely looking inland at these impressive degree factories. These students are not clamoring to get into universities in Beijing, Moscow, or Tokyo.

Not a few marry and permanently settle in the US, while many others take their American brides home. Saudi Arabia is home to some 50,000 such wives, who had to agree to sharia law and give up driving to obtain resident permits.

It also explains why the dollar is so strong in the face of absolutely gigantic, structural trade deficits.

When a foreign student pays tuition to a US school, it is treated as an export of a service in terms of the US balance of payments, much like a car or an airplane, our country's largest exports.

Rising exports mean that more dollars are staying home and fewer are going abroad, strengthening the value of the greenback.

And $24 billion and change offsets a lot of imports of cheap electronics, clothing, and toys from China.

The US has plenty of capacity to expand this trade in services. More than 70% of foreign students are concentrated in just 200 of the country's 4,000 colleges.

The University of California has blazed a path that many other cash-strapped institutions are certain to follow. During the financial crisis, the world's greatest public university saw two back-to-back 40% budget cuts from Sacramento.

So, it made up the shortfall by bumping up foreign admissions from 5% to 10%, largely from Asia. They must pay $38,000 a year in tuition, compared to $18,000 for in-state residents.

What is the upshot of all of this for the locals? It is now a lot harder to get an "A" in Math at UC Berkeley.


https://www.madhedgefundtrader.com/wp-content/uploads/2018/04/Graduating-picture-story-3-e1523312478250.jpg 200 300 MHFTR https://madhedgefundtrader.com/wp-content/uploads/2019/05/cropped-mad-hedge-logo-transparent-192x192_f9578834168ba24df3eb53916a12c882.png MHFTR2018-04-10 01:06:452018-04-10 01:06:45How America's Plunging Education Surplus Will Damage Your Portfolio
Page 28 of 43«‹2627282930›»

tastytrade, Inc. (“tastytrade”) has entered into a Marketing Agreement with Mad Hedge Fund Trader (“Marketing Agent”) whereby tastytrade pays compensation to Marketing Agent to recommend tastytrade’s brokerage services. The existence of this Marketing Agreement should not be deemed as an endorsement or recommendation of Marketing Agent by tastytrade and/or any of its affiliated companies. Neither tastytrade nor any of its affiliated companies is responsible for the privacy practices of Marketing Agent or this website. tastytrade does not warrant the accuracy or content of the products or services offered by Marketing Agent or this website. Marketing Agent is independent and is not an affiliate of tastytrade. 

Legal Disclaimer

There is a very high degree of risk involved in trading. Past results are not indicative of future returns. MadHedgeFundTrader.com and all individuals affiliated with this site assume no responsibilities for your trading and investment results. The indicators, strategies, columns, articles and all other features are for educational purposes only and should not be construed as investment advice. Information for futures trading observations are obtained from sources believed to be reliable, but we do not warrant its completeness or accuracy, or warrant any results from the use of the information. Your use of the trading observations is entirely at your own risk and it is your sole responsibility to evaluate the accuracy, completeness and usefulness of the information. You must assess the risk of any trade with your broker and make your own independent decisions regarding any securities mentioned herein. Affiliates of MadHedgeFundTrader.com may have a position or effect transactions in the securities described herein (or options thereon) and/or otherwise employ trading strategies that may be consistent or inconsistent with the provided strategies.

Copyright © 2025. Mad Hedge Fund Trader. All Rights Reserved. support@madhedgefundtrader.com
  • Privacy Policy
  • Disclaimer
  • FAQ
Scroll to top