Boy, did we have a great run in emerging markets during the 2000s!
A global commodity boom caused many of these markets to rise tenfold or more.
Go back to the earliest newsletters published by the Diary of a Mad Hedge Fund Trader in 2008, and you will find them chock full of recommendations to buy hard assets, emerging market ETFs, debt, and currencies.
As former colonies, many of these countries still base their economies on production of the precious and base metals, energy, and foodstuffs they once supplied the motherland.
And as a former correspondent for The Economist magazine covering this territory, I knew them well.
Then in 2011, the party abruptly ended, and a vicious five-year bear market ensued.
Oil peaked first, eventually nosediving some 82.5%, from $149 to $26.
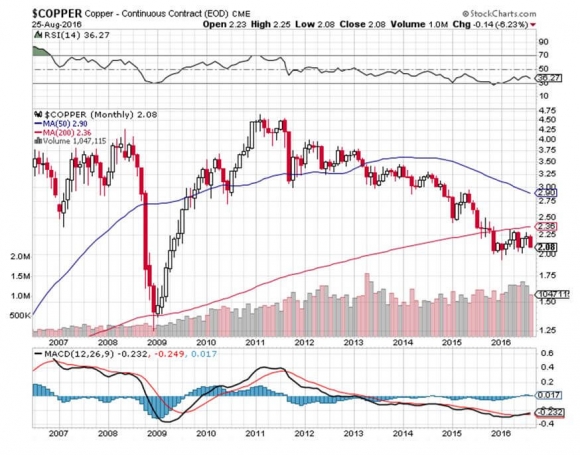
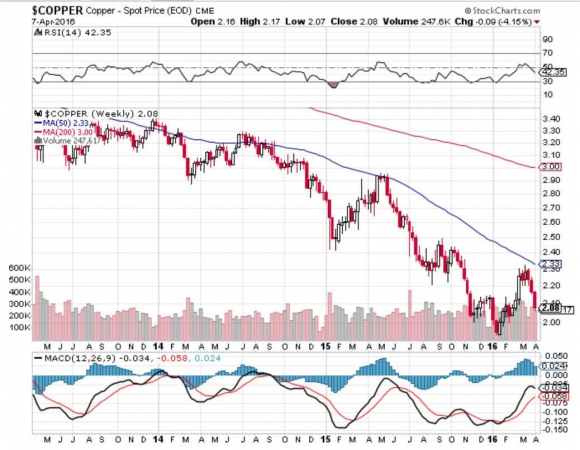
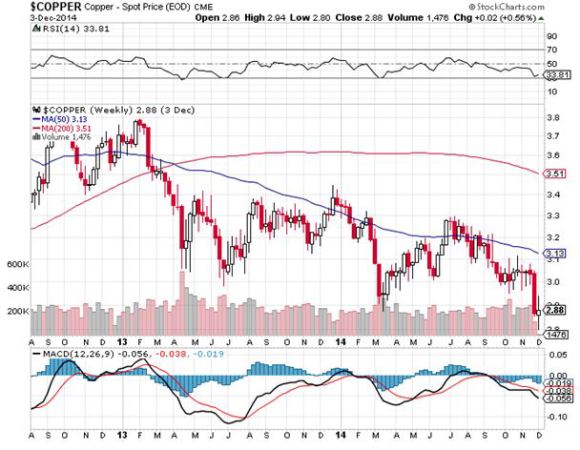
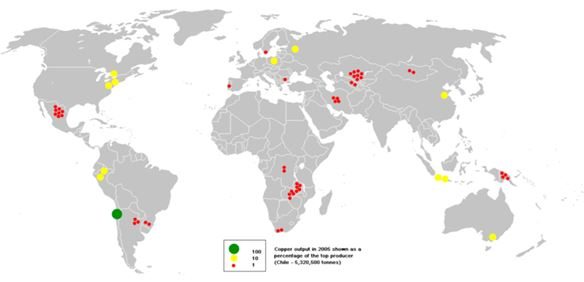
Remember Dr. Copper, the only commodity with a PhD in economics? He gave up 57.9%.
And gold, that ultimate store of value for Armageddonists and conspiracy theorists everywhere? It plunged by 48.2%.
There are still a lot of unhappy American gold eagles sitting in bank deposit boxes around the country gathering dust, thanks to those ridiculous theories.
It didn?t help that a raging bull market in developed market government bonds sucked even more money out of these beleaguered countries.
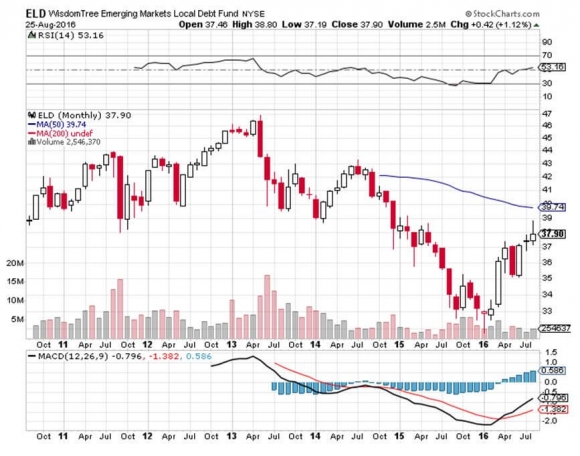
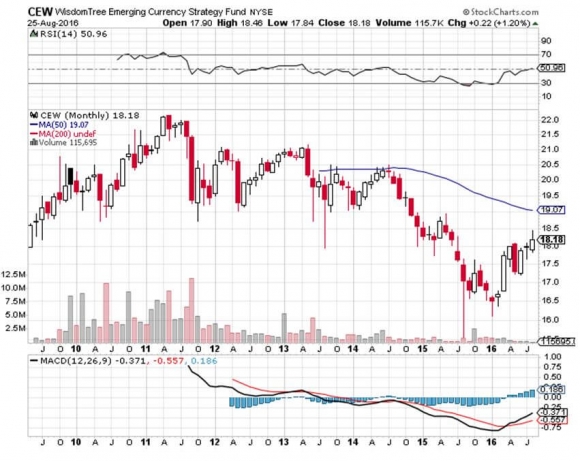
The Emerging market debt ETF (ELD), collapsed by 32%. The emerging market currency ETF (CEW) dropped by 35.5%.
My long-term subscribers can already see where this is going.
The wonderful thing about all of these cross asset class declines is that they have a leveraged effect on each other.
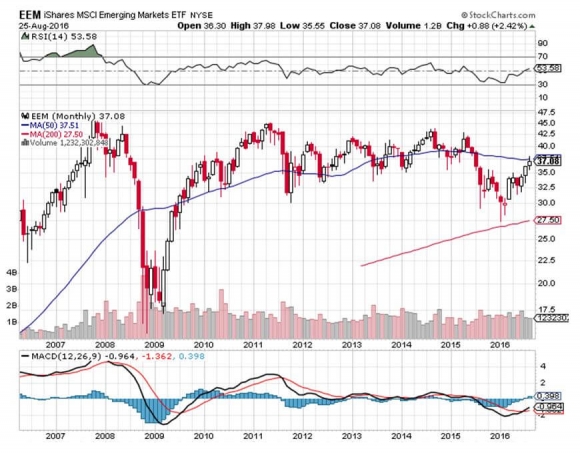
So while the ishares MSCI Emerging Market ETF (EEM) fell by 38.9%, in dollar terms it declined by more than half.
Then a funny thing happened during the second week of January 2016.
Gold took off like a rocket.
It was closely followed by silver, oil copper, palladium, platinum, and iron ore. Only the ags failed to participate.
The bull market was back!
Portfolio managers were given a simple choice.
Should they chase developed market assets trading at all time highs with yields approaching zero. Or should they load up on emerging assets at decade lows with yields approaching 12%?
Yields that high can cover up a lot of mistakes and preserve principal.
If you voted for the latter, you deserve a brass ring.
Here we are some eight months later, and the emerging bull market is alive and well. In fact, it is about to take another substantial new leg upwards.
My money is on emerging market handily beating the major US stock indexes for the rest of 2016.
The reasons for this are many and complex.
For a start, the iShares MSCI Emerging Market ETF (EEM) is still cheap.
It has to rise by 21.6% just to get back up to its 2011 highs. As a laggard play, it is beyond reproach.
In emerging market debt, the positive carry is enormous.
The Wisdom Tree Emerging Market Local Debt Fund (ELD) is yielding 5.46%, some 390 basis points high than the ten year Treasury bond (TLT).
And if you want to go with individual rifle shots in single countries, you can earn as much as 11.90% in Brazil.
The ?lower for longer? philosophy of the Fed just shines a giant great spotlight on this paper.
And guess what happened while you weren?t looking?
Emerging market debt has ?emerged.?
Five years of balance sheet repair means their credit quality has improved.
Local credit markets have grown up too.
Once dominated by huge inflows and outflows from foreign investors, markets are now much more in balance, thanks to the rise of? local institutional investors and pension funds.
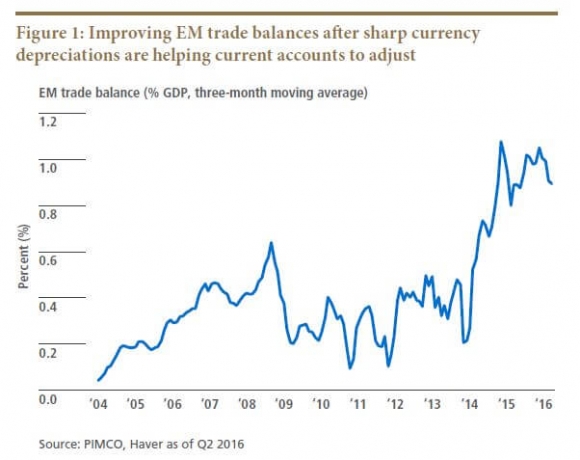
The fundamentals of these countries have been steadily improving.
Falling currencies gave them a competitive advantage that allowed? trade surpluses to dramatically improve.
Political stability is improving. During my journalist days, you used to be able to count on one good coup d??tat or revolution in the area a year. No more.
Many business friendly, pro trade governments have come into power, such as in Argentina, India and Peru.
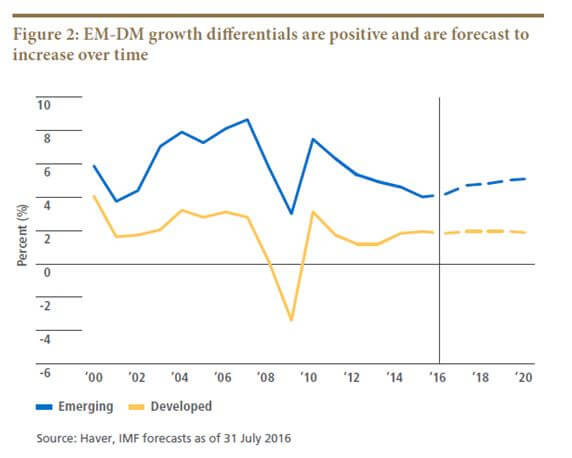
Emerging market GDP growth rates are still double those found in developed markets.
Markets themselves are improving. Spreads for stocks and bonds are now much tighter in emerging markets and liquidity has improved. They are ?roach motel? markets no more, where you can check in, but you can?t check out.
Get this one right, and the cross asset class hockey stick effect we saw on the downside will work just as well on the upside.
In short, there is a lot more to the emerging market dollar than there used to be. It is just a matter of time before financial markets figure this out.