I will start today’s letter by listing six more data points showing how overbought stocks have become.
1) While the number of outstanding shares in the US has remained unchanged since 2006, thanks to M&A, buybacks, bankruptcies, and privatizations, the average weighted share price has more than doubled from $50.15 to $137.00.
2) The Volatility Index (VIX) has just jumped from a recent high of $29 to $21 today.
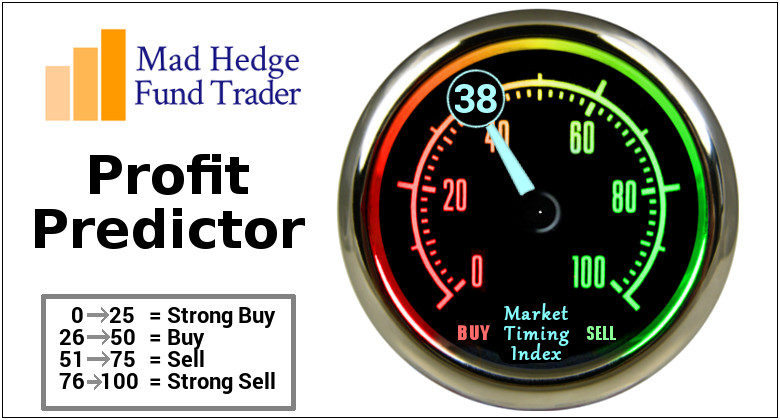
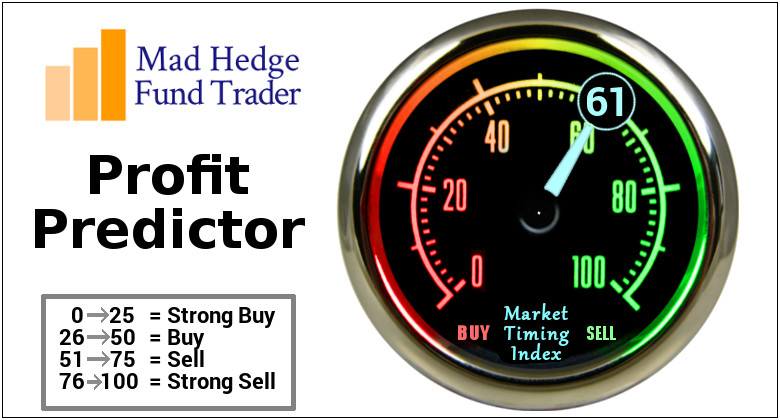
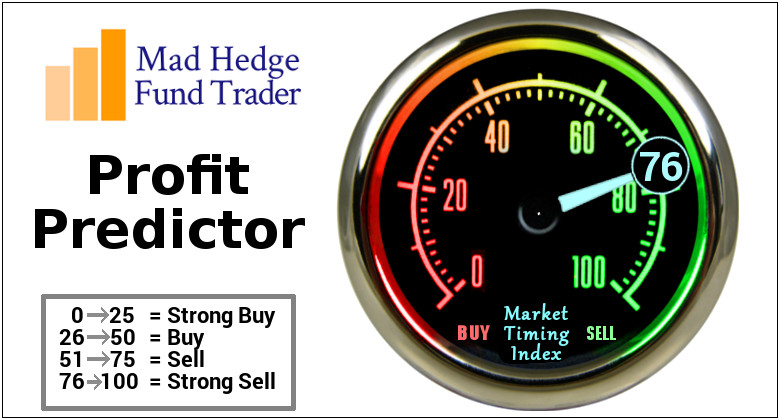
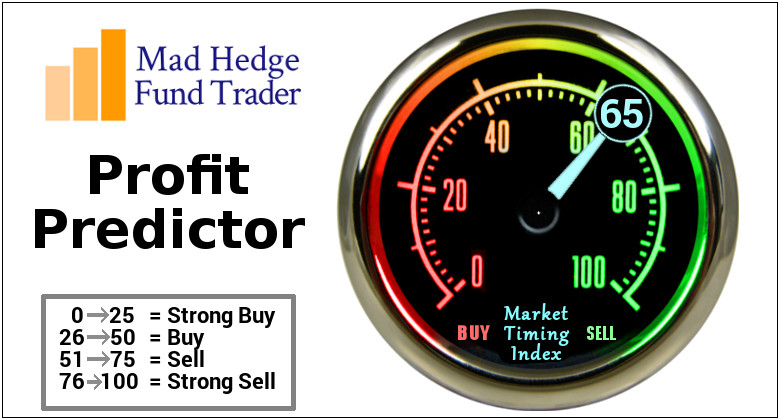
3) The Mad Hedge Market Timing Index has just soared from a recent low of 19 eight months ago to 30 today, still in “BUY” territory.
4) 2022 forward stock earnings growth maintains at 20%.
5) Almost every investor is bullish once more, now that their stocks are going up.
6) The stock market has had its best 18 months in history. Grizzled, long in the tooth readers can’t be more cautious right now.
This all leads to the urgent question of the day, WHICH stocks do you buy as we approach market tops? The answer is very simple. You buy cheap ones. And what are the cheapest stocks out there?
Commodity stocks.
My friend, Jim Umpleby, said that we are just entering a ten-year super cycle in commodities.
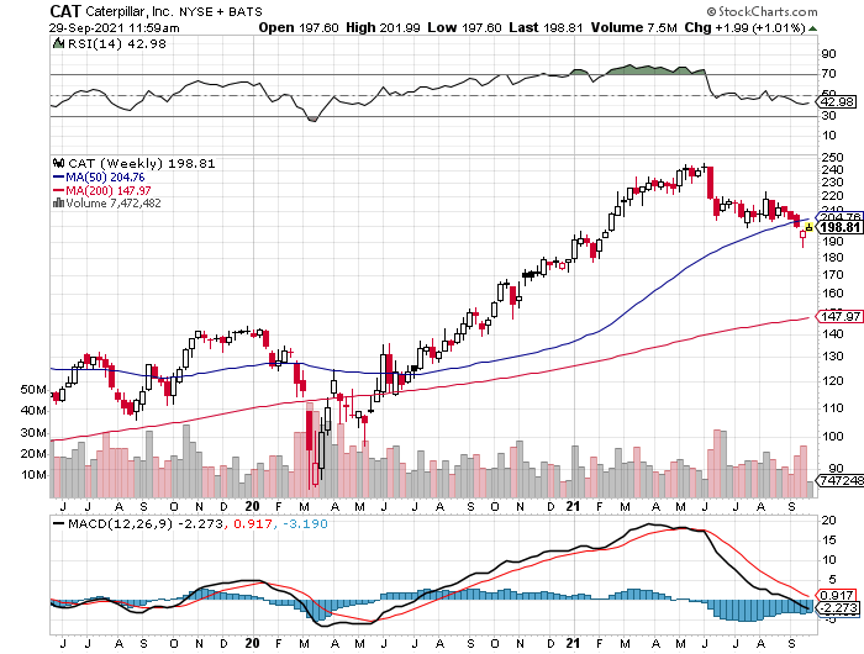
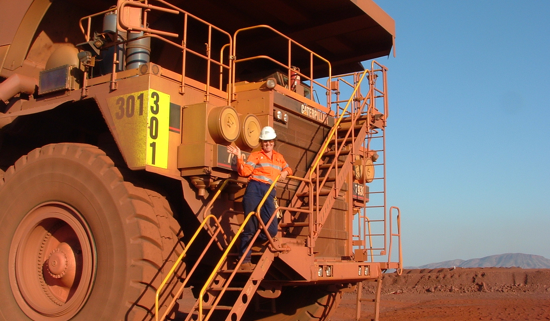
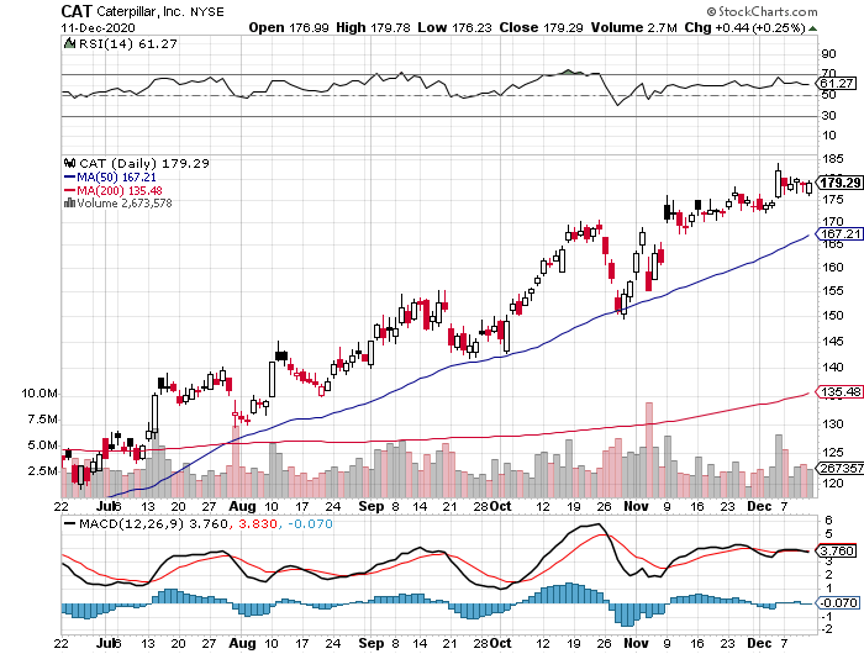
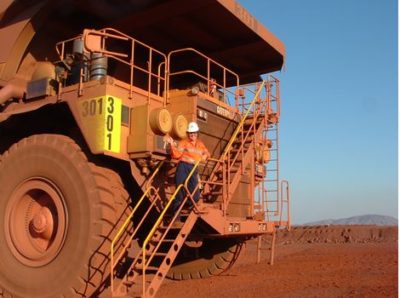
Jim should know. He is the CEO of Caterpillar (CAT), a company I have been following for 45 years. I even have one of their cool worn yellow baseball caps from years past.
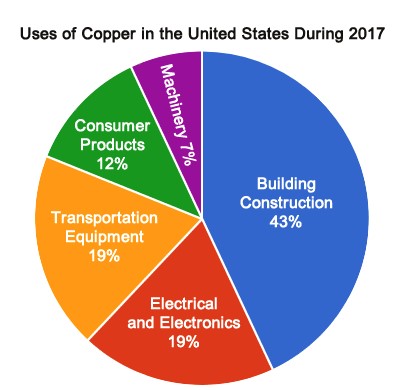
Thanks to the 2017 tax bill, companies can now buy Caterpillar’s bulldozers, backhoes, and heavy trucks, and expense 100% of the investment in the first year. (Last year, I bought a new $162,500 Tesla Model X using the same break). That makes a purchase of (CAT)’s products one of the best tax breaks ever.
Needless to say, this has created a stampede to buy the companies heavy machinery because they fear this tax windfall will be reversed by the next administration. This is equipment with a 30-year life or longer.
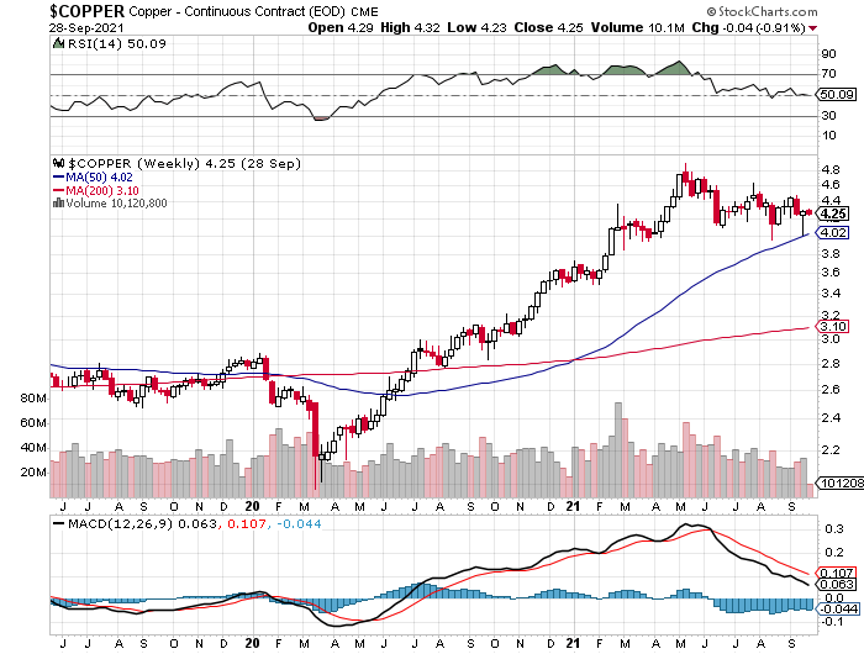
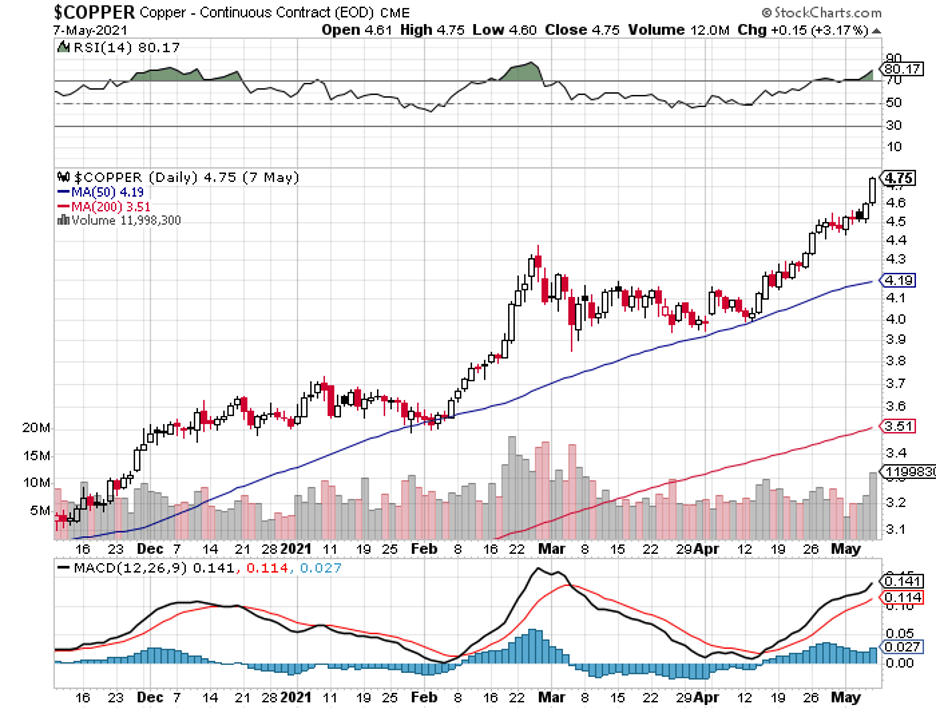
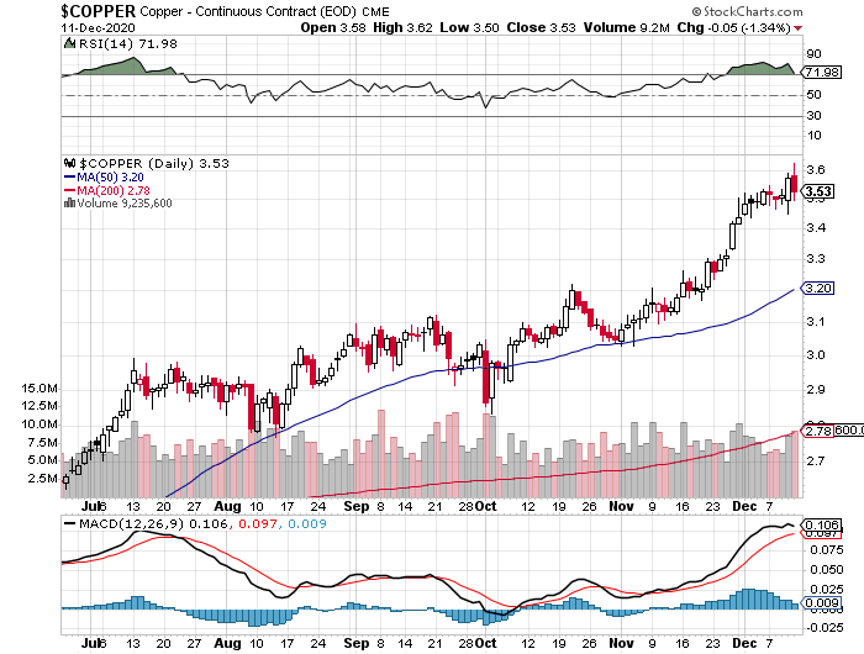
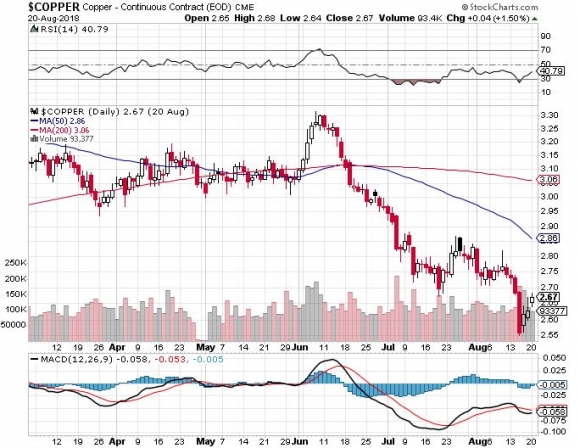
Industrial commodities are in fact the perfect sector to buy right now. Take a look at the long-term chart for copper prices, which are a great bellwether for the entire industry. They are imminently poised to make a long-term upside breakout.
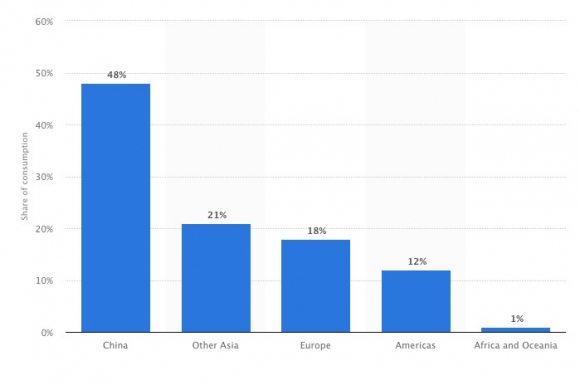
Copper last peaked at the beginning of 2011, when the Chinese infrastructure build-out suddenly outdrew to a juddering halt. Prices cratered from $4.60 a pound to a lowly $1.90. Mines were sold off, mothballed, or permanently closed at a record rate.
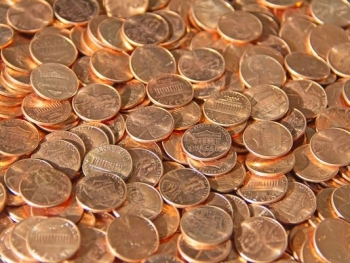
Copper prices fell so low that the US Mint finally started making a profit on pennies they struck.
Then a funny thing happened.
Copper will soon bottom, assisted by the global synchronized economic recovery I have been writing about for years. The recent collapse of the Chinese real estate market prompted by the China Evergrande Group will eventually give us a great entry point.
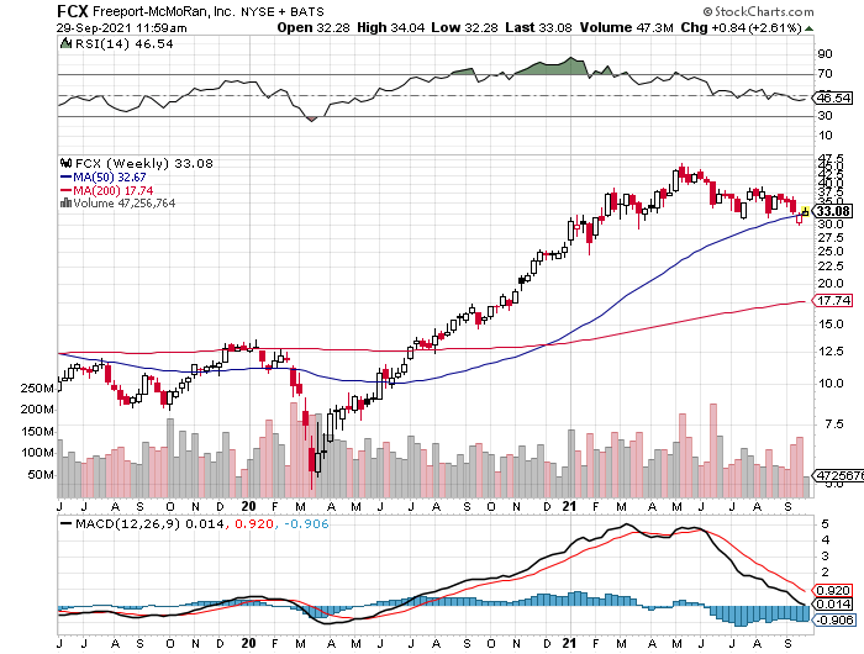
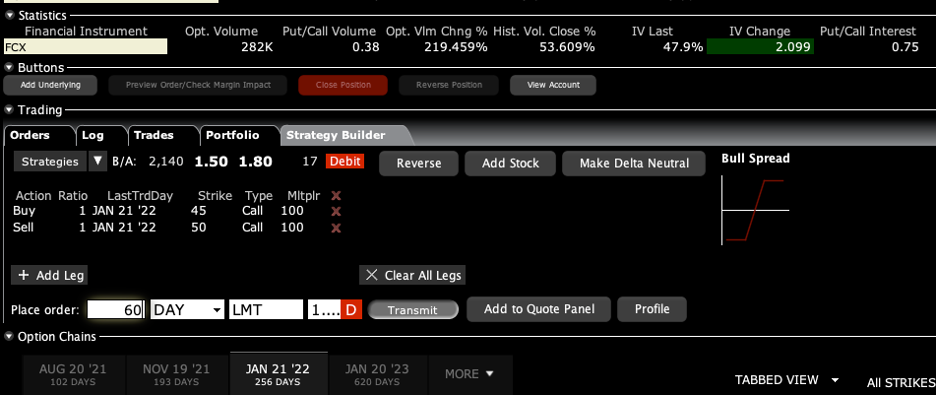
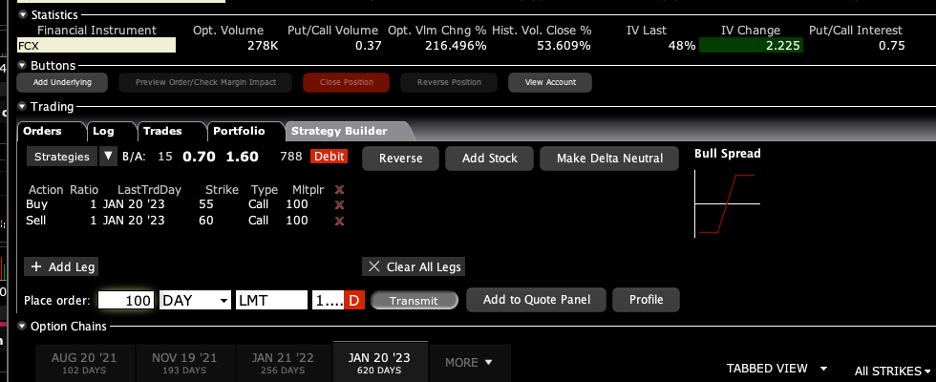
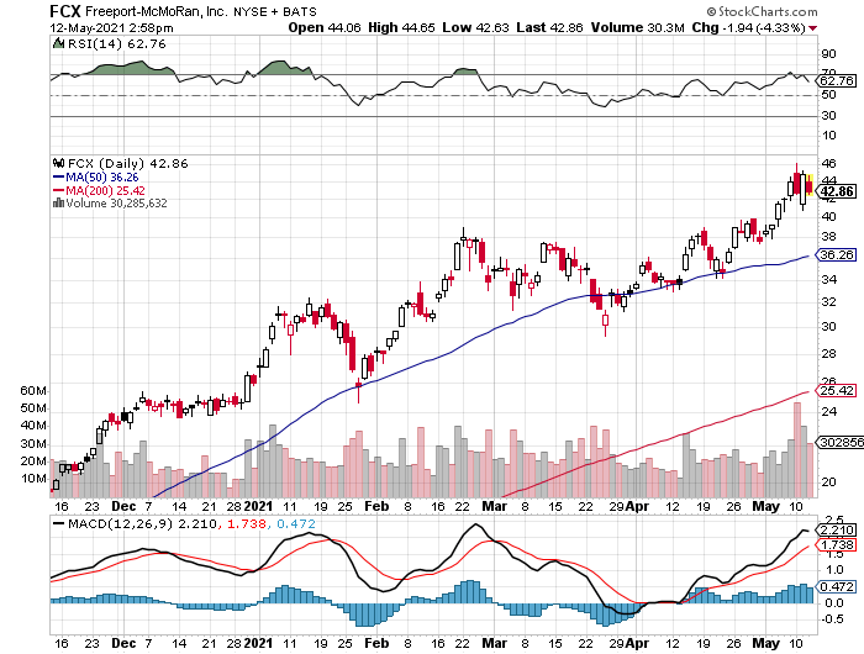
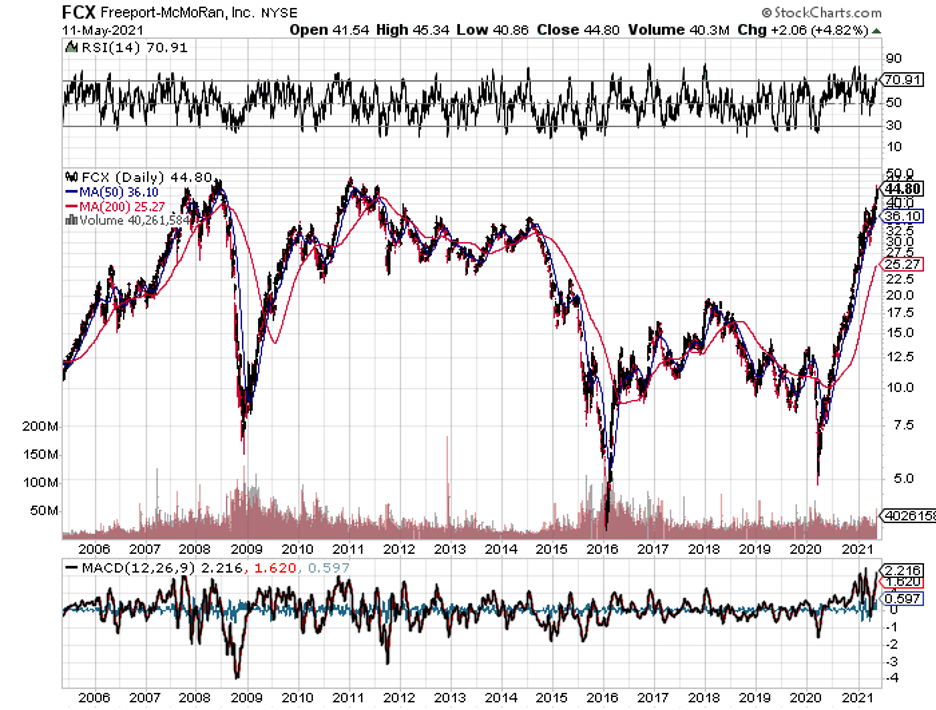
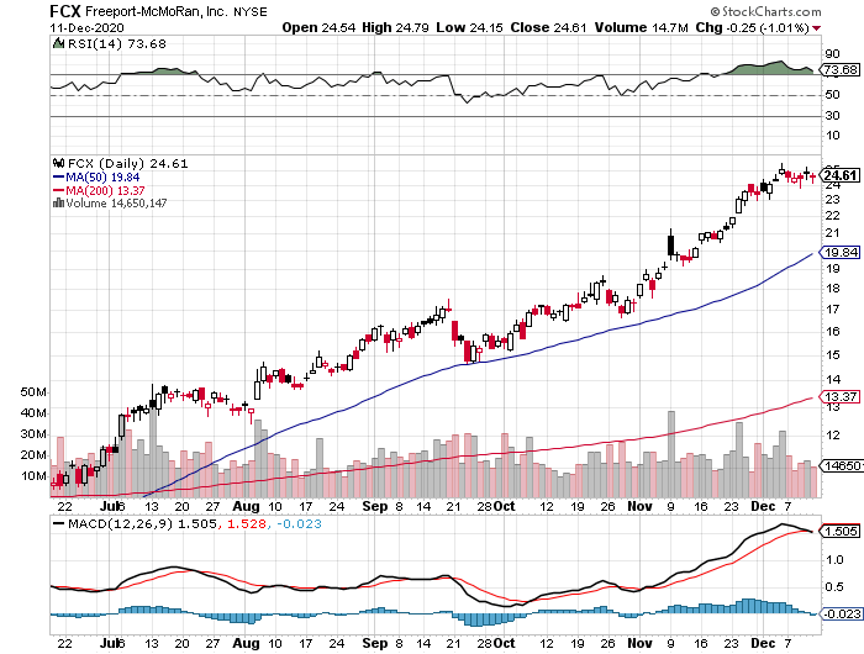
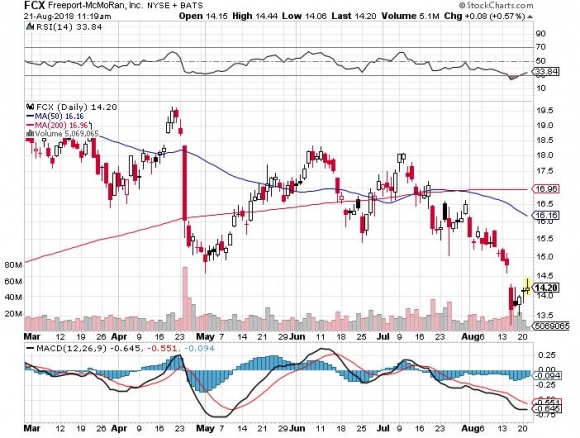
The share prices of copper and other major commodity producers will go ballistic. Freeport McMoRan (FCX), the world’s largest copper producer, (whose management is a long-time reader of this letter) has just seen its stock jump ten-fold from a near $4.00 a share to $46.00. It is now back at $33.00.
You may think that it’s too late to get into the commodities space, but you’d be wrong. Having covered the sector for nearly a half-century there is one thing you learn quickly. While you can shut down a mine in weeks, it can take years to bring them back on line.
As for developing a new mine from scratch, that can take a decade by the time you get design, permits, infrastructure, equipment, and labor in place.
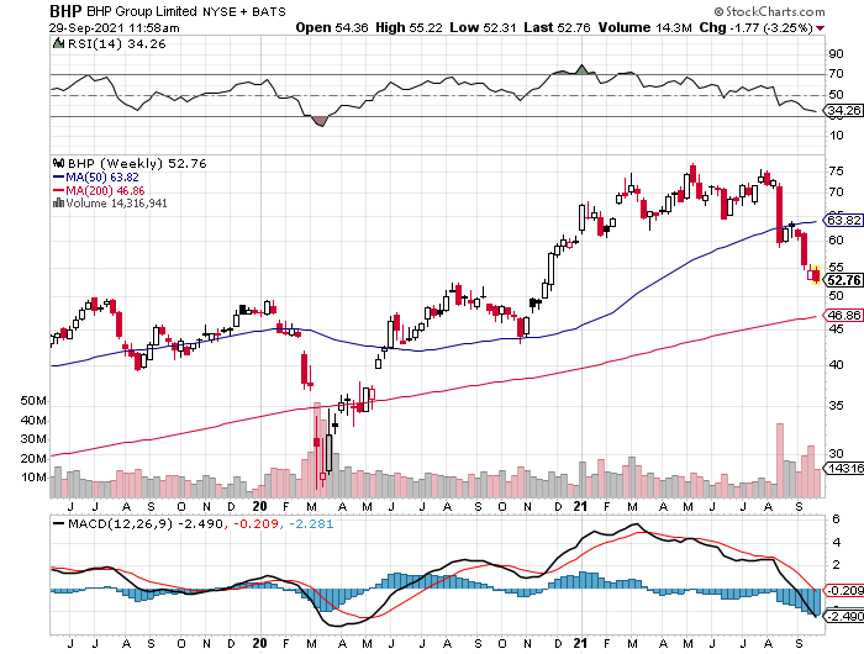
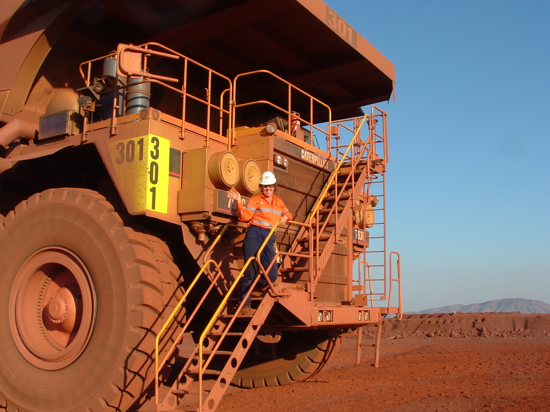
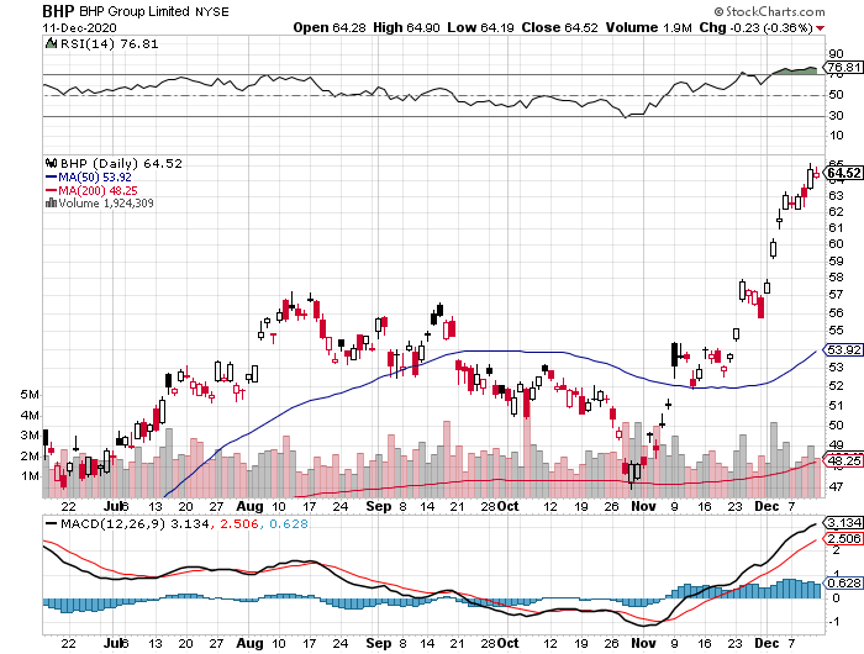
My Australian readers tell me that (BHP) is flying young skilled workers from Brisbane an incredible 2,000 miles to work in Northwest mines in a six weeks on - six weeks off work schedule and paying them $200,000 a year to do it. And they’re making a profit doing this!
The bottom line here is that a short squeeze has developed for industrial commodities which will last for years.
Oh, and that global economic recovery? It is on vacation until delta ends. That could happen in a few months, and no more than a year.
At least you have something to buy now besides more technology stocks. As much as we here at the Mad Hedge Fund Trader all love them for the long term, they are extremely overbought for the short term.
Tech always comes back.