I am once again writing this report from a first-class sleeping cabin on Amtrak’s legendary California Zephyr.
By day, I have two comfortable seats facing each other next to a panoramic window. At night, they fold into two bunk beds, a single and a double. There is a shower, but only Houdini could get to navigate it.
I am not Houdini, so I go downstairs to use the larger public hot showers. They are divine.
We are now pulling away from Chicago’s Union Station, leaving its hurried commuters, buskers, panhandlers, and majestic great halls behind. I love this building as a monument to American exceptionalism.
I am headed for Emeryville, California, just across the bay from San Francisco, some 2,121.6 miles away. That gives me only 56 hours to complete this report.
I tip my porter, Raymond, $100 in advance to make sure everything goes well during the long adventure and to keep me up to date with the onboard gossip. The rolling and pitching of the car is causing my fingers to dance all over the keyboard. Microsoft’s Spellchecker can catch most of the mistakes, but not all of them.
As both broadband and cell phone coverage are unavailable along most of the route, I have to rely on frenzied Internet searches during stops at major stations along the way to Google search obscure data points and download the latest charts.
You know those cool maps in the Verizon stores that show the vast coverage of their cell phone networks? They are complete BS.
Who knew that 95% of America is off the grid? That explains so much about our country today.
I have posted many of my better photos from the trip below, although there is only so much you can do from a moving train and an iPhone 10x.
After making the rounds with strategists, portfolio managers, and hedge fund traders in the run-up to this trip, I can confirm that 2018 was one of the most brutal to trade for careers lasting 30, 40, or 50 years. This was the year that EVERYTHING went down, the first time that has happened since 1972. Comparisons with 1929, 1987, and 2008 were frequently made.
While my own 23.56% return for last year is the most modest in a decade, it beats the pants off of the Dow Average plunge of 8% and 99.9% of the other managers out there. That is a mere shadow of the spectacular 57.91% profit I took in during 2017. This keeps my ten-year average annualized return at 34.20%.
Our entire fourth-quarter loss came from a single trade, a far too early bet that the Volatility Index would fall from the high of the year at $30.
For a decade, all you had to do was throw a dart at the stock page of the Wall Street Journal and you made money, as long as it didn’t end on retail. No more.
For the first time in years, the passive index funds lost out to the better active managers. The Golden Age of the active manager is over. Most hedge funds did horribly, leveraged long technology stocks and oil and short bonds. None of it worked.
If you think I spend too much time absorbing conspiracy theories from the Internet, let me give you a list of the challenges I see financial markets facing in the coming year:
The Nine Key Variables for 2019
1) Will the Fed raise rates one, two, or three times, or not at all?
2) Will there be a recession this year or will we have to wait for 2020?
3) Is the tax bill fully priced into the economy or is there more stimulus to come?
4) Will the Middle East drag us into a new war?
5) Will technology stocks regain market leadership or will it be replaced by other sectors?
6) Will gold and other commodities finally make a long-awaited comeback?
7) Will rising interest rates (positive) or deficits (negative) drive the US dollar this year?
8) Will oil prices recover in 2019?
9) Will bitcoin ever recover?
Here are your answers to the above: 1) Two, 2) 2020, 3) Yes, 4) No, 5) Both, 6) Yes, 7) Yes, 8) Yes, 9) No.
There you go! That’s all the research you have to do for the coming year. Everything else is a piece of cake. You can go back to your vacation.
The Twelve Highlights of 2018
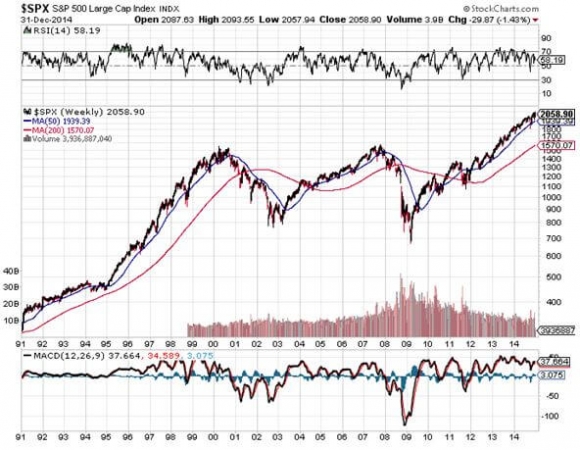
1) Stocks will finish lower in 2019. However, we aren’t going to collapse from here. We will take one more rush at the all-time highs that will take us up 10% to 15% from current levels, and then fail. That will set up the perfect “head and shoulders” top on the long-term charts that will finally bring to an end this ten-year bull market. This is when you want to sell everything. The May 10, 2019 end to the bull market forecast I made a year ago is looking pretty good.
I think there is a lot to learn from the 1987 example when stocks crashed 20% in a single day, and 42% from their 1987 high, and then rallied for 28 more months until the next S&L crisis-induced recession in 1991.
Investors have just been put through a meat grinder. From here on, its all about trying to get out at a better price, except for the longest-term investors.
2) Stocks will rally from here because they are STILL receiving the greatest amount of stimulus in history. Energy prices have dropped by half, taxes are low, inflation is non-existent, and interest rates are still well below long term averages.
Corporate earnings will grow at a 6% rate, not the 26% we saw in 2018. But growing they are. At current prices, the stock market is assuming that companies will generate big losses in 2019, which they won’t. Just try to find a parking space at a shopping mall anywhere and you’ll see what I mean.
3) Technology stocks will lead any recovery. Love them or hate them, big tech accounts for 25% of stock market capitalization but 50% of US profits. That is where the money is. However, in 2019 they will be joined by biotech and health care companies as market leaders.
4) The next big rally in the market will be triggered by the end of the trade war with China. Don’t expect the US to get much out of the deal. It turns out that the Chinese can handle a 20% plunge in the stock market much better than we can.
5) The Treasury bond market will finally get the next leg down in its new 10-year bear market, but don’t expect Armageddon. The ten-year Treasury yield should hit at least 3.50%, and possibly 4.0%.
6) With slowing, US interest rate rises, the US dollar will have the wind knocked out of it. It’s already begun. The Euro and the Japanese yen will both gain about 10% against the greenback.
7) Political instability is a new unknown factor in making market predictions which most of us have not had to deal with since the Watergate crisis in 1974. It’s hard to imagine the upcoming Mueller Report not generating a large market impact, and presidential tweets are already giving us Dow 1,000-point range days. These are all out of the blue and totally unpredictable.
8) Oil at $42.50 a barrel has also fully discounted a full-on recession. So, if the economic slowdown doesn’t show, we can make it back up to $64 quickly, a 50% gain.
9) Gold continues its slow-motion bull market, gaining another 10% since the August low. It barely delivered in 2018 as a bear market hedge. But once inflation starts to pick up a head of steam, so should the price of the barbarous relic.
10) Commodities had a horrific year, pulled under by the trade war, rising rates, and strong dollar. Reverse all that and they should do better.
11) Residential real estate has been in a bear market since March. You’ll find out for sure if you try to sell your home. Rising interest rates and a slowing economy are not what housing bull markets are made of. However, prices will drop only slightly, like 10%, as there is still a structural shortage of housing in the US.
12) The new tax bill came and went with barely an impact on the economy. At best we got two-quarters of above-average growth and slightly higher capital spending before it returned to a 2%-2.5% mean. Unfortunately, it will cost us $4 trillion in new government debt to achieve this. It was probably the worst value for money spent in American history.
Dow Average 1987-90
The Thumbnail Portfolio
Equities - Go Long. The tenth year of the bull market takes the S&P 500 up 13% from $2,500 to $2,800 during the first half, and then down by more than that in the second half. This sets up the perfect “head and shoulders” top to the entire decade-long move that I have been talking about since the summer.
Technology, Pharmaceuticals, Healthcare, and Biotech will lead on the up moves and now is a great entry point for all of these. Buy low, sell high. Everyone talks about it but few ever actually execute like this.
Bonds - Sell Short. Down for the entire year big time. Sell short every five-point rally in the ten-year Treasury bond. Did I mention that bonds have just had a ten-point rally? That’s why I am doubled up on the short side.
Foreign Currencies - Buy. The US dollar has just ended its five-year bull trend. Any pause in the Fed’s rate rising schedule will send the buck on a swan dive, and it’s looking like we may be about to get a six-month break.
Commodities - Go Long. Global synchronized recovery continues the new bull market.
Precious Metals - Buy. Emerging market central bank demand, accelerating inflation, and a pause in interest rate rises will keep the yellow slowly rising.
Real Estate – Stand Aside. Prices are falling but not enough to make it worth selling your home and buying one back later. A multi-decade demographic tailwind is just starting, and it is just a matter of time before prices come roaring back.
1) The Economy-Slowing
A major $1.5 trillion fiscal stimulus was a terrible idea in the ninth year of an economic recovery with employment at a decade high. Nevertheless, that’s what we got.
The certainty going forward is that the gains provided by lower taxes will be entirely offset by higher interest rates, higher labor costs, and rising commodity and oil prices.
Since most of the benefits accrued to the top 1% of income earners, the proceeds of these breaks entirely ended up share buybacks and the bond market. This is why interest rates are still so incredibly low, even though the Fed has been tightening for 4 ½ years (remember the 2014 taper tantrum?) and raising rates for three years.
And every corporate management views these cuts as temporary so don’t expect any major capital investment or hiring binges based on them.
The trade wars have shifted the global economy from a synchronized recovery to a US only recovery, to a globally-showing one. It turns out that damaging the economies of your biggest economies is bad for your own business. They are also a major weight on US growth. CEOs would rather wait to see how things play out before making ANY long-term decisions.
As a result, I expect real US economic growth will retreat from the 3.0% level of 2018 to a much more modest 1.5%-2.0% range in 2019.
The government shutdown, now in its third week (and second year), will also start to impact 2019 growth estimates. For every two weeks of closure, you can subtract 0.1% in annual growth.
Twenty weeks would cut a full 1%. And if you only have 2% growth to start with that means you don’t have much to throw away until you end up in a full-on recession.
Hyper-accelerating and cross-fertilizing technology will remain a long term and underestimated positive. But you have to live here next to Silicon Valley to realize that.
S&P 500 earnings will grow from the current $170 to $180 at a price earnings multiple at the current 14X, a gain of 6%. Unfortunately, these will start to fade in the second half from the weight of rising interest rates, inflation, and political certainty. Loss of confidence will be a big influence in valuing shares in 2019.
Whatever happened to the $2.5 trillion in offshore funds held by American companies expected to be repatriated back to the US? That was supposed to be a huge market stimulus last year. It’s still sitting out there. It turns out companies still won’t bring the money home even with a lowly 10% tax rate. They’d rather keep it abroad to finance growth there or borrow against it in the US.
Here is the one big impact of the tax bill that everyone is still missing. The 57% of the home-owning population are about to find out how much their loss of local tax deductions and mortgage deductions is going to cost them when they file their 2018 returns in April. They happen to be the country’s biggest spenders. That’s another immeasurable negative for the economy.
Take money out of the pockets of the spenders and give it to the savers and you can’t have anything but a weakening on the economy.
All in all, it will be one of the worst years of the decade for the economy. Maybe that’s what the nightmarish fourth quarter crash was trying to tell us.
The final move of a decade long bull market is upon us.
Corporate earnings are at record levels and are climbing at 6% a year. Cash on the balance sheet is at an all-time high as are profit margins. Interest rates are still near historic lows.
Yet, there is not a whiff of inflation anywhere except in now fading home costs and paper asset prices. Almost all other asset classes offer pitiful alternatives.
The golden age of passive index investing is over. This year, portfolio managers are going to have to earn their crust of bread through perfect market timing, sector selection, and individual name-picking. Good luck with that. But then, that’s why you read this newsletter.
I expect an inverse “V”, or Greek lambda type of year. Stocks will rally first, driven by delayed rate rises, a China war settlement, and the end of the government shut down. That will give the Fed the confidence to start raising rates again by mid-year because inflation is finally starting to show. This will deliver another gut-punching market selloff in the second half giving us a negative stock market return for the second year in a row. That hasn’t happened since the Dotcom Bust of 2001-2002.
How much money will I make this year? A lot more than last year’s middling 23.56% because now we have some reliable short selling opportunities for the first time in a decade. Short positions performed dreadfully when global liquidity is expanding. They do much better when it is shrinking, as it is now.
Amtrak needs to fill every seat in the dining car to get everyone fed, so you never know who you will share a table with for breakfast, lunch, and dinner.
There was the Vietnam vet Phantom jet pilot who now refused to fly because he was treated so badly at airports. A young couple desperate fleeing Omaha could only afford seats as far as Salt Lake City, sitting up all night. I paid for their breakfast.
A retired British couple was circumnavigating the entire US in a month on a “See America Pass.” Mennonites returning home by train because their religion forbade automobiles or airplanes.
This year is simply a numbers game for the bond market. The budget deficit should come in at a record $1.2 trillion. The Fed will take out another $600 billion through quantitative tightening. Some $1.8 trillion will be far too much for the bond market to soak up, meaning prices can only fall.
Except that this year is different for the following reasons.
1) The US government is now at war with the world’s largest bond buyer, the Chinese government.
2) A declining US dollar will frighten off foreign buyers to a large degree.
3) The tax cuts have come and gone with no real net benefit to the average American. Probably half of the country saw an actual tax increase from this tax cut, especially me.
All are HUGELY bond negative.
It all adds up to a massive crowding out of individual and corporate borrowers by the federal government, which will be forced to bid up for funds. You are already seeing this in exploding credit spreads. This will be a global problem. There are going to be a heck of a lot of government bonds out there for sale.
That 2.54% yield for the ten-year Treasury bond you saw on your screen in early January? You will laugh at that figure in a year as it hits 3.50% to 4.0%.
Bond investors today get an unbelievably bad deal. If they hang on to the longer maturities, they will get back only 90 cents worth of purchasing power at maturity for every dollar they invest a decade down the road at best.
The only short-term positive for bonds was Fed governor Jay Powell’s statement last week that our central bank will be sensitive to the level of the stock market when considering rate rises. That translates into the reality that rates won’t go up AT ALL as long as markets are in crash mode.
It all means that we are now only two and a half years into a bear market that could last for ten or twenty years.
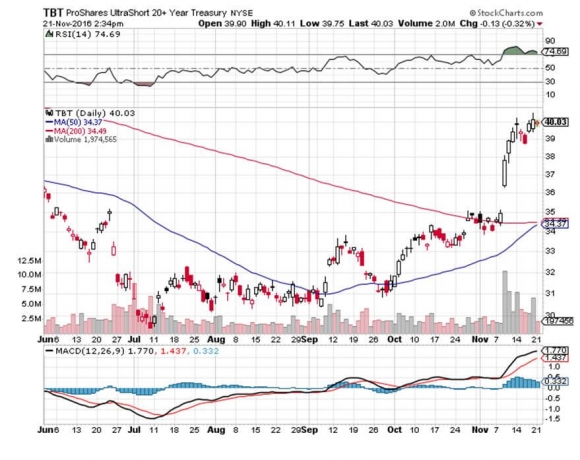
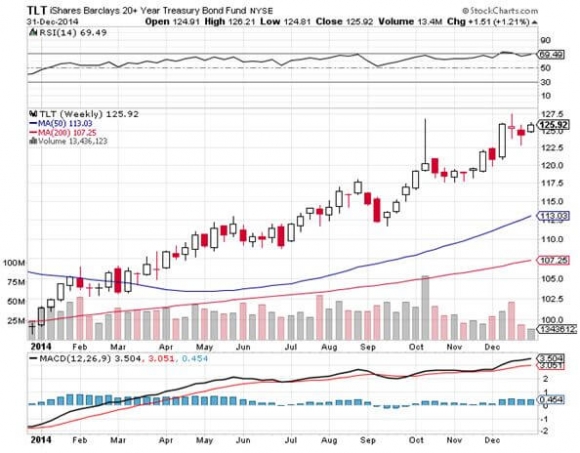
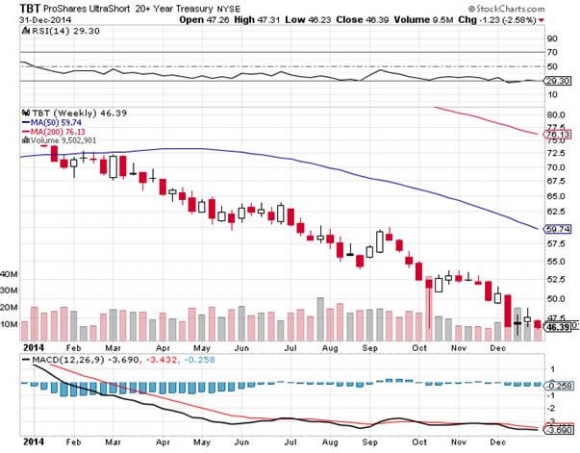
The IShares 20+ Year Treasury Bond ETF (TLT) trading today at $123 could drop below $100. The 2X ProShares 20+ Short Treasury Bond Fund (TBT) now at $31 is headed for $50 or more.
Junk Bonds (HYG) are already reading the writing on the wall taking a shellacking during the Q4 stock market meltdown. This lackluster return ALWAYS presages an inverted yield curve by a year where short term interest rates are higher than long term ones. This in turn reliably predicts a full-scale recession by 2020 at the latest.
I have pounded away at you for years that interest rate differentials are far and away the biggest decider of the direction in currencies.
This year will prove that concept once again.
With overnight rates now at 2.50% and ten-year Treasury bonds at 2.54%, the US now has the highest interest rates of any major industrialized economy.
However, pause interest rate rises for six months or a year and the dollar loses its mojo very quickly.
Compounding the problem is that a weak dollar begets selling from foreign investors. They are in a mood to do so anyway, as they see rising political instability in the US a burgeoning threat to the value of the greenback.
So the dollar will turn weak against all major currencies, especially the Japanese yen (FXY), and the Australian (FXA) and Canadian (FXC) dollars.
A global synchronized economic slowdown can mean only one thing and that is sustainably lower commodity prices.
Industrial commodities, like copper, iron ore, performed abysmally in 2018, dope slapped by the twin evils of a strong dollar and the China trade war.
We aren’t returning to the heady days of the last commodity bubble top anytime soon. Investors are already front running that move now.
However, once this sector gets the whiff of a weak dollar or higher inflation, it will take off like a scalded chimp.
Now that their infrastructure is largely built out, the Middle Kingdom will change drivers of its economy. This is world-changing.
The shift will be from foreign exports to domestic consumption. This will be a multi-decade process, and they have $3.1 trillion in foreign exchange reserves to finance it.
It will still demand prodigious amounts of imported commodities but not as much as in the past.
This trend ran head-on into a decade-long expansion of capacity by the commodities industry, delivering the five-year bear market that we are only just crawling out of.
The derivative equity plays here, Freeport McMoRan (FCX) and Companhia Vale do Rio Doce (VALE) have all been some of the best-performing assets of 2017.
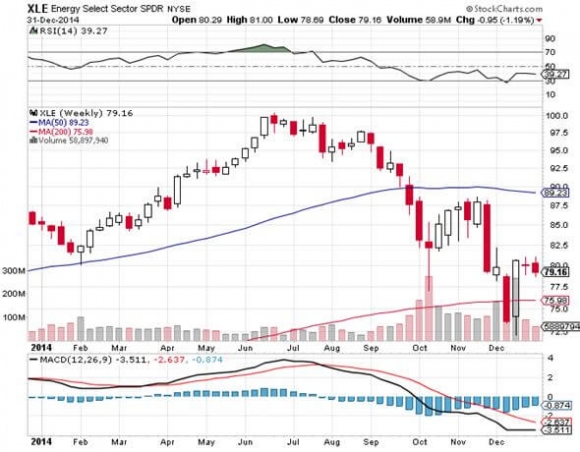
If you expect a trade war-induced global economic slowdown, the last thing in the world you want to own is an energy investment.
And so it was in Q4 when the price of oil got hammered doing a swan dive from $68 to $42 a barrel, an incredible 38% hickey.
All eyes will be focused on OPEC production looking for new evidence of quota cheating which is slated to expire at the end of 2018. Their latest production cut looked great on paper but proved awful in practice. Welcome to the Middle East.
The only saving grace is that with crude at these subterranean levels, new investment in fracking production has virtually ceased. No matter, US pipelines are operating at full capacity anyway.
OPEC production versus American frackers will create the constant tension in the marketplace for all of 2019.
My argument in favor of commodities and emerging markets applies to Texas tea as well. A weaker US dollar, trade war end, interest rate halt are all big positives for any oil investment. The cure for low oil prices is low prices.
That makes energy Master Limited Partnerships, now yielding 6-10%, especially interesting in this low yield world. Since no one in the industry knows which issuers are going bankrupt, you have to take a basket approach and buy all of them.
The Alerian MLP ETF (AMLP) does this for you in an ETF format. Our train has moved over to a siding to permit a freight train to pass, as it has priority on the Amtrak system.
Three Burlington Northern engines are heaving to pull over 100 black, spanking brand new tank cars, each carrying 30,000 gallons of oil from the fracking fields in North Dakota.
There is another tank car train right behind it. No wonder Warren Buffett tap dances to work every day as he owns the railroad.
We are also seeing relentless improvements on the energy conservation front with more electric vehicles, high mileage conventional cars, and newly efficient building.
Anyone of these inputs is miniscule on its own. But add them all together and you have a game changer.
As is always the case, the cure for low prices is low prices. But we may never see $100/barrel crude again. In fact, the coming peak in oil prices may be the last one we ever see. The word is that leasing companies will stop offering five-year leases in five years because cars with internal combustion engines will become worthless in ten.
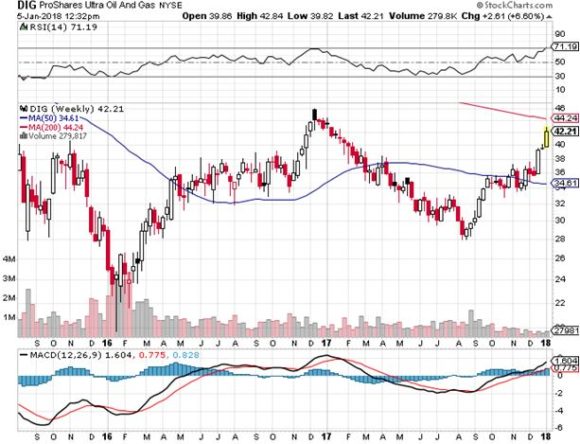
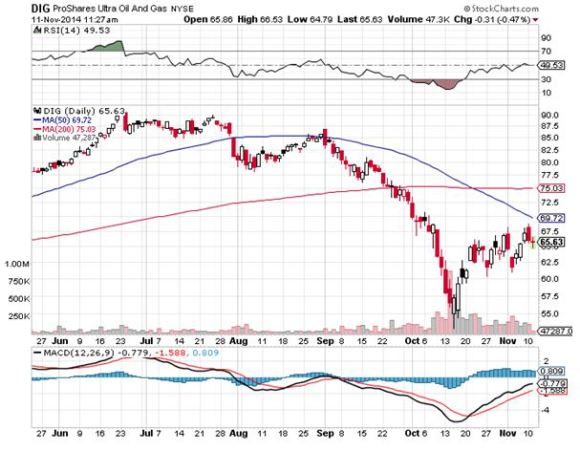
Add to your long-term portfolio (DIG), ExxonMobile (XOM), Cheniere Energy (LNG), the energy sector ETF (XLE), Conoco Phillips (COP), and Occidental Petroleum (OXY). But date these stocks, don’t marry them.
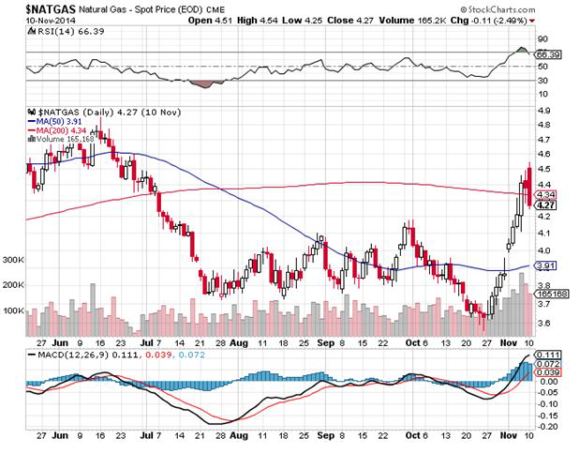
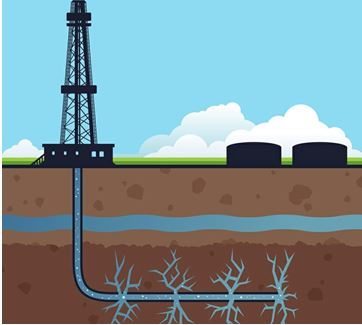
Skip natural gas (UNG) price plays and only go after volume plays because the discovery of a new 100-year supply from “fracking” and horizontal drilling in shale formations is going to overhang this subsector for a very long time, like the rest of our lives.
It is a basic law of economics that cheaper prices bring greater demand and growing volumes which have to be transported. Any increase in fracking creates more supply of natural gas.
The train has added extra engines at Denver, so now we may begin the long laboring climb up the Eastern slope of the Rocky Mountains.
On a steep curve, we pass along an antiquated freight train of hopper cars filled with large boulders.
The porter tells me this train is welded to the tracks to create a windbreak. Once, a gust howled out of the pass so swiftly that it blew a train over on to its side.
In the snow-filled canyons, we sight a family of three moose, a huge herd of elk, and another group of wild mustangs. The engineer informs us that a rare bald eagle is flying along the left side of the train. It’s a good omen for the coming year.
We also see countless abandoned 19th century gold mines and the broken-down wooden trestles leading to them, relics of previous precious metals booms. So, it is timely here to speak about the future of precious metals.
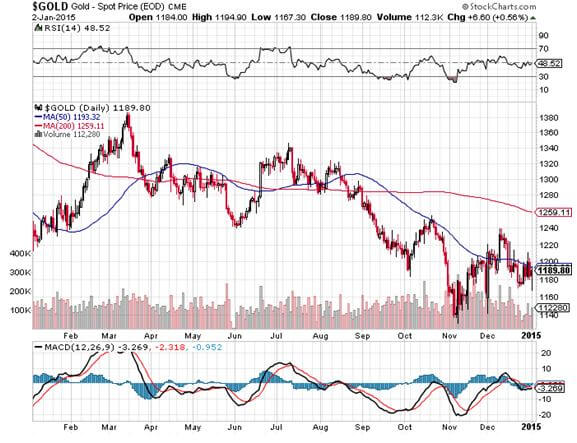
Gold (GLD) lost money in 2018, off 2.4%. More volatile silver (SLV) shed 12%.
This was expected, as non-yielding assets like precious metals do terribly during times of rising interest rates.
In 2019, gold will finally be coming out of a long dark age. As long as the world was clamoring for paper assets like stocks, gold was just another shiny rock. After all, who needs an insurance policy if you are going to live forever?
But the long-term bull case is still there. Gold is not dead; it is just resting.
If you forgot to buy gold at $35, $300, or $800, another entry point here up for those who, so far, have missed the gravy train.
To a certain extent, the belief that high-interest rates are bad for gold is a myth. Wealth creation is a far bigger driver. To see what I mean, take a look at a gold chart for the 1970s when interest rates were rising sharply.
Remember, this is the asset class that takes the escalator up and the elevator down, and sometimes the window.
If the institutional world devotes just 5% of their assets to a weighting in gold, and an emerging market central bank bidding war for gold reserves continues, it has to fly to at least $2,300, the inflation-adjusted all-time high, or more.
This is why emerging market central banks step in as large buyers every time we probe lower prices. China and India emerged as major buyers of gold in the final quarters of 2018.
They were joined by Russia which was looking for non-dollar investments to dodge US economic and banking sanctions.
That means it’s just a matter of time before gold breaks out to a new multiyear high above $1,300 an ounce. ETF players can look at the 1X (GLD) or the 2X leveraged gold (DGP).
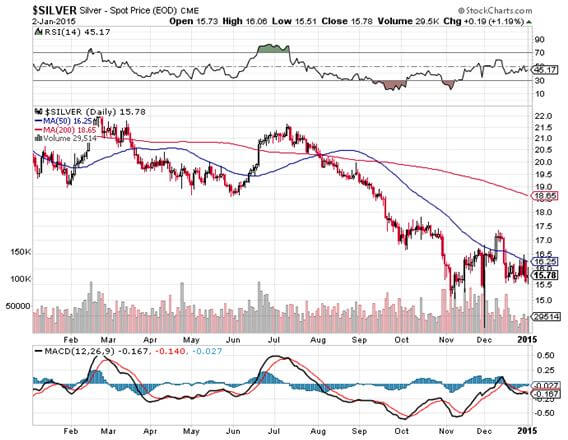
I would also be using the next bout of weakness to pick up the high beta, more volatile precious metal, silver (SLV) which I think could rise from the present $14 and hit $50 once more, and eventually $100.
The turbocharger for gold will hit sometime in 2019 with the return of inflation. Hello stagflation, it’s been a long time.
Would You Believe This is a Purple State?
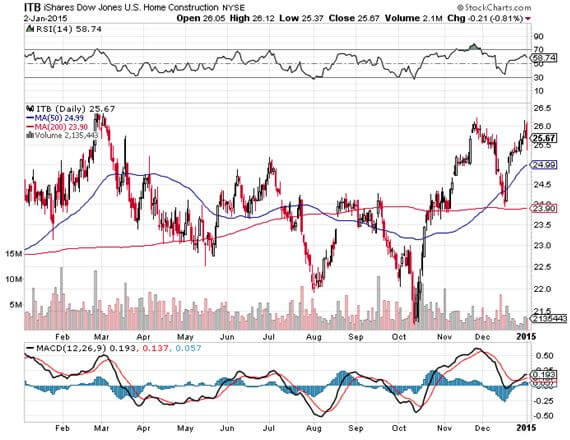
8) Real Estate (ITB), (LEN),
The majestic snow-covered Rocky Mountains are behind me. There is now a paucity of scenery with the endless ocean of sagebrush and salt flats of Northern Nevada outside my window, so there is nothing else to do but write.
My apologies in advance to readers in Wells, Elko, Battle Mountain, and Winnemucca, Nevada.
It is a route long traversed by roving bands of Indians, itinerant fur traders, the Pony Express, my own immigrant forebears in wagon trains, the transcontinental railroad, the Lincoln Highway, and finally US Interstate 80.
Passing by shantytowns and the forlorn communities of the high desert, I am prompted to comment on the state of the US real estate market.
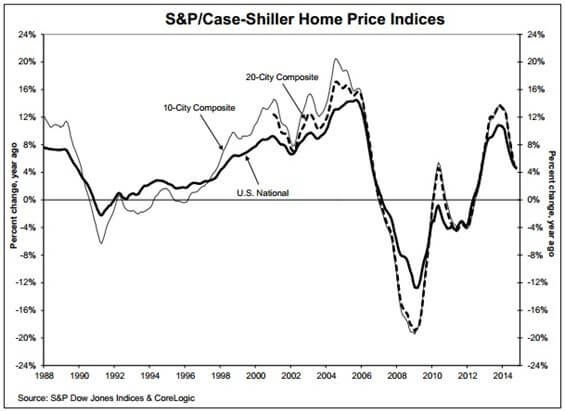
There is no doubt a long-term bull market in real estate is taking a major break. If you didn’t sell your house by March last year you’re screwed and stuck for the duration.
And you’re doubly screwed if you’re trying to sell your home now during the government shutdown. With the IRS closed, tax return transcripts are unobtainable making any loan approval impossible. And no one at Fannie Mae or Freddie Mac, the ultimate buyers of 70% of US home loans, has answered their phone this year.
The good news is that we will not see a 2008 repeat when home values cratered by 50%-70%. There is just not enough leverage in the system to do any real damage. That has gone elsewhere, like in exchange-traded funds. You can thank Dodd/Frank for that which imposed capital rules so strict that it is almost impossible for banks to commit suicide.
And no matter how dire conditions may appear now, you are not going to see serious damage in a market where there is a generational structural shortage of supply.
We are probably seven years into a 17-year run at the next peak in 2028. What we are suffering now is a brief two-year pause to catch our breath. Those bidding wars were getting tiresome anyway.
There are only three numbers you need to know in the housing market for the next 20 years: there are 80 million baby boomers, 65 million Generation Xers who follow them, and 86 million in the generation after that, the Millennials.
The boomers have been unloading dwellings to the Gen Xers since prices peaked in 2007. But there is not enough of the latter, and three decades of falling real incomes mean that they only earn a fraction of what their parents made. That’s what caused the financial crisis.
If they have prospered, banks won’t lend to them. Brokers used to say that their market was all about “location, location, location.” Now it is “financing, financing, financing.” Imminent deregulation is about to deep-six that problem.
There is a happy ending to this story.
Millennials now aged 23-38 are already starting to kick in as the dominant buyers in the market. They are just starting to transition from 30% to 70% of all new buyers in this market.
The Great Millennial Migration to the suburbs has just begun.
As a result, the price of single-family homes should rocket tenfold during the 2020s as they did during the 1970s and the 1990s when similar demographic forces were at play.
This will happen in the context of a coming labor shortfall, soaring wages, and rising standards of living.
Rising rents are accelerating this trend. Renters now pay 35% of the gross income, compared to only 18% for owners, and less when multiple deductions and tax subsidies are taken into account.
Remember too that, by then, the US will not have built any new houses in large numbers in 12 years.
We are still operating at only a half of the peak rate. Thanks to the Great Recession, the construction of five million new homes has gone missing in action.
That makes a home purchase now particularly attractive for the long term, to live in, and not to speculate with. And now that it is temporarily a buyer’s market, it is a good time to step in for investment purposes.
You will boast to your grandchildren how little you paid for your house as my grandparents once did to me ($3,000 for a four-bedroom brownstone in Brooklyn in 1922), or I do to my kids ($180,000 for an Upper East Side high rise in 1983).
That means the major homebuilders like Lennar (LEN), Pulte Homes (PHM), and KB Homes (KBH) may finally be a buy on the dip.
Quite honestly, of all the asset classes mentioned in this report, purchasing your abode is probably the single best investment you can make now.
If you borrow at a 4% 5/1 ARM rate, and the long-term inflation rate is 3%, then over time you will get your house nearly for free.
How hard is that to figure out?
Crossing the Bridge to Home Sweet Home
9) Postscript
We have pulled into the station at Truckee in the midst of a howling blizzard.
My loyal staff has made the ten-mile treck from my beachfront estate at Incline Village to welcome me to California with a couple of hot breakfast burritos and a chilled bottle of Dom Perignon Champagne which has been resting in a nearby snowbank. I am thankfully spared from taking my last meal with Amtrak.
After that, it was over legendary Donner Pass, and then all downhill from the Sierras, across the Central Valley, and into the Sacramento River Delta.
Well, that’s all for now. We’ve just passed the Pacific mothball fleet moored near the Benicia Bridge. The pressure increase caused by a 7,200-foot descent from Donner Pass has crushed my water bottle.
The Golden Gate Bridge and the soaring spire of Salesforce Tower are just around the next bend across San Francisco Bay.
A storm has blown through, leaving the air crystal clear and the bay as flat as glass. It is time for me to unplug my MacBook Pro and iPhone X, pick up my various adapters, and pack up.
We arrive in Emeryville 45 minutes early. With any luck, I can squeeze in a ten-mile night hike up Grizzly Peak and still get home in time to watch the ball drop in New York’s Times Square.
I reach the ridge just in time to catch a spectacular pastel sunset over the Pacific Ocean. The omens are there. It is going to be another good year.
I’ll shoot you a Trade Alert whenever I see a window open at a sweet spot on any of the dozens of trades described above.
Good trading in 2019!
John Thomas
The Mad Hedge Fund Trader
https://madhedgefundtrader.com/wp-content/uploads/2019/05/cropped-mad-hedge-logo-transparent-192x192_f9578834168ba24df3eb53916a12c882.png00Mad Hedge Fund Traderhttps://madhedgefundtrader.com/wp-content/uploads/2019/05/cropped-mad-hedge-logo-transparent-192x192_f9578834168ba24df3eb53916a12c882.pngMad Hedge Fund Trader2019-01-09 01:05:052019-01-08 21:01:382019 Annual Asset Class Review: A Global Vision
What if you want to be a little more aggressive, say twice as aggressive?
What if markets don’t deliver any year on year change as they have done many times in the past?
Then you need a little more juice in your portfolio, and some extra leverage to earn your crust of bread and secure your retirement.
It turns out that I have just the solution for you.
This would be my “Passive/Aggressive Portfolio.”
I call it passive in that you just purchase these positions and leave them alone and not trade them.
I call it aggressive as it involves a basket of 2x leveraged ETFs issued by ProShares, based in Bethesda, MD (click here for their link).
The volatility of this portfolio will be higher. But the returns will be double what you would get with an index fund, and possibly much more. It is a “Do not open until 2035” kind of investment strategy.
Here is the makeup of the portfolio:
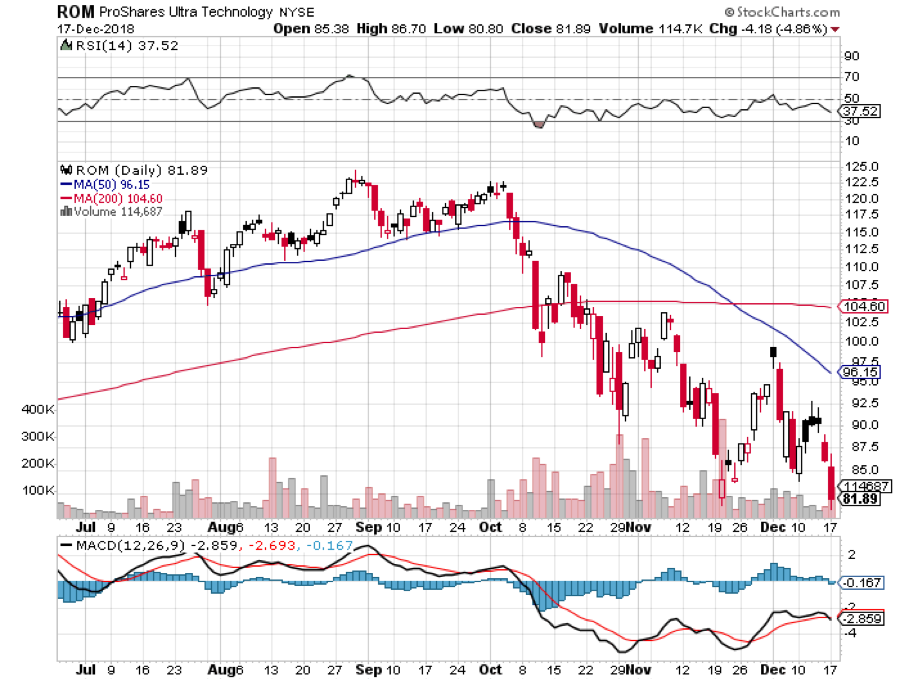
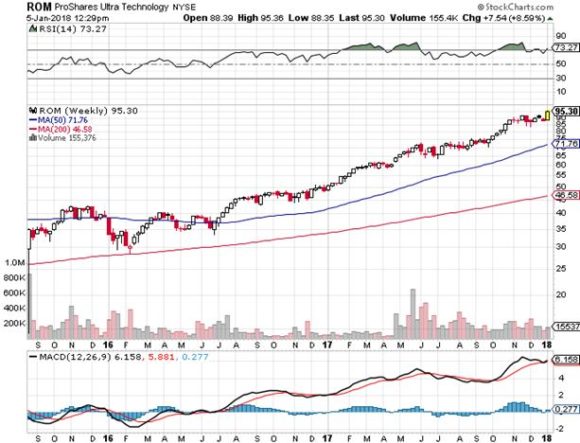
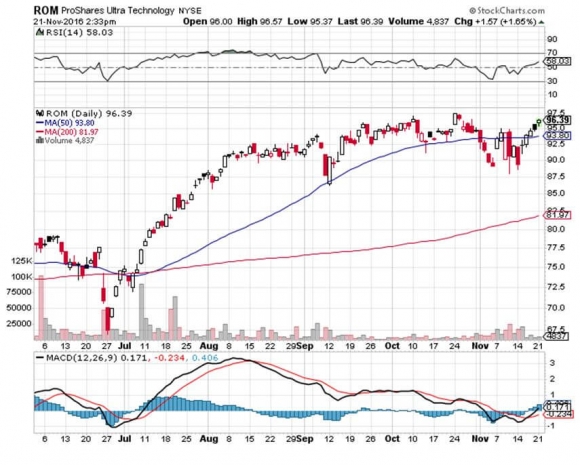
(ROM) –- ProShares Ultra Technology Fund - The three largest single-stock holdings are Apple (AAPL), Microsoft (MSFT), and Facebook (FB). For more details on the fund, please click here.
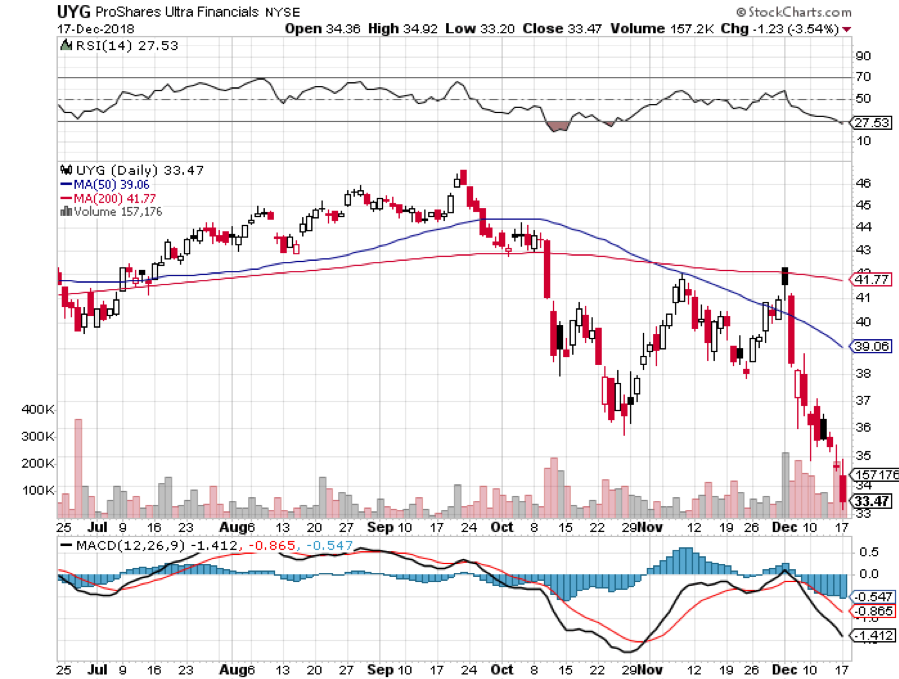
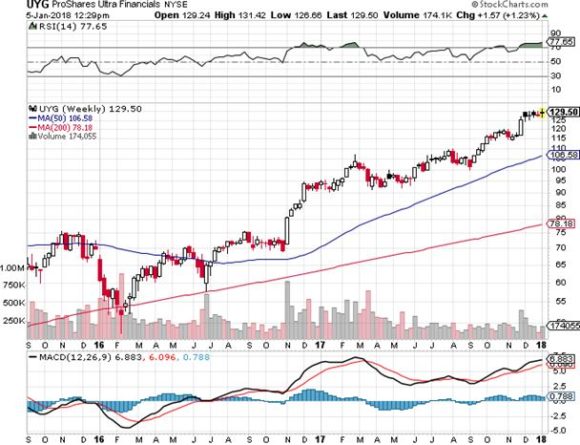
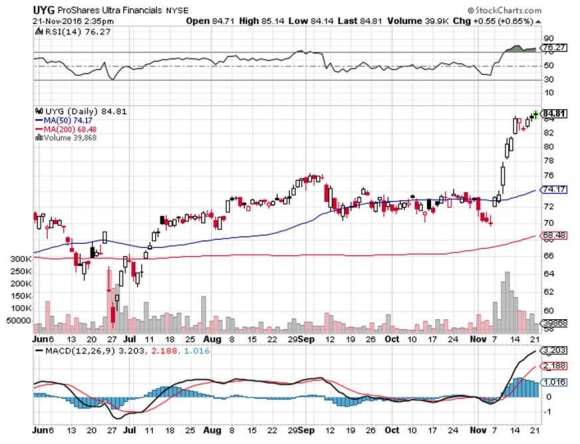
(UYG) – ProShares Ultra Financials Fund - The three largest single-stock holdings are Wells Fargo (WFC), Berkshire Hathaway (BRK.B), and JP Morgan Chase (JPM). For more details on the fund, please click here.
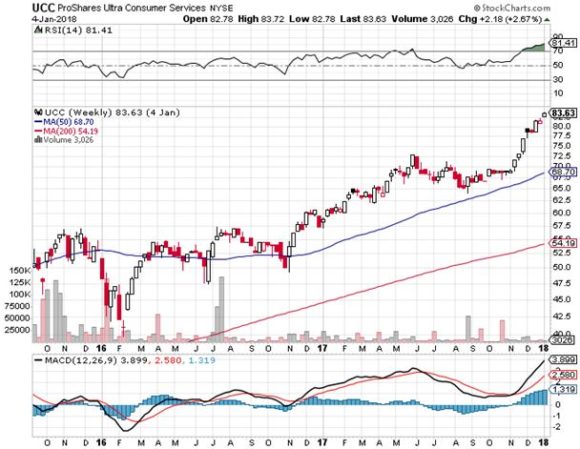
(UCC) – ProShares Ultra Consumer Services Fund - The three largest single-stock holdings are Amazon (AMZN), (Walt Disney), (DIS), and Home Depot (HD). For more details on the fund, please click here.
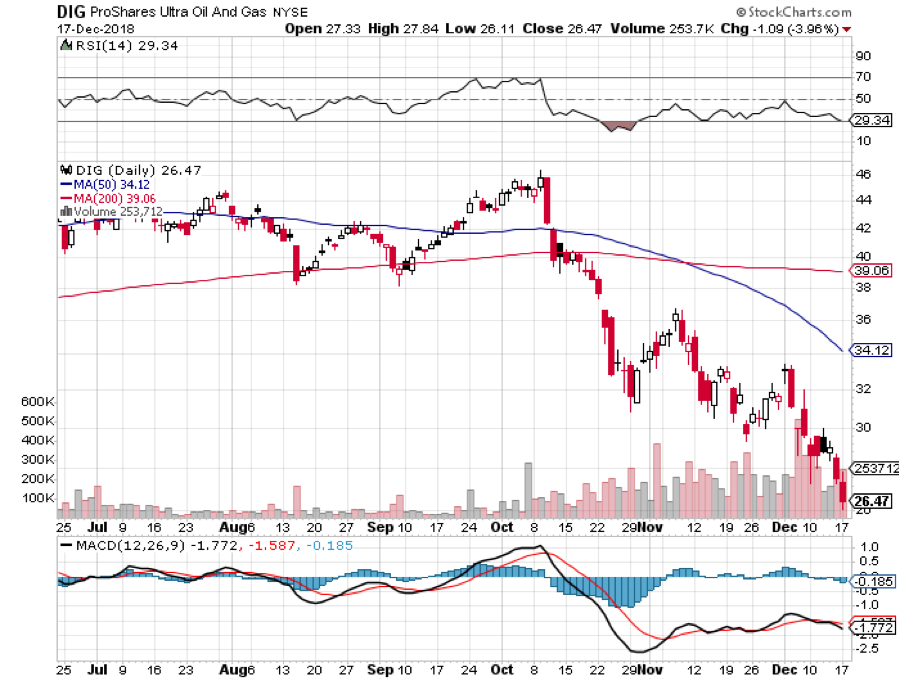
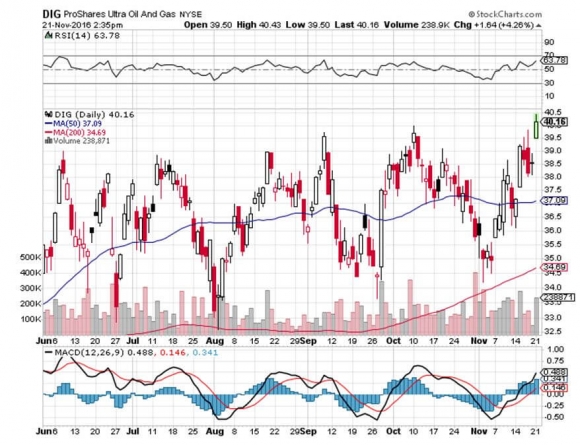
(DIG) -- ProShares Ultra Oil & Gas Fund - The three largest single-stock holdings are ExxonMobile (XOM), Chevron (CVX), and Schlumberger (SLB). For more details on the fund, please click here.
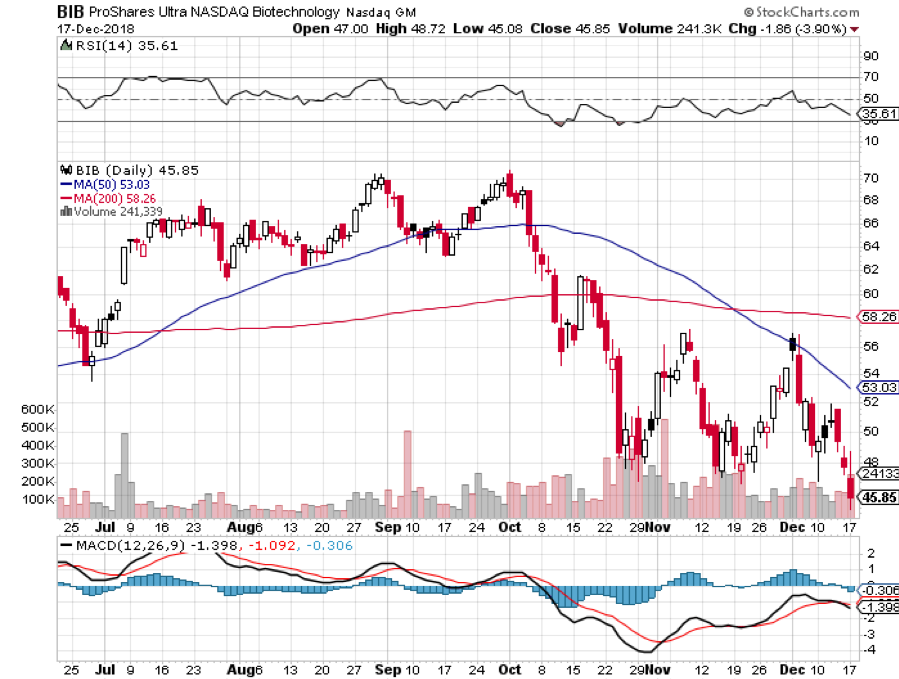
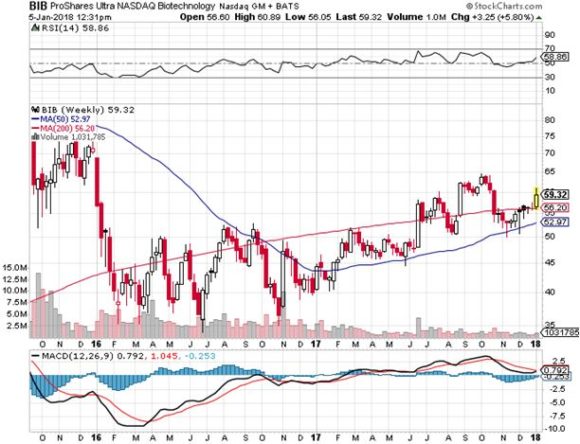
(BIB) – ProShares Ultra NASDAQ Biotechnology Fund – The three largest single-stock holdings are Amgen (AMGN), Regeneron (REGN), and Gilead Sciences (GILD). For more details on the fund, please click here.
You can play around with the sector mix at your own discretion. Just focus on the fastest growing sectors of the US economy which the Mad Hedge Fund Trader does on a daily basis.
It is tempting to add more leveraged ETFs for sectors that are completely bombed out, like gold (UGL) and commodities (UCD).
But it is likely that these despised ETF’s will move down before they move up, especially going into yearend.
There is also the 2X short Treasury bond fund (TBT) which I have been trading in and out of for years, a bet that long-term bonds will go down, interest rates rise.
There are a couple of provisos to mention here.
This is absolutely NOT a portfolio you want to own going into a recession. So you will need to exercise some kind of market timing, however occasional.
The good news is that I make more money in bear markets than I do in bull markets because the volatility is so high. However, to benefit from this skill set, you have to keep reading the Diary of a Mad Hedge Fund Trader.
There is also a problem with leveraged ETFs in that management and other fees can be high, dealing spreads wide, and tracking error huge.
This is why I am limiting the portfolio to 2X ETFs, and avoiding their much more costly and inefficient 3X cousins which are really only good for intraday trading. The 3X ETFs are really just a broker enrichment vehicle.
There are also going to be certain days when you might want to just go out and watch a long movie, like Gone With the Wind, with an all ETF portfolio, rather than monitor their performance, no matter how temporary it may be.
A good example was the August 24 flash crash when the complete absence of liquidity drove all of these funds to huge discounts to their asset values.
Check out the charts below, and you can see the damage that was wrought by high-frequency traders on that cataclysmic day, down -35% in the case of the (ROM). Notice that all of these discounts disappeared within hours. It was really just a function of the pricing mechanism being broken.
I have found the portfolio above quite useful when close friends and family members ask me for stock tips for their retirement funds.
It was perfect for my daughter who won’t be tapping her teacher’s pension accounts for another 45 years when I will be long gone. She mentions her blockbuster returns every time I see her, and she has only been in them for five years.
Imagine what technology, financial services, consumer discretionaries, biotechnology, and oil and gas will be worth then? It boggles the mind. My guess is up 100-fold from today’s levels.
You won’t want to put all of your money into a single portfolio like this. But it might be worth carving out 10% of your capital and just leaving it there.
That will certainly be a recommendation for financial advisors besieged with clients complaining about paying high fees for negative returns in a year that is unchanged, or up only 1%-2%. Virtually everyone has them right now.
Adding some spice, and a little leverage to their portfolios might be just the ticket for them.
Good to Have a Portfolio for All Market Conditions
https://madhedgefundtrader.com/wp-content/uploads/2019/05/cropped-mad-hedge-logo-transparent-192x192_f9578834168ba24df3eb53916a12c882.png00Mad Hedge Fund Traderhttps://madhedgefundtrader.com/wp-content/uploads/2019/05/cropped-mad-hedge-logo-transparent-192x192_f9578834168ba24df3eb53916a12c882.pngMad Hedge Fund Trader2018-12-18 01:06:282018-12-17 20:25:32The Mad Hedge Passive/Aggressive Portfolio
What if you want to be a little more aggressive with your investment strategy, say twice as aggressive? What if markets don't deliver any year on year change?
Then you need a little more pizzazz in your portfolio, and some extra leverage to earn your crust of bread and secure your retirement.
It turns out that I have just the solution for you. This would be my "Passive/Aggressive Portfolio".
I call it passive in that you just purchase these positions and leave them alone and not trade them. I call it aggressive as it involves a basket of 2x leveraged ETF's issued by ProShares, based Bethesda, MD (click here for their link).
The volatility of this portfolio will be higher. But the returns will be double what you would get with an index fund, and possibly much more. It is a "Do not open until 2035" kind of investment strategy.
Here is the makeup of the portfolio:
(ROM) - ProShares Ultra Technology Fund - The three largest single stock holdings are Apple (AAPL), Microsoft (MSFT), and Facebook (FB). It was up 80.95% last year. For more details on the fund, please click here.
(UYG) - ProShares Ultra Financials Fund - The three largest single stock holdings are Wells Fargo (WFC), Berkshire Hathaway (BRK.B), and JP Morgan Chase (JPM). It was up 38.42% last year. For more details on the fund, please click here.
(UCC) - ProShares Ultra Consumer Services Fund - The three largest single stock holdings are Amazon (AMZN), Walt Disney (DIS), and Home Depot (HD). It was up 3.71% last year. For more details on the fund, please click here.
(DIG)- ProShares Ultra Oil & Gas Fund - The three largest single stock holdings are ExxonMobil (XOM), Chevron (CVX), and Schlumberger (SLB). It was DOWN 9.20% last year. For more details on the fund, please click here.
(BIB) - ProShares Ultra NASDAQ Biotechnology Fund - The three largest single stock holdings are Amgen (AMGN), Regeneron (REGN), and Gilead Sciences (GILD). It was up 40.49% last year, please click here.
You can play around with the sector mix at your own discretion. Just focus on the fastest growing sectors of the US economy, which the Mad Hedge Fund Trader does on a daily basis.
It is tempting to add more leveraged ETF's for sectors like gold (UGL), to act as an additional hedge.
There is also the 2X short Treasury bond fund (TBT), which I have been trading in and out of for years, a bet that long-term bonds will go down, interest rates rise.
There are a couple of provisos to mention here.
This is absolutely NOT a portfolio you want to own going into a recession. So, you will need to exercise some kind of market timing, however occasional.
The good news is that I make more money in bear markets than I do in bull markets because the volatility is so high. However, to benefit from this skill set, you have to keep reading the Diary of a Mad Hedge Fund Trader.
There is also a problem with leveraged ETF's in that management and other fees can be high, dealing spreads wide, and tracking error huge.
This is why I am limiting the portfolio to 2X ETF's, and avoiding their much more costly and inefficient 3X cousins, which are really only good for intraday trading. The 3X ETF's are really just a broker enrichment vehicle.
There are also going to be certain days when you might want to just go out and watch a long movie, like Gone With the Wind, with an all ETF portfolio, rather than monitor their performance, no matter how temporary it may be.
A good example was the flash crash, when the complete absence of liquidity drove all of these funds to huge discounts to their asset values.
Check out the long-term charts, and you can see the damage that was wrought by high frequency traders on that cataclysmic day, down -53% in the case of the (ROM). Notice that all of these discounts disappeared within hours. It was really just a function of the pricing mechanism being broken.
I have found the portfolio above quite useful when close friends and family members ask me for stock tips for their retirement funds.
It was perfect for my daughter, who won't be tapping her teacher's pension accounts for another 45 years, when I will be long gone. She mentions her blockbuster returns every time I see her, and she has only been in them for five years.
Imagine what technology, financial services, consumer discretionaries, biotechnology, and oil and gas will be worth then? It boggles the mind. My guess is up 100-fold from today's levels.
You won't want to put all of your money into a single portfolio like this. But it might be worth carving out 10% of your capital and just leaving it there.
That will certainly be a recommendation for financial advisors besieged with clients complaining about paying high fees for negative returns in a year that is unchanged, or up only 1%-2%. Virtually everyone has them right now.
Adding some spice, and a little leverage to their portfolios might be just the ticket for them.
I have long advocated my ?Buy and Forget? portfolio for those who are terrible at trading.
This is where you buy just six self hedging, counterbalancing exchange traded funds and then rebalance once a year (click here for the article).
But what if you want to be a little more aggressive, say twice as aggressive? What if markets don?t deliver any year on year change, as they have done this year?
Then you need a little more juice in your portfolio, and some extra leverage to earn your crust of bread and secure your retirement.
It turns out that I have just the solution for you. This would be my ?Passive/Aggressive Portfolio?.
I call it passive in that you just purchase these positions and leave them alone and not trade them. I call it aggressive as it involves a basket of 2x leveraged ETFs issued by ProShares, based in Bethesda, MD (click here for their site).
The volatility of this portfolio will be higher. But the returns will be double what you would get with an index fund, and possibly much more. It is a ?Do not open until 2035? kind of investment strategy.
Here is the makeup of the portfolio:
(ROM) ?- ProShares Ultra Technology Fund - The three largest single stock holdings are Apple (AAPL), Microsoft (MSFT), and Facebook (FB). It is up 13.7% so far this year. For more details on the fund, please click here: http://www.proshares.com/funds/rom_daily_holdings.html.
(UYG) ? ProShares Ultra Financials Fund - The three largest single stock holdings are Wells Fargo (WFC), Berkshire Hathaway (BRK.B), and JP Morgan Chase (JPM). It is up 6.2% so far this year. For more details on the fund, please click here: http://www.proshares.com/funds/uyg_index.html.
(UCC) ? ProShares Ultra Consumer Services Fund - The three largest single stock holdings are Amazon (AMZN), (Walt Disney), (DIS), and Home Depot (HD). It is up 18.3% so far this year. For more details on the fund, please click here:http://www.proshares.com/funds/ucc.html.
(DIG) -- ProShares Ultra Oil & Gas Fund - The three largest single stock holdings are ExxonMobil (XOM), Chevron (CVX), and Schlumberger (SLB). It is DOWN 38.2% so far this year. For more details on the fund, please click here: http://www.proshares.com/funds/dig.html.
(BIB) ? ProShares Ultra NASDAQ Biotechnology Fund ? The three largest single stock holdings are Amgen (AMGN), Regeneron (REGN), and Gilead Sciences (GILD). It is up 15% so far this year, but at one point (before the ?Sell in May and Go away? I widely advertised) it was up a positively stratospheric 64%. For more details on the fund, please click here; http://www.proshares.com/funds/bib.html.
You can play around with the sector mix at your own discretion. Just focus on the fastest growing sectors of the US economy, which the Mad Hedge Fund Trader does on a daily basis. It is tempting to add more leveraged ETFs for sectors that are completely bombed out, like gold (UGL), which has pared 27% of its value in 2015, and commodities (UCD) which is off 15%.
But it is likely that these despised ETFs will move down before they move up, especially going into year end.
There is also the 2X short Treasury bond fund (TBT), which I have been trading in and out of for years, a bet that long-term bonds will go down, interest rates rise.
There are a couple of provisos to mention here.
This is absolutely NOT a portfolio you want to own going into a recession. So you will need to exercise some kind of market timing, however occasional.
The good news is that I make more money in bear markets than I do in bull markets because the volatility is higher. However, to benefit from this skill set, you have to keep reading the Diary of a Mad Hedge Fund Trader.
There is also a problem with leveraged ETFs in that management and other fees can be high, dealing spreads wide, and tracking errors huge.
This is why I am limiting the portfolio to 2X ETFs, and avoiding their much more costly and inefficient 3X cousins, which are really only good for intraday trading. The 3X ETFs are really just a broker enrichment vehicle.
There are also going to be certain days when you might want to just go out and watch a long movie, like Gone With the Wind, with an all ETF portfolio, rather than monitor their performance, no matter how temporary it may be.
A good example was the August 24 flash crash, when the complete absence of liquidity drove all of these funds to huge discounts to their asset values.
Check out the charts below, and you can see the damage that was wrought by high frequency traders on that cataclysmic day, down -53% in the case of the (ROM). Notice that all of these discounts disappeared within hours. It was really just a function of the pricing mechanism being broken.
I have found the portfolio above quite useful when close friends and family members ask me for stock tips for their retirement funds.
It was perfect for my daughter who won?t be tapping her teacher?s pension accounts for another 45 years, when I will be long gone. She mentions her blockbuster returns every time I see her, and she has only been in them for five years.
Imagine what technology, financial services, consumer discretionaries, biotechnology, and oil and gas will be worth then? It boggles the mind. My guess is up 100 fold from today?s levels.
You won?t want to put all of your money into a single portfolio like this. But it might be worth carving out 10% of your capital and just leaving it there.
That will certainly be a recommendation for financial advisors besieged with clients complaining about paying high fees for negative returns in a year that is unchanged, or up only 1%-2%. Virtually everyone has them right now.
Adding some spice, and a little leverage to their portfolios might be just the ticket for them.
It?s Time to Spice Up Your Portfolio
00Mad Hedge Fund Traderhttps://madhedgefundtrader.com/wp-content/uploads/2019/05/cropped-mad-hedge-logo-transparent-192x192_f9578834168ba24df3eb53916a12c882.pngMad Hedge Fund Trader2016-11-23 01:07:302016-11-23 01:07:30The Passive/Aggressive Portfolio
After the market closes every night, I usually don a 60 pound backpack and climb the 2,000 foot mountain in my back yard.
To pass the time, I listen to audio books on financial and historical topics, about 200 a year (I?ve really got President Grover Cleveland nailed!). That?s if the howling packs of coyotes don?t bother me too much.
I also engage in mental calisthenics, engaging in complex mathematical calculations. How many grains of sand would you have to pile up to reach from the earth to the moon? How many matchsticks to circle the earth?
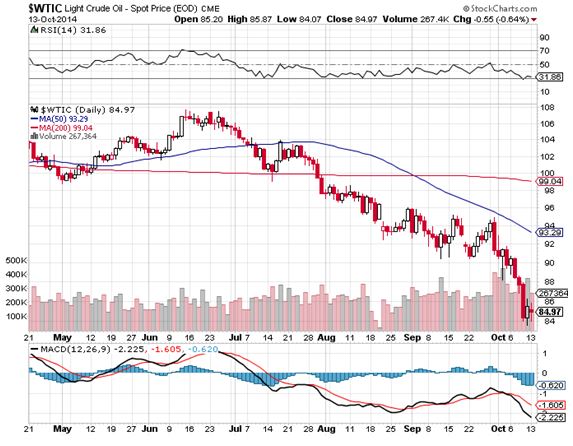
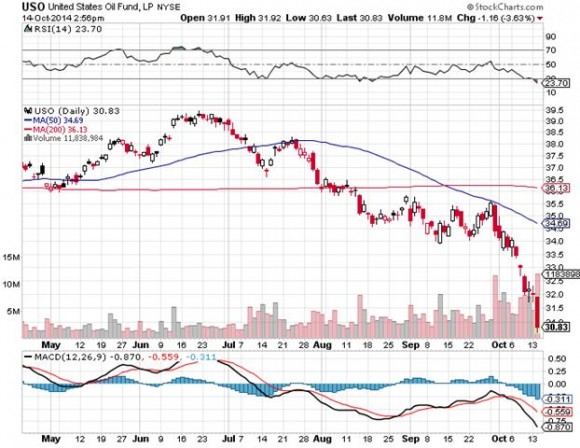
For last night?s exercise, I decided to quantify the impact of last year?s oil price crash on the global economy.
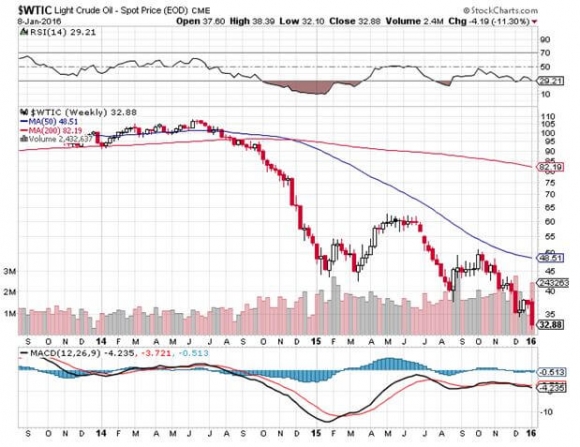
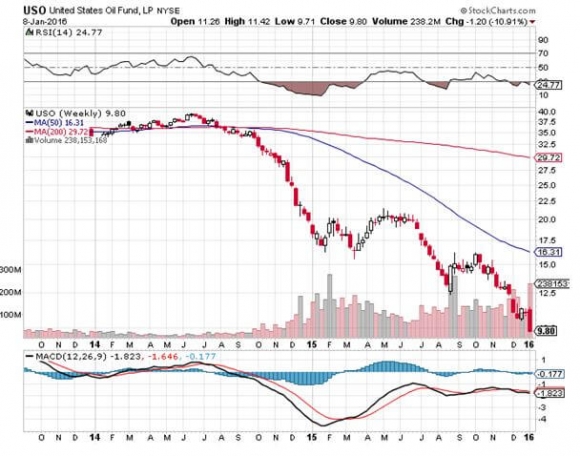
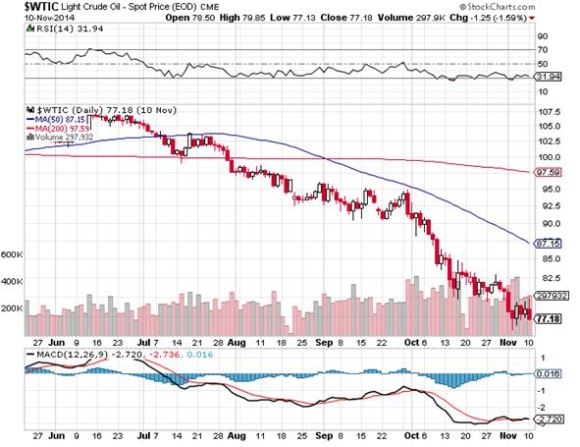
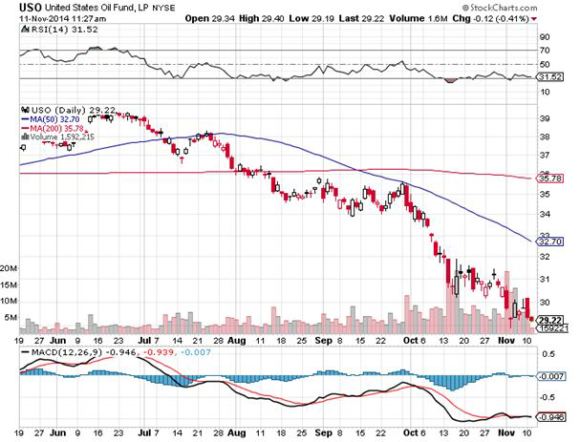
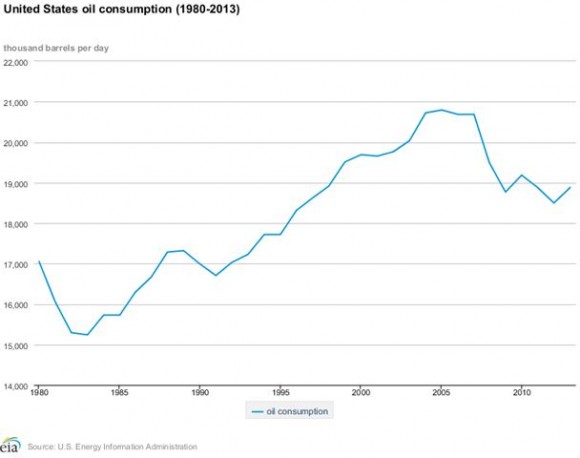
The world is currently consuming about 92 million barrels a day of Texas tea, or 33.6 billion barrels a year. In May, 2014 at the $107.50 high, that much oil cost $3.6 trillion. At today?s $32 intraday low you could buy that quantity of oil for a bargain $1 trillion.
Buy a barrel of crude, and you get three for free!
This means that $2.6 trillion has suddenly been taken out of the pockets of oil producers, and put into the pockets of oil consumers, i.e. you and me. Over the medium term, this is fantastic news for oil consumers. But for the short term, things could get very scary.
$2.6 trillion is a lot of money. If you had that amount of hundred dollar bills, it would rise to 250 million inches, 21 million feet, or 3,976 miles, or 1.2% of the way to the moon (another mental exercise). Tip this pile on its side, and you?d have a distance nearly equal to a round trip from San Francisco to New York.
The global financial system cannot move this amount of money around on short notice without causing some pretty severe disruptions. Expect a lot of bodies to float to the surface in 2016.
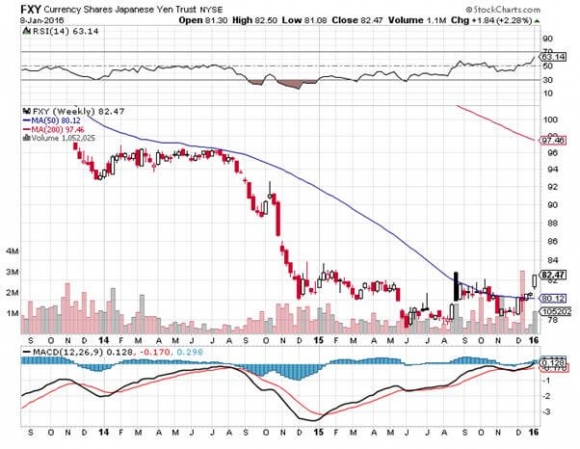
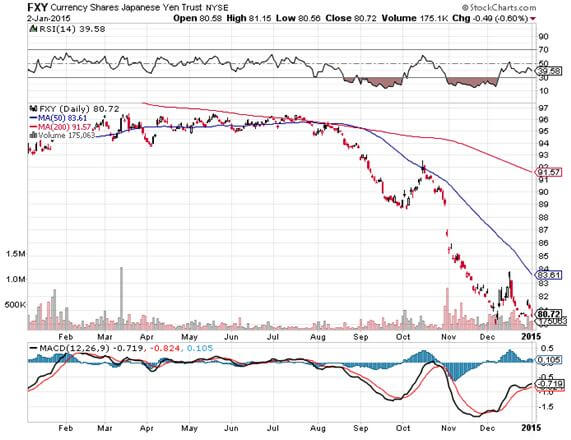
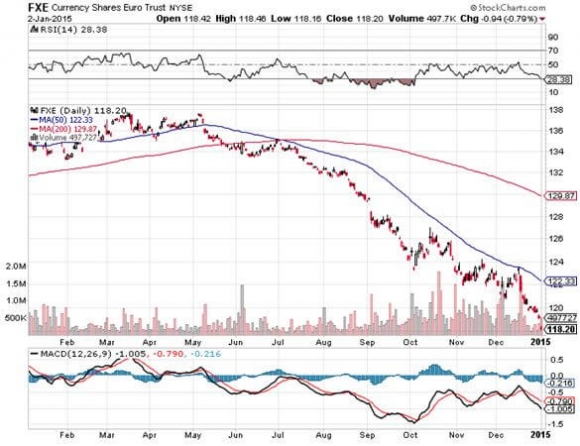
For a start, there is suddenly a lot less demand for dollars with which to buy oil. This has triggered short covering rallies in the long beleaguered Japanese Yen (FXY) and the Euro (FXE), which are just now backing off of long downtrends.
The fundamentals for these currencies are still dire. But the short-term trend now appears to be an upward one. The yen is tickling a one-year high against the buck as we speak.
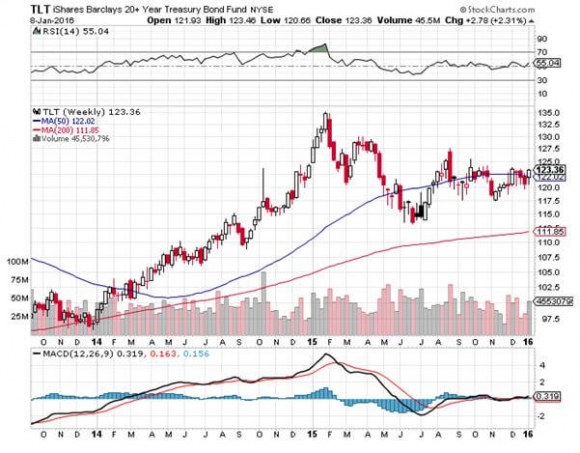
The US Federal Reserve certainly sees the oil crash as an enormously deflationary event. The use of energy is so widespread that it feeds into the cost of everything. That firmly takes the chance of any interest rate rise off the table for the rest of 2016. The Treasury bond market (TLT) has figured this out and launched on a monster rally, as have muni bonds (MUB).
Traders are also afraid that the disinflationary disease will spread, so they have been taking down the price of virtually all other hard commodities as well, like coal (KOL), iron ore (BHP), and copper (CU). For more depth on this, see my piece on ?The End of the Commodity Super Cycle? by clicking here.
The precipitous fall in energy investments everywhere will be felt principally in the 15 US states involved in energy production (Texas, Oklahoma, Louisiana, North Dakota. Etc.). So, the consumers in the other 35 states should be thrilled.
However, the plunge in energy stocks is getting so severe, that it is dragging down everything else with it. ALL shares are effectively oil shares right now. In fact, all asset classes are now moving tic for tic with the price of oil. That effectively makes all of you oil traders.
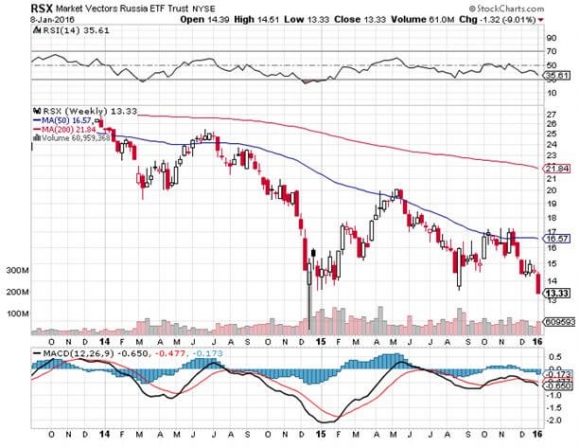
Throw on top of that the systemic risk presented by the ongoing collapse of the Russian economy. The Ruble has now fallen a staggering 70% in 18 months, and there is panic buying of everything going on in Moscow stores.
The means that the dollar denominated debt owed by local firms has just risen by 300%. Any foreign banks holding this debt are now probably regretting ever watching the film, Dr. Zhivago.
Russian interest rates there were just skyrocketed. The Russian stock market (RSX) is the world?s worst performing bourse. How do you spell ?depression? in the Cyrillic alphabet?
And guess what the new Russian currency is?
IPhone 6.0?s, of which Apple is now totally sold out in Alexander Putin?s domain!
Thankfully, this is more of a European, than an American problem. But nobody likes systemic risks, especially going into New Year trading. It?s a classic case of being careful what you wish for.
Of the $2.6 trillion today, about $650 billion is shifting between American pockets. That amounts to a hefty 3.3% of GDP. Tell me this won?t become a big political issue in the 2016 presidential election.
Money spent on oil is burned. However, money spent by newly enriched consumers has a multiplier effect. Spend a dollar at Walmart, and the company has to hire more workers, who then have more money to spend, and so on.
So a shifting of funds of this magnitude will probably add 1.5% to U.S. economic growth this year.
Ultimately, cheap energy as far as the eye can see is a key element of my ?Golden Age? scenario for the 2020?s (click herefor ?Get Ready for the Coming Golden Age?).
But you may have to get there by riding a roller coaster first.
Oil at $32?
https://www.madhedgefundtrader.com/wp-content/uploads/2012/03/roller_coaster2.jpg400392Mad Hedge Fund Traderhttps://madhedgefundtrader.com/wp-content/uploads/2019/05/cropped-mad-hedge-logo-transparent-192x192_f9578834168ba24df3eb53916a12c882.pngMad Hedge Fund Trader2016-01-11 01:07:482016-01-11 01:07:48Why We are All Now Oil Traders
I am once again writing this report from a first class sleeping cabin on Amtrak?s California Zephyr. By day, I have two comfortable seats facing each other next to a broad window. At night, they fold into bunk beds, a single and a double. There is a shower, but only Houdini could get in and out of it.
We are now pulling away from Chicago?s Union Station, leaving its hurried commuters, buskers, panhandlers, and majestic great halls behind. I am headed for Emeryville, California, just across the bay from San Francisco. That gives me only 56 hours to complete this report.
I tip my porter, Raymond, $100 in advance to make sure everything goes well during the long adventure, and to keep me up to date with the onboard gossip. The rolling and pitching of the car is causing my fingers to dance all over the keyboard. Spellchecker can catch most of the mistakes, but not all of them. Thank goodness for small algorithms.
As both broadband and cell phone coverage are unavailable along most of the route, I have to rely on frenzied searches during stops at major stations along the way to chase down data points.
You know those cool maps in the Verizon stores that show the vast coverage of their cell phone networks? They are complete BS. Who knew that 95% of America is off the grid? That explains a lot about our politics today. I have posted many of my better photos from the trip below, although there is only so much you can do from a moving train and an iPhone.
After making the rounds with strategists, portfolio managers, and hedge fund traders, I can confirm that 2014 was one of the toughest to trade for careers lasting 30, 40, or 50 years. Yet again, the stay at home index players have defeated the best and the brightest.
With the Dow gaining a modest 8% in 2014, and S&P 500 up a more virile 14.2%, this was a year of endless frustration. Volatility fell to the floor, staying at a monotonous 12% for seven boring consecutive months. Most hedge funds lagged the index by miles.
My Trade Alert Service, hauled in an astounding 30.3% profit, at the high was up 42.7%, and has become the talk of the hedge fund industry. That was double the S&P 500 index gain.
If you think I spend too much time absorbing conspiracy theories from the Internet, let me give you a list of the challenges I see financial markets facing in the coming year:
The Ten Highlights of 2015
1) Stocks will finish 2015 higher, almost certainly more than the previous year, somewhere in the 10-15% range. Cheap energy, ultra low interest rates, and 3-4% GDP growth, will expand multiples. It?s Goldilocks with a turbocharger.
2) Performance this year will be back-end loaded into the fourth quarter, as it was in 2014. The path forward became so clear, that some of 2015?s performance was pulled forward into November, 2014.
3) The Treasury bond market will modestly grind down, anticipating the inevitable rate rise from the Federal Reserve.
4) The yen will lose another 10%-20% against the dollar.
5) The Euro will fall another 10%, doing its best to hit parity with the greenback, with the assistance of beleaguered continental governments.
6) Oil stays in a $50-$80 range, showering the economy with hundreds of billions of dollars worth of de facto tax cuts.
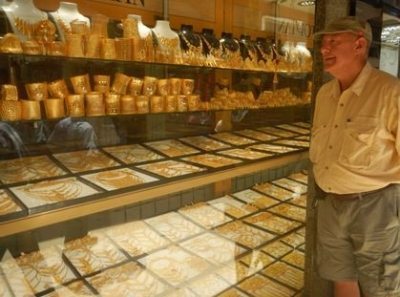
7) Gold finally bottoms at $1,000 after one more final flush, then rallies (My jeweler was right, again).
8) Commodities finally bottom out, thanks to new found strength in the global economy, and begin a modest recovery.
9) Residential real estate has made its big recovery, and will grind up slowly from here.
10) After a tumultuous 2014, international political surprises disappear, the primary instigators of trouble becalmed by collapsed oil revenues.
The Thumbnail Portfolio
Equities - Long. A rising but low volatility year takes the S&P 500 up to 2,350. This year we really will get another 10% correction. Technology, biotech, energy, solar, and financials lead.
Bonds - Short. Down for the entire year with long periods of stagnation.
Foreign Currencies - Short. The US dollar maintains its bull trend, especially against the Yen and the Euro.
Commodities - Long. A China recovery takes them up eventually.
Precious Metals - Stand aside. We get the final capitulation selloff, then a rally.
Agriculture - Long. Up, because we can?t keep getting perfect weather forever.
Real estate - Long. Multifamily up, commercial up, single family homes sideways to up small.
1) The Economy - Fortress America
This year, it?s all about oil, whether it stays low, shoots back up, or falls lower. The global crude market is so big, so diverse, and subject to so many variables, that it is essentially unpredictable.
No one has an edge, not the major producers, consumers, or the myriad middlemen. For proof, look at how the crash hit so many ?experts? out of the blue.
This means that most economic forecasts for the coming year are on the low side, as they tend to be insular and only examine their own back yard, with most predictions still carrying a 2% handle.
I think the US will come in at the 3%-4% range, and the global recovery spawns a cross leveraged, hockey stick effect to the upside. This will be the best performance in a decade. Most company earnings forecasts are low as well.
There is one big positive that we can count on in the New Year. Corporate earnings will probably come in at $130 a share for the S&P 500, a gain of 10% over the previous year. During the last five years, we have seen the most dramatic increase in earnings in history, taking them to all-time highs.
This is set to continue. Furthermore, this growth will be front end loaded into Q1. The ?tell? was the blistering 5% growth rate we saw in Q3, 2014.
Cost cutting through layoffs is reaching an end, as there is no one left to fire. That leaves hyper accelerating technology and dramatically lower energy costs the remaining sources of margin increases, which will continue their inexorable improvements. Think of more machines and software replacing people.
You know all of those hundreds of billions raised from technology IPO?s in 2014. Most of that is getting plowed right back into new start ups, accelerating the rate of technology improvements even further, and the productivity gains that come with it.
You can count on demographics to be a major drag on this economy for the rest of the decade. Big spenders, those in the 46-50 age group, don?t return in large numbers until 2022.
But this negative will be offset by a plethora of positives, like technology, global expansion, and the lingering effects of Ben Bernanke?s massive five year quantitative easing. A time to pay the piper for all of this largess will come. But it could be a decade off.
I believe that the US has entered a period of long-term structural unemployment similar to what Germany saw in the 1990?s. Yes, we may grind down to 5%, but no lower than that. Keep close tabs on the weekly jobless claims that come out at 8:30 AM Eastern every Thursday for a good read as to whether the financial markets will head in a ?RISK ON? or ?RISK OFF? direction.
Most of the disaster scenarios predicted for the economy this year were based on the one off black swans that never amounted to anything, like the Ebola virus, ISIS, and the Ukraine.
With the economy going gangbusters, and corporate earnings reaching $130 a share, those with a traditional ?buy and hold? approach to the stock market will do alright, provided they are willing to sleep through some gut churning volatility. A Costco sized bottle of Jack Daniels and some tranquillizers might help too.
Earnings multiples will increase as well, as much as 10%, from the current 17X to 18.5X, thanks to a prolonged zero interest rate regime from the Fed, a massive tax cut in the form of cheap oil, unemployment at a ten year low, and a paucity of attractive alternative investments.
This is not an outrageous expectation, given the 10-22 earnings multiple range that we have enjoyed during the last 30 years. If anything, it is amazing how low multiples are, given the strong tailwinds the economy is enjoying.
The market currently trades around fair value, and no market in history ever peaked out here. An overshoot to the upside, often a big one, is mandatory. After all, my friend, Janet Yellen, is paying you to buy stock with cheap money, so why not?
This is how the S&P 500 will claw its way up to 2,350 by yearend, a gain of about 12.2% from here. Throw in dividends, and you should pick up 14.2% on your stock investments in 2015.
This does not represent a new view for me. It is simply a continuation of the strategy I outlined again in October, 2014 (click here for ?Why US Stocks Are Dirt Cheap?).
Technology will be the top-performing sector once again this year. They will be joined by consumer cyclicals (XLV), industrials (XLI), and financials (XLF).
The new members in the ?Stocks of the Month Club? will come from newly discounted and now high yielding stocks in the energy sector (XLE).
There is also a rare opportunity to buy solar stocks on the cheap after they have been unfairly dragged down by cheap oil like Solar City (SCTY) and the solar basket ETF (TAN). Revenues are rocketing and costs are falling.
After spending a year in the penalty box, look for small cap stocks to outperform. These are the biggest beneficiaries of cheap energy and low interest rates, and also have minimal exposure to the weak European and Asian markets.
Share prices will deliver anything but a straight-line move. We finally got our 10% correction in 2014, after a three-year hiatus. Expect a couple more in 2015. The higher prices rise, the more common these will become.
We will start with a grinding, protesting rally that takes us up to new highs, as the market climbs the proverbial wall of worry. Then we will suffer a heart stopping summer selloff, followed by another aggressive yearend rally.
Cheap money creates a huge incentive for companies to buy back their own stock. They divert money from their $3 trillion cash hoard, which earns nothing, retire shares paying dividends of 3% or more, and boost earnings per share without creating any new business. Call it financial engineering, but the market loves it.
Companies are also retiring stock through takeovers, some $2 trillion worth last year. Expect more of this to continue in the New Year, with a major focus on energy. Certainly, every hedge fund and activist investor out there is undergoing a crash course on oil fundamentals. After a 13-year bull market in energy, the industry is ripe for a cleanout.
This is happening in the face of both an individual and institutional base that is woefully underweight equities.
The net net of all of this is to create a systemic shortage of US equities. That makes possible simultaneous rising prices and earnings multiples that have taken us to investor heaven.
Amtrak needs to fill every seat in the dining car, so you never know who you will get paired with.
There was the Vietnam vet Phantom jet pilot who now refused to fly because he was treated so badly at airports. A young couple desperate to get out of Omaha could only afford seats as far as Salt Lake City, sitting up all night. I paid for their breakfast.
A retired British couple was circumnavigating the entire US in a month on a ?See America Pass.? Mennonites returning home by train because their religion forbade airplanes.
If you told me that US GDP growth was 5%, unemployment was at a ten year low at 5.8%, and energy prices had just halved, I would have pegged the ten-year Treasury bond yield at 6.0%. Yet here we are at 2.10%.
Virtually every hedge fund manager and institutional investor got bonds wrong last year, expecting rates to rise. I was among them, but that is no excuse. At least I have good company.
You might as well take your traditional economic books and throw them in the trash. Apologies to John Maynard Keynes, John Kenneth Galbraith, and Paul Samuelson.
The reasons for the debacle are myriad, but global deflation is the big one. With ten year German bunds yielding a paltry 50 basis points, and Japanese bonds paying a paltry 30 basis points, US Treasuries are looking like a bargain.
To this, you can add the greater institutional bond holding requirements of Dodd-Frank, a balancing US budget deficit, a virile US dollar, the commodity price collapse, and an enormous embedded preference for investors to keep buying whatever worked yesterday.
For more depth on the perennial strength of bonds, please click here for ?Ten Reasons Why I?m Wrong on Bonds?.
Bond investors today get an unbelievable bad deal. If they hang on to the longer maturities, they will get back only 80 cents worth of purchasing power at maturity for every dollar they invest.
But institutions and individuals will grudgingly lock in these appalling returns because they believe that the potential losses in any other asset class will be worse. The problem is that driving eighty miles per hour while only looking in the rear view mirror can be hazardous to your financial health.
While much of the current political debate centers around excessive government borrowing, the markets are telling us the exact opposite. A 2%, ten-year yield is proof to me that there is a Treasury bond shortage, and that the government is not borrowing too much money, but not enough.
There is another factor supporting bonds that no one is looking at. The concentration of wealth with the 1% has a side effect of pouring money into bonds and keeping it there. Their goal is asset protection and nothing else.
These people never sell for tax reasons, so the money stays there for generations. It is not recycled into the rest of the economy, as conservative economists insist. As this class controls the bulk of investable assets, this forestalls any real bond market crash, possibly for decades.
So what will 2015 bring us? I think that the erroneous forecast of higher yields I made last year will finally occur this year, and we will start to chip away at the bond market bubble?s granite edifice. I am not looking for a free fall in price and a spike up in rates, just a move to a new higher trading range.
The high and low for ten year paper for the past nine months has been 1.86% to 3.05%. We could ratchet back up to the top end of that range, but not much higher than that. This would enable the inverse Treasury bond bear ETF (TBT) to reverse its dismal 2014 performance, taking it from $46 back up to $76.
You might have to wait for your grandchildren to start trading before we see a return of 12% Treasuries, last seen in the early eighties. I probably won?t live that long.
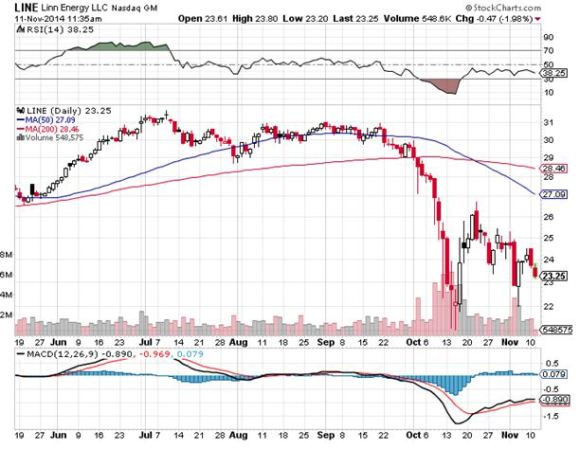
Reaching for yield will continue to be a popular strategy among many investors, which is typical at market tops. That focuses buying on junk bonds (JNK) and (HYG), REITS (HCP), and master limited partnerships (KMP), (LINE).
There is also emerging market sovereign debt to consider (PCY). At least there, you have the tailwinds of long term strong economies, little outstanding debt, appreciating currencies, and higher interest rates than those found at home. This asset class was hammered last year, so we are now facing a rare entry point. However, keep in mind, that if you reach too far, your fingers get chopped off.
There is a good case for sticking with munis. No matter what anyone says, taxes are going up, and when they do, this will increase tax free muni values. So if you hate paying taxes, go ahead and buy this exempt paper, but only with the expectation of holding it to maturity. Liquidity could get pretty thin along the way, and mark to markets could be shocking. Be sure to consult with a local financial advisor to max out the state, county, and city tax benefits.
There are only three things you need to know about trading foreign currencies in 2015: the dollar, the dollar, and the dollar. The decade long bull market in the greenback continues.
The chip shot here is still to play the Japanese yen from the short side. Japan?s Ministry of Finance is now, far and away, the most ambitious central bank hell bent on crushing the yen to rescue its dying economy.
The problems in the Land of the Rising Sun are almost too numerous to count: the world?s highest debt to GDP ratio, a horrific demographic problem, flagging export competitiveness against neighboring China and South Korea, and the world?s lowest developed country economic growth rate.
The dramatic sell off we saw in the Japanese currency since December, 2012 is the beginning of what I believe will be a multi decade, move down. Look for ?125 to the dollar sometime in 2015, and ?150 further down the road. I have many friends in Japan looking for and overshoot to ?200. Take every 3% pullback in the greenback as a gift to sell again.
With the US having the world?s strongest major economy, its central bank is, therefore, most likely to raise interest rates first. That translates into a strong dollar, as interest rate differentials are far and away the biggest decider of the direction in currencies. So the dollar will remain strong against the Australian and Canadian dollars as well.
The Euro looks almost as bad. While European Central Bank president, Mario Draghi, has talked a lot about monetary easing, he now appears on the verge of taking decisive action.
Recurring financial crisis on the continent is forcing him into a massive round of Fed style quantitative easing through the buying of bonds issued by countless European entities. The eventual goal is to push the Euro down to parity with the buck and beyond.
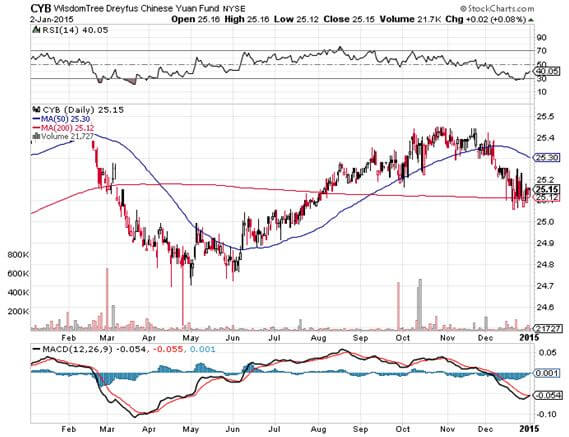
For a sleeper, use the next plunge in emerging markets to buy the Chinese Yuan ETF (CYB) for your back book, but don?t expect more than single digit returns. The Middle Kingdom will move heaven and earth in order to keep its appreciation modest to maintain their crucial export competitiveness.
There isn?t a strategist out there not giving thanks for not loading up on commodities in 2014, the preeminent investment disaster of 2015. Those who did are now looking for jobs on Craig?s List.
2014 was the year that overwhelming supply met flagging demand, both in Europe and Asia. Blame China, the big swing factor in the global commodity.
The Middle Kingdom is currently changing drivers of its economy, from foreign exports to domestic consumption. This will be a multi decade process, and they have $4 trillion in reserves to finance it.
It will still demand prodigious amounts of imported commodities, especially, oil, copper, iron ore, and coal, all of which we sell. But not as much as in the past. The derivative equity plays here, Freeport McMoRan (FCX) and Companhia Vale do Rio Doce (VALE), have all taken an absolute pasting.
The food commodities were certainly the asset class to forget about in 2014, as perfect weather conditions and over planting produced record crops for the second year in a row, demolishing prices. The associated equity plays took the swan dive with them.
However, the ags are still a tremendous long term Malthusian play. The harsh reality here is that the world is making people faster than the food to feed them, the global population jumping from 7 billion to 9 billion by 2050.
Half of that increase comes in countries unable to feed themselves today, largely in the Middle East. The idea here is to use any substantial weakness, as we are seeing now, to build long positions that will double again if global warming returns in the summer, or if the Chinese get hungry.
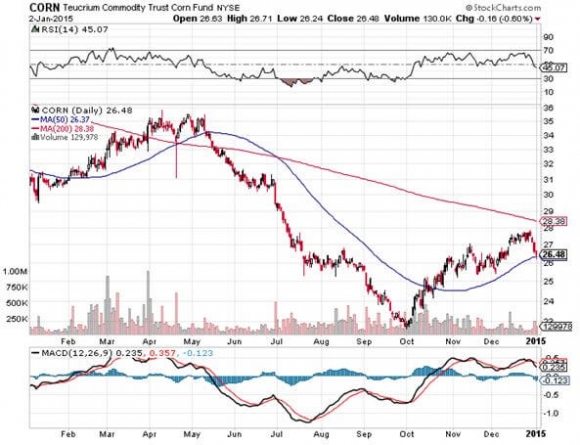
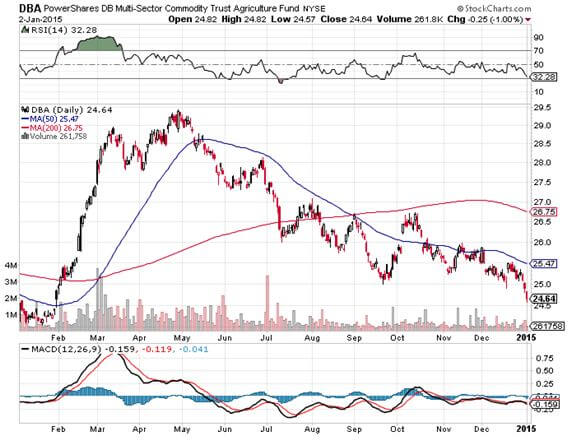
The easy entry points here are with the corn (CORN), wheat (WEAT), and soybeans (SOYB) ETF?s. You can also play through (MOO) and (DBA), and the stocks Mosaic (MOS), Monsanto (MON), Potash (POT), and Agrium (AGU).
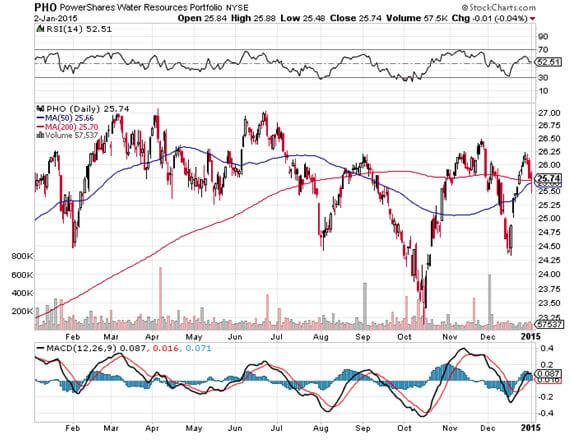
The grain ETF (JJG) is another handy fund. Though an unconventional commodity play, the impending shortage of water will make the energy crisis look like a cakewalk. You can participate in this most liquid of assets with the ETF?s (PHO) and (FIW).
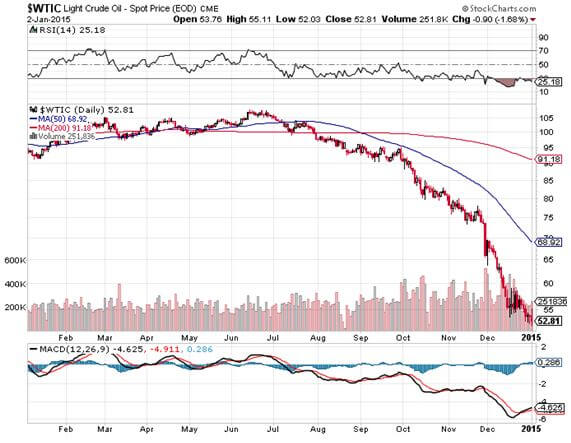
Yikes! What a disaster! Energy in 2014 suffered price drops of biblical proportions. Oil lost the $30 risk premium it has enjoyed for the last ten years. Natural gas got hammered. Coal disappeared down a black hole.
Energy prices did this in the face of an American economy that is absolutely rampaging, its largest consumer. Our train has moved over to a siding to permit a freight train to pass, as it has priority on the Amtrak system. Three Burlington Northern engines are heaving to pull over 100 black, brand new tank cars, each carrying 30,000 gallons of oil from the fracking fields in North Dakota.
There is another tank car train right behind it. No wonder Warren Buffett tap dances to work every day, as he owns the road. US Steel (X) also does the two-step, since they provide immense amounts of steel to build these massive cars.
The US energy boom sparked by fracking will be the biggest factor altering the American economic landscape for the next two decades. It will flip us from a net energy importer to an exporter within two years, allowing a faster than expected reduction in military spending in the Middle East.
Cheaper energy will bestow new found competitiveness on US companies that will enable them to claw back millions of jobs from China in dozens of industries. This will end our structural unemployment faster than demographic realities would otherwise permit.
We have a major new factor this year in considering the price of energy. Peace in the Middle East, especially with Iran, always threatened to chop $30 off the price of Texas tea. But it was a pie-in-the-sky hope. Now there are active negotiations underway in Geneva for Iran to curtail or end its nuclear program. This could be one of the black swans of 2015, and would be hugely positive for risk assets everywhere.
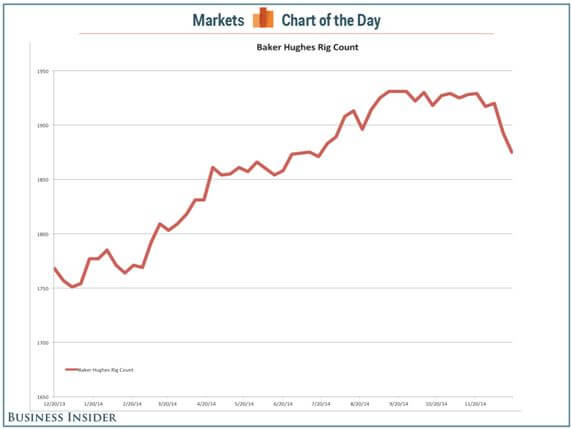
Enjoy cheap oil while it lasts because it won?t last forever. American rig counts are already falling off a cliff and will eventually engineer a price recovery.
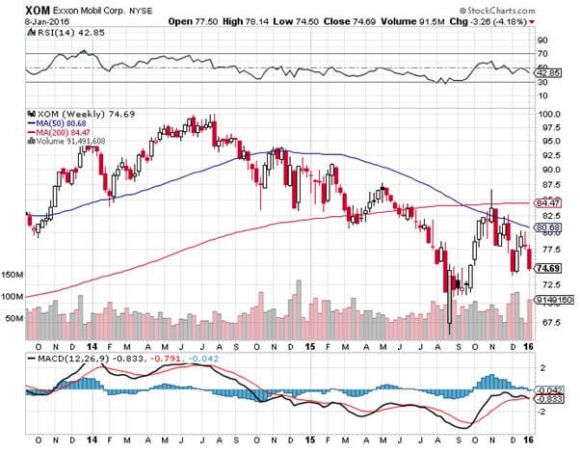
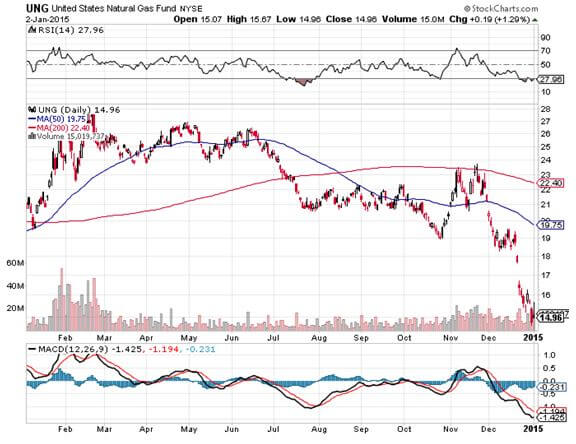
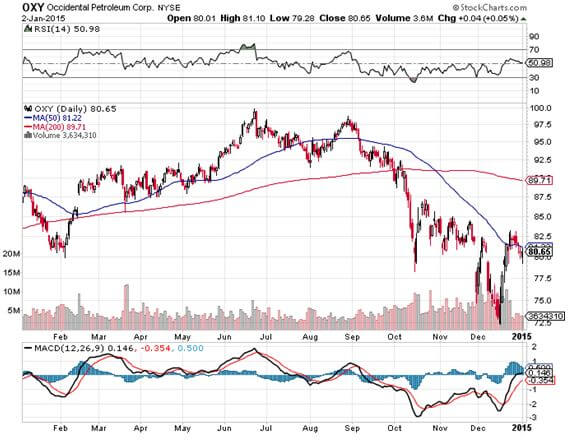
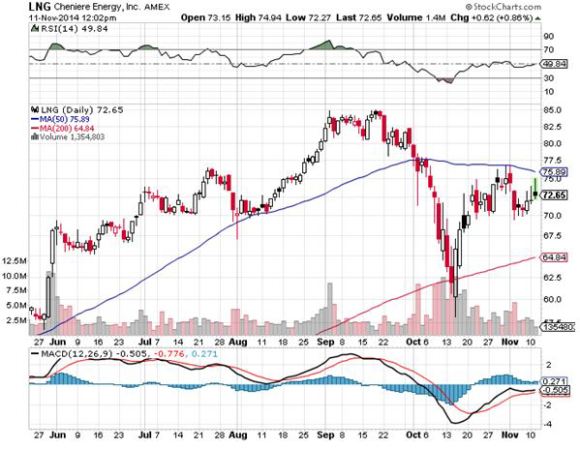
Add the energies of oil (DIG), Cheniere Energy (LNG), the energy sector ETF (XLE), Conoco Phillips (COP), and Occidental Petroleum (OXY). Skip natural gas (UNG) price plays and only go after volume plays, because the discovery of a new 100-year supply from ?fracking? and horizontal drilling in shale formations is going to overhang this subsector for a very long time.
It is a basic law of economics that cheaper prices bring greater demand and growing volumes, which have to be transported. However, major reforms are required in Washington before use of this molecule goes mainstream.
These could be your big trades of 2015, but expect to endure some pain first.
The train has added extra engines at Denver, so now we may begin the long laboring climb up the Eastern slope of the Rocky Mountains.
On a steep curve, we pass along an antiquated freight train of hopper cars filled with large boulders. The porter tells me this train is welded to the tracks to create a windbreak. Once, a gust howled out of the pass so swiftly that it blew a train over on to its side.
In the snow filled canyons we sight a family of three moose, a huge herd of elk, and another group of wild mustangs. The engineer informs us that a rare bald eagle is flying along the left side of the train. It?s a good omen for the coming year. We also see countless abandoned gold mines and the broken down wooden trestles leading to them, so it is timely here to speak about precious metals.
As long as the world is clamoring for paper assets like stocks and bonds, gold is just another shiny rock. After all, who needs an insurance policy if you are going to live forever?
We have already broken $1,200 once, and a test of $1,000 seems in the cards before a turnaround ensues. There are more hedge fund redemptions and stop losses to go. The bear case has the barbarous relic plunging all the way down to $700.
But the long-term bull case is still there. Someday, we are going to have to pay the piper for the $4.5 trillion expansion in the Fed?s balance sheet over the past five years, and inflation will return. Gold is not dead; it is just resting. I believe that the monetary expansion arguments to buy gold prompted by massive quantitative easing are still valid.
If you forgot to buy gold at $35, $300, or $800, another entry point is setting up for those who, so far, have missed the gravy train. The precious metals have to work off a severely, decade old overbought condition before we make substantial new highs. Remember, this is the asset class that takes the escalator up and the elevator down, and sometimes the window.
If the institutional world devotes just 5% of their assets to a weighting in gold, and an emerging market central bank bidding war for gold reserves continues, it has to fly to at least $2,300, the inflation adjusted all-time high, or more.
This is why emerging market central banks step in as large buyers every time we probe lower prices. For me, that pegs the range for 2015 at $1,000-$1,400. ETF players can look at the 1X (GLD) or the 2X leveraged gold (DGP).
I would also be using the next bout of weakness to pick up the high beta, more volatile precious metal, silver (SLV), which I think could hit $50 once more, and eventually $100.
What will be the metals to own in 2015? Palladium (PALL) and platinum (PPLT), which have their own auto related long term fundamentals working on their behalf, would be something to consider on a dip. With US auto production at 17 million units a year and climbing, up from a 9 million low in 2009, any inventory problems will easily get sorted out.
Would You Believe This is a Blue State?
8) Real Estate (ITB)
The majestic snow covered Rocky Mountains are behind me. There is now a paucity of scenery, with the endless ocean of sagebrush and salt flats of Northern Nevada outside my window, so there is nothing else to do but write. My apologies to readers in Wells, Elko, Battle Mountain, and Winnemucca, Nevada.
It is a route long traversed by roving banks of Indians, itinerant fur traders, the Pony Express, my own immigrant forebears in wagon trains, the transcontinental railroad, the Lincoln Highway, and finally US Interstate 80.
There is no doubt that there is a long-term recovery in real estate underway. We are probably 8 years into an 18-year run at the next peak in 2024.
But the big money has been made here over the past two years, with some red hot markets, like San Francisco, soaring. If you live within commuting distance of Apple (AAPL), Google (GOOG), or Facebook (FB) headquarters in California, you are looking at multiple offers, bidding wars, and prices at all time highs.
From here on, I expect a slow grind up well into the 2020?s. If you live in the rest of the country, we are talking about small, single digit gains. The consequence of pernicious deflation is that home prices appreciate at a glacial pace. At least, it has stopped going down, which has been great news for the financial industry.
There are only three numbers you need to know in the housing market: there are 80 million baby boomers, 65 million Generation Xer?s who follow them, and 85 million in the generation after that, the Millennials.
The boomers have been unloading dwellings to the Gen Xer?s since prices peaked in 2007. But there are not enough of the latter, and three decades of falling real incomes mean that they only earn a fraction of what their parents made.
If they have prospered, banks won?t lend to them. Brokers used to say that their market was all about ?location, location, location?. Now it is ?financing, financing, financing?. Banks have gone back to the old standard of only lending money to people who don?t need it.
Consider the coming changes that will affect this market. The home mortgage deduction is unlikely to survive any real attempt to balance the budget. And why should renters be subsidizing homeowners anyway? Nor is the government likely to spend billions keeping Fannie Mae and Freddie Mac alive, which now account for 95% of home mortgages.
That means the home loan market will be privatized, leading to mortgage rates higher than today. It is already bereft of government subsidies, so loans of this size are priced at premiums. This also means that the fixed rate 30-year loan will go the way of the dodo, as banks seek to offload duration risk to consumers. This happened long ago in the rest of the developed world.
There is a happy ending to this story. By 2022 the Millennials will start to kick in as the dominant buyers in the market. Some 85 million Millennials will be chasing the homes of only 65 Gen Xer?s, causing housing shortages and rising prices.
This will happen in the context of a labor shortfall and rising standards of living. Remember too, that by then, the US will not have built any new houses in large numbers in 15 years.
The best-case scenario for residential real estate is that it gradually moves up for another decade, unless you live in Cupertino or Mountain View. We won?t see sustainable double-digit gains in home prices until America returns to the Golden Age in the 2020?s, when it goes hyperbolic.
But expect to put up your first-born child as collateral, and bring your entire extended family in as cosigners if you want to get a bank loan.
That makes a home purchase now particularly attractive for the long term, to live in, and not to speculate with. This is especially true if you lock up today?s giveaway interest rates with a 30 year fixed rate loan. At 3.3% this is less than the long-term inflation rate.
You will boast about it to your grandchildren, as my grandparents once did to me.
Crossing the Bridge to Home Sweet Home
9) Postscript
We have pulled into the station at Truckee in the midst of a howling blizzard.
My loyal staff have made the 20 mile trek from my beachfront estate at Incline Village to welcome me to California with a couple of hot breakfast burritos and a chilled bottle of Dom Perignon Champagne, which has been resting in a nearby snowbank. I am thankfully spared from taking my last meal with Amtrak.
Well, that?s all for now. We?ve just passed the Pacific mothball fleet moored in the Sacramento River Delta and we?re crossing the Benicia Bridge. The pressure increase caused by an 8,200 foot descent from Donner Pass has crushed my water bottle. The Golden Gate Bridge and the soaring spire of the Transamerica Building are just around the next bend across San Francisco Bay.
A storm has blown through, leaving the air crystal clear and the bay as flat as glass. It is time for me to unplug my Macbook Pro and iPhone 6, pick up my various adapters, and pack up.
We arrive in Emeryville 45 minutes early. With any luck, I can squeeze in a ten mile night hike up Grizzly Peak and still get home in time to watch the season opener for Downton Abbey season five. I reach the ridge just in time to catch a spectacular pastel sunset over the Pacific Ocean. The omens are there. It is going to be another good year.
I?ll shoot you a Trade Alert whenever I see a window open on any of the trades above.
Good trading in 2015!
John Thomas The Mad Hedge Fund Trader
The Omens Are Good for 2015!
https://www.madhedgefundtrader.com/wp-content/uploads/2013/01/Zephyr.jpg342451Mad Hedge Fund Traderhttps://madhedgefundtrader.com/wp-content/uploads/2019/05/cropped-mad-hedge-logo-transparent-192x192_f9578834168ba24df3eb53916a12c882.pngMad Hedge Fund Trader2015-01-06 01:02:142015-01-06 01:02:142015 Annual Asset Class Review
Be nice to investors on the way up, because you always meet them again on the way down. This is the harsh reality of those who have placed their money in the fracking space this year.
The hottest sector in the market for the first half of the year, investors have recently fallen on hard times, with the price of oil collapsing from a $107 high in June to under $77 this morning, a haircut of some 28% in just five months.
Prices just seem to be immune to all the good news that is thrown at them, be it ISIL, the Ukraine, or Syria.
It wasn?t supposed to be like that. Using this revolutionary new technology, drillers are in the process of ramping up US domestic oil production from 6 million to 10 million barrels a day.
The implications for the American economy have been extraordinarily positive. It has created a hiring boom in the oil patch states, which has substantially reduced blue-collar unemployment. It has added several points to US GDP growth.
It has also reduced our dependence on energy imports, from a peak of 30 quadrillion Btu?s in 2005 to only 13 quadrillion Btu?s at the end of last year. We are probably shipping in under 10 quadrillion Btu?s right now, a plunge of 66% from the top in only 9 years.
The foreign exchange markets have taken note. Falling imports means sending hundreds of billions of dollars less to hostile sellers abroad. Am I the only one who has noticed that we are funding both sides of all the Middle Eastern conflicts? The upshot has been the igniting of a huge bull market in the US dollar that will continue for decades.
That has justified the withdrawal of US military forces in this volatile part of the world, creating enormous savings in defense spending, rapidly bringing the US Federal budget into balance.
The oil boom has also provided ample fodder for the stock market, with the major indexes tripling off the 2009 bottom. Energy plays, especially those revolving around fracking infrastructure, took the lead.
Readers lapped up my recommendations in the area. Cheniere Energy (LNG) soared from $6 to $85. Linn Energy (LINE) ratcheted up from $7 to $36. Occidental Petroleum moved by leaps and bounds, from $35 to $110.
Is the party now over? Are we to dump our energy holdings in the wake of the recent calamitous falls in prices?
I think not.
One of the purposes of this letter is to assist readers in separating out the wheat from the chaff on the information front, both the kind that bombards us from the media, and the more mundane variety emailed to us by brokers.
When I see the quality of this data, I want to throw up my hands and cry. Pundits speculate that the troubles stem from Saudi Arabia?s desire to put Russia, Iran, the US fracking industry, and all alternative energy projects out of business by pummeling prices.
The only problem is that these experts have never been to Saudi Arabia, Iran, the Barnett Shale, and wouldn?t know which end of a solar panel to face towards the sun. Best case, they are guessing, worst case, they are making it up to fill up airtime. And you want to invest your life savings based on what they are telling you?
I call this bullpuckey.
I have traveled in the Middle East for 46 years. I covered the neighborhood wars for The Economist magazine during the 1970?s.
When representing Morgan Stanley in the firm?s dealings with the Saudi royal family in the 1980?s, I paused to stick my finger in the crack in the Riyadh city gate left by a spear thrown by King Abdul Aziz al Saud when he captured the city in the 1920?s, creating modern Saudi Arabia.
They only mistake I made in my Texas fracking investments is that I sold out too soon in 2005, when natural gas traded at $5 and missed the spike to $17.
So let me tell you about the price of oil.
There are a few tried and true rules about this industry. It is far bigger than you realize. It has taken 150 years to build. Nothing ever happens in a hurry. Any changes here take decades and billions of dollars to implement.
Nobody has ever controlled the market, just chipped away at the margins. Oh, and occasionally the stuff blows up and kills you.
As one time Vladimir Lenin advisor and Occidental Petroleum founder, the late Dr. Armand Hammer, once told me, ?Follow the oil. Everything springs from there.?
China is the big factor that most people are missing. Media coverage has been unremittingly negative. But their energy imports have never stopped rising, whether the economy is up, down, or going nowhere, which in any case are rigged, guessed, or manufactured. The major cities still suffer brownouts in the summer, and the government has ordered offices to limit air conditioning to a sweltering 82 degrees.
Chinese oil demand doubled to 8 million barrels a day from 2000-2010, and will double again in the current decade. This assumes that Chinese standards of living reach only a fraction of our own. Lack of critical infrastructure and storage prevents it from rising faster.
Any fall in American purchases of Middle Eastern oil are immediately offset by new sales to Asia. Some 80% of Persian Gulf oil now goes to Asia, and soon it will be 100%. This is why the Middle Kingdom has suddenly started investing in aircraft carriers.
So, we are not entering a prolonged, never ending collapse in oil prices. Run that theory past senior management at Exxon Mobil (XOM) and Occidental (OXY), as I have done, and you?ll summon a great guffaw.
It will reorganize, restructure, and move into new technologies and markets, as they have already done with fracking. My theory is that they will buy the entire alternative energy industry the second it become sustainably profitable. It certainly has the cash and the management and engineering expertise to do so.
What we are really seeing is the growing up of the fracking industry, from rambunctious teenage years to a more mature young adulthood. This is its first real recession.
For years I have heard complaints of rocketing costs and endless shortages of key supplies and equipment. This setback will shake out over-leveraged marginal players and allow costs to settle back to earth.
Roustabouts who recently made a stratospheric $200,000 a year will go back to earning $70,000. This will all be great for industry profitability.
What all of this means is that we are entering a generational opportunity to get into energy investments of every description. After all, it is the only sector in the market that is now cheap which, unlike coal, has a reasonable opportunity to recover.
Oil will probably hit a low sometime next year. Where is anybody?s guess, so don?t bother asking me. It is unknowable.
When it does, I?ll be shooting out the Trade Alerts as fast as I can write them.
Where to focus? I?ll unfurl the roll call of the usual suspects. They include Occidental Petroleum (OXY), Exxon Mobil (XOM), Devon Energy (DVN), Anadarko Petroleum (APC) Cabot Oil & Gas (COG), and the ProShares 2X Ultra Oil & Gas ETF (DIG).
Fracking investments should be especially immune to the downturn, because their primary product is natural gas, which has not fallen anywhere as much as Texas tea. Oil was always just a byproduct and a bonus.
CH4 was the main show, which has rocketed by an eye popping 29% to $4.57 in the past two weeks, thanks to the return of the polar vortex this winter. We are now close to the highs for the year in natural gas.
The cost of production of domestic US oil runs everywhere from $28 a barrel for older legacy fields, to $100 for recent deep offshore. Many recent developments were brought on-stream around the $70-$80 area. So $76 a barrel is not the end of the world.
On the other hand, natural gas uniformly cost just under $2/Btu, and that number is falling. Producers are currently getting more than double that in the market.
And while on the subject of this simple molecule, don?t let ground water pollution ever both you. It does happen, but it?s an easy fix.
Of the 50 cases of pollution investigated by MIT, most were found to be the result of subcontractor incompetence, natural causes, or pollution that occurred 50 or more years ago. Properly regulated, it shouldn?t be happening at all.
When I fracked in the Barnett Shale 15 years ago, we used greywater, or runoff from irrigation, to accelerate our underground expositions. The industry has since gotten fancy, bringing in highly toxic chemicals like Guar Gum, Petroleum Distillates, Triethanolamine Zirconate, and Potassium Metaborate.
However, the marginal production gains of using these new additives are not worth the environmental risk. Scale back on the most toxic chemicals and go back to groundwater, and the environmental, as well as the political opposition melts away.
By the way, can any readers tell me if my favorite restaurant in Kuwait, the ship Al Boom, is still in business? The lamb kabob there was to die for.
Don?t Throw Out the Baby with the Bathwater
https://www.madhedgefundtrader.com/wp-content/uploads/2014/11/Fracking.jpg325362Mad Hedge Fund Traderhttps://madhedgefundtrader.com/wp-content/uploads/2019/05/cropped-mad-hedge-logo-transparent-192x192_f9578834168ba24df3eb53916a12c882.pngMad Hedge Fund Trader2014-11-12 10:03:382014-11-12 10:03:38Why Fracking Will Make Your 2015 Performance
With the International Energy Agency cutting global consumption by 200,000 barrels a day in 2014 and 300,000 barrels a day in 2015, all eyes were on the oil market today. I had to slap myself when I saw the $81 handle for West Texas intermediate, it had gotten so cheap so fast.
Virtually every stock market analyst has been puzzled by the seeming immunity of stock markets to the good news of collapsing oil prices (USO), (DIG), (DUG) this year.
In fact, stocks and crude have been tracking almost one to one on the downside. The charts below, sent by a friend at JP Morgan, go a long way towards explaining this apparent dichotomy.
The first shows the number of barrels of oil needed to generate a unit of GDP, which has been steady declining for 30 years. The second reveals the percentage of hourly earnings required to buy a gallon of gasoline in the US, which has been mostly flat for three decades, although it has recently started to spike upwards.
The bottom line is that conservation, the roll out of more fuel-efficient vehicles and hybrids, and the growth of alternatives, are all having their desired effect.
Notice how small all the new cars on the road are these days, many of which get 40 mpg with conventional gasoline engines. As for my own household, it has gone all-electric.
Developed countries are getting six times more GDP growth per unit of oil than in the past, while emerging economies are getting a fourfold improvement.
The world is gradually weaning itself off of the oil economy. But the operative word here is ?gradually?, and it will probably take another two decades before we can bid farewell to Texas tea, at least for transportation purposes.
It took 150 years for America to build its oil infrastructure. Don?t expect it to disappear in 10 or 20 years. Those outside the oil industry are totally unaware how massive the industry is that has to move around our country?s 18.8 million barrels a day, refine it into usable products, and get it to the end individual, industrial and government consumer.
But the Mileage is Great!
Gasoline? What?s that?
00Mad Hedge Fund Traderhttps://madhedgefundtrader.com/wp-content/uploads/2019/05/cropped-mad-hedge-logo-transparent-192x192_f9578834168ba24df3eb53916a12c882.pngMad Hedge Fund Trader2014-10-15 01:03:582014-10-15 01:03:58Oil Isn't What It Used to Be
Legal Disclaimer
There is a very high degree of risk involved in trading. Past results are not indicative of future returns. MadHedgeFundTrader.com and all individuals affiliated with this site assume no responsibilities for your trading and investment results. The indicators, strategies, columns, articles and all other features are for educational purposes only and should not be construed as investment advice. Information for futures trading observations are obtained from sources believed to be reliable, but we do not warrant its completeness or accuracy, or warrant any results from the use of the information. Your use of the trading observations is entirely at your own risk and it is your sole responsibility to evaluate the accuracy, completeness and usefulness of the information. You must assess the risk of any trade with your broker and make your own independent decisions regarding any securities mentioned herein. Affiliates of MadHedgeFundTrader.com may have a position or effect transactions in the securities described herein (or options thereon) and/or otherwise employ trading strategies that may be consistent or inconsistent with the provided strategies.


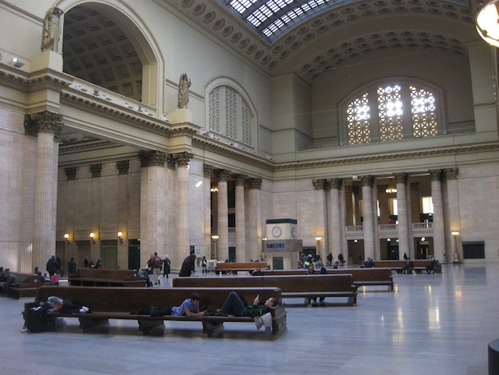


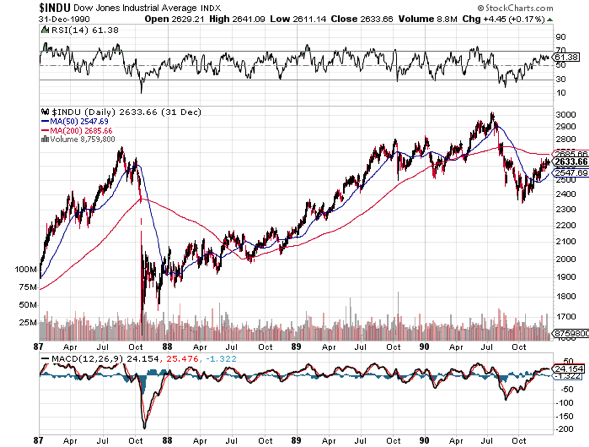 Dow Average 1987-90

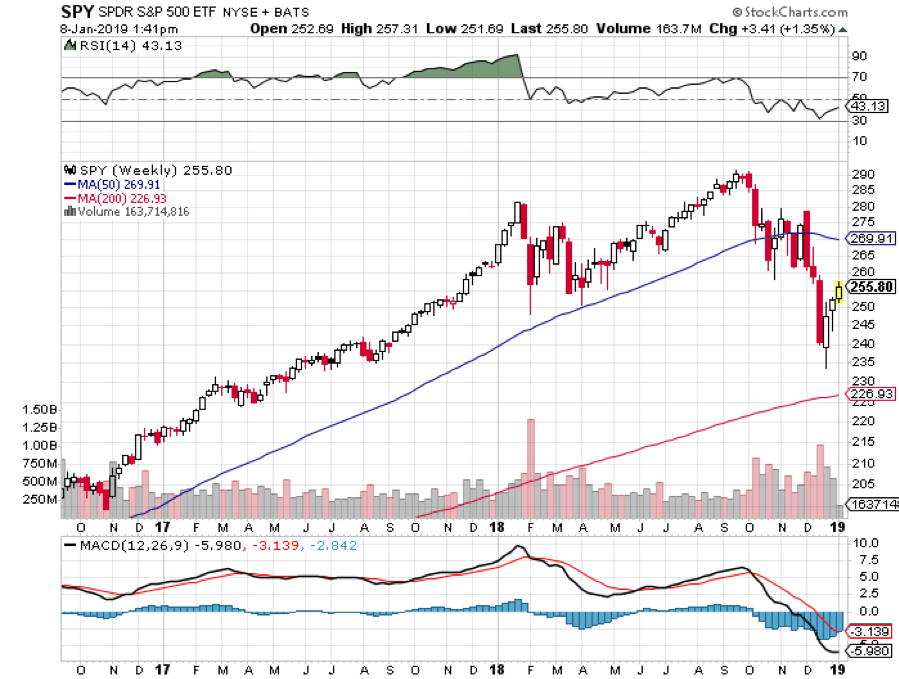
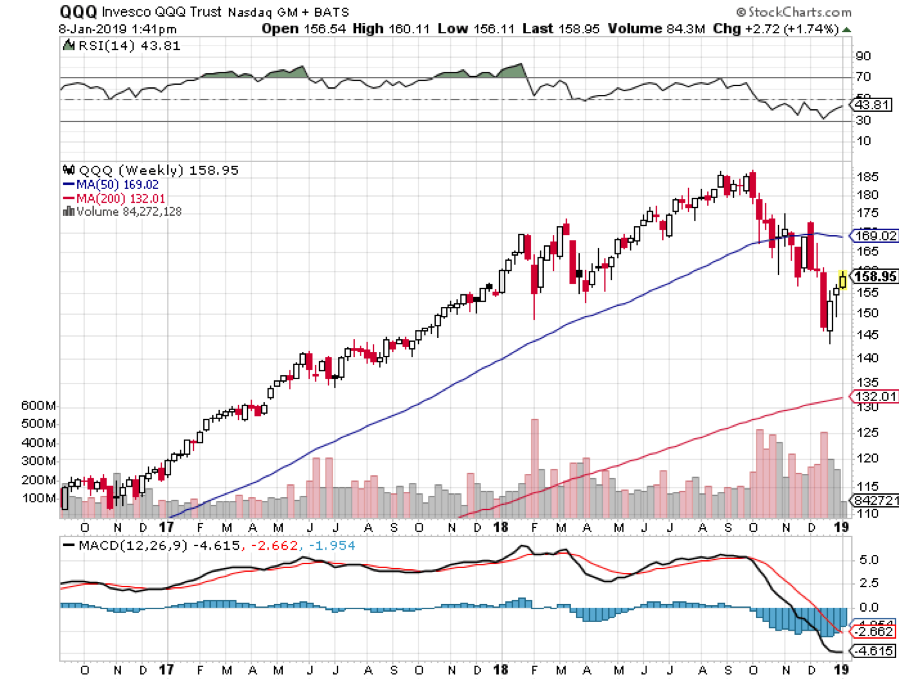
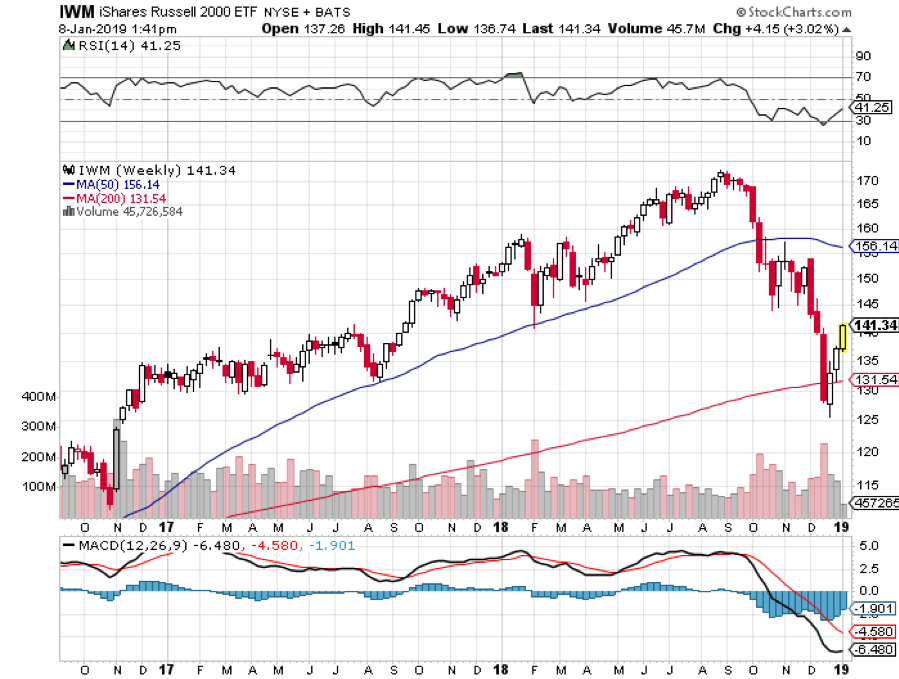
 Frozen Headwaters of the Colorado River
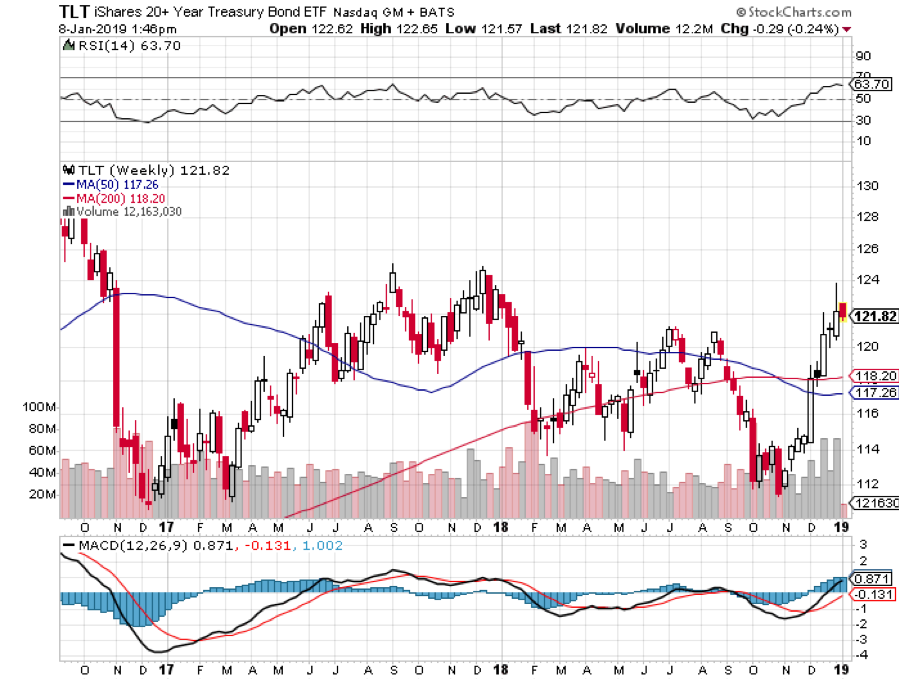
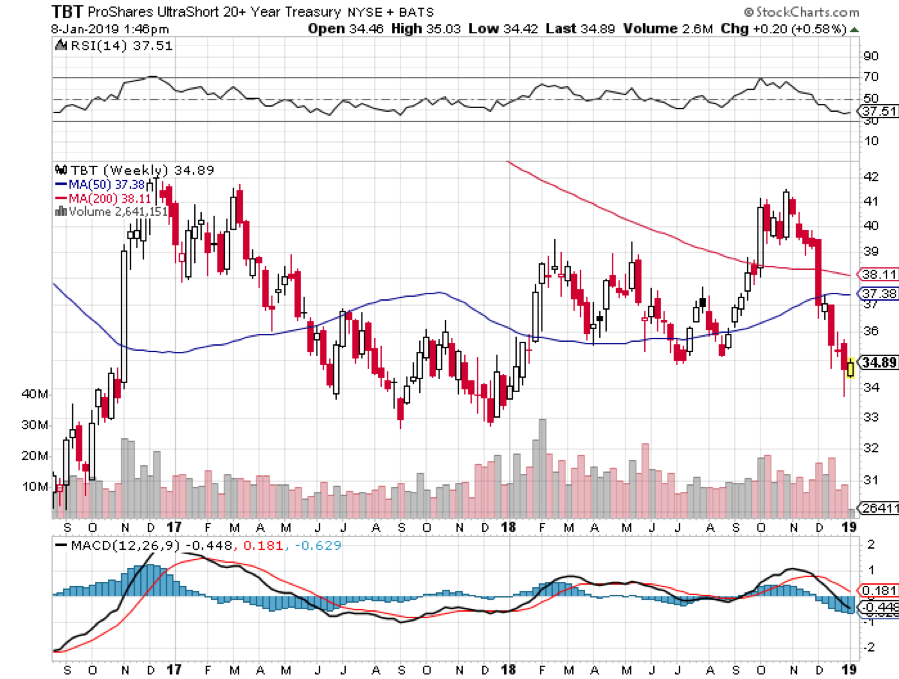
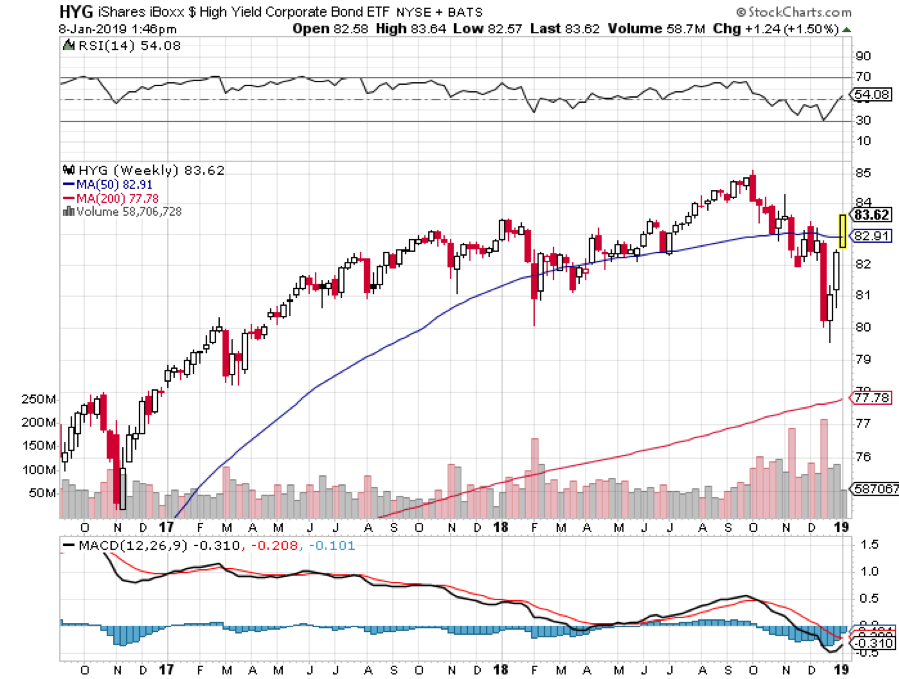

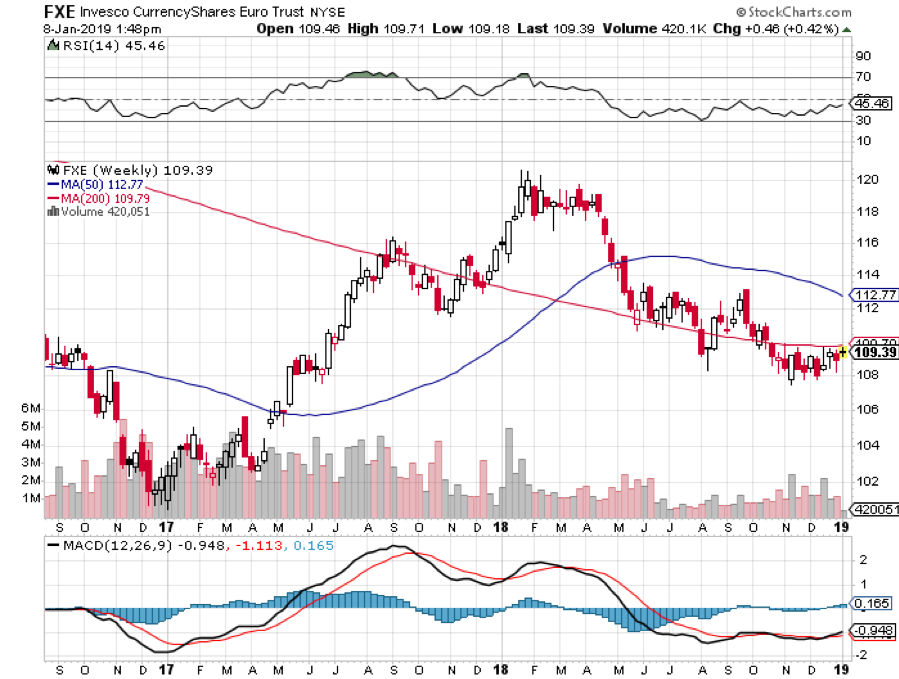
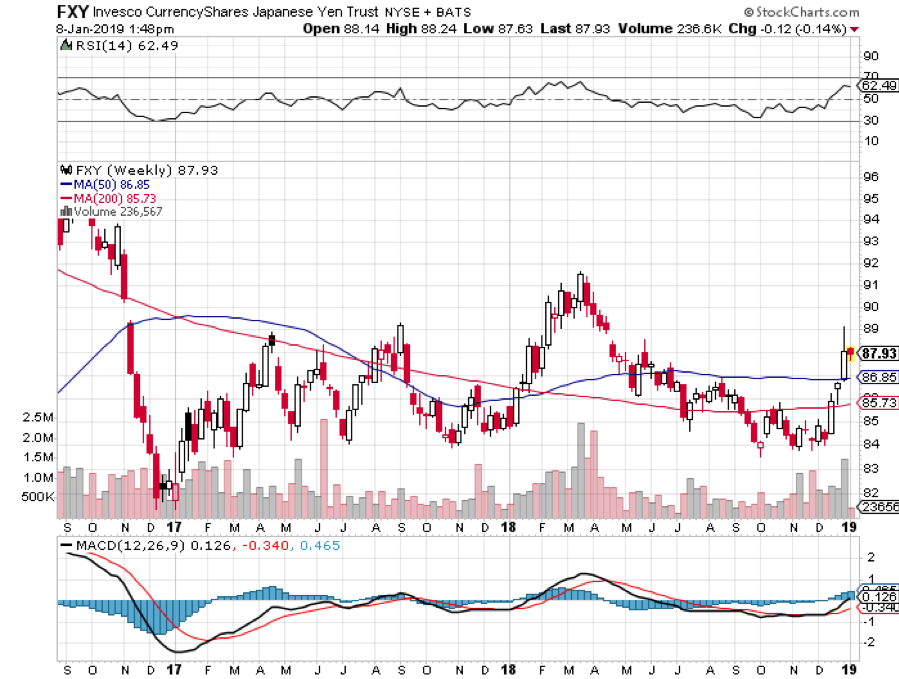
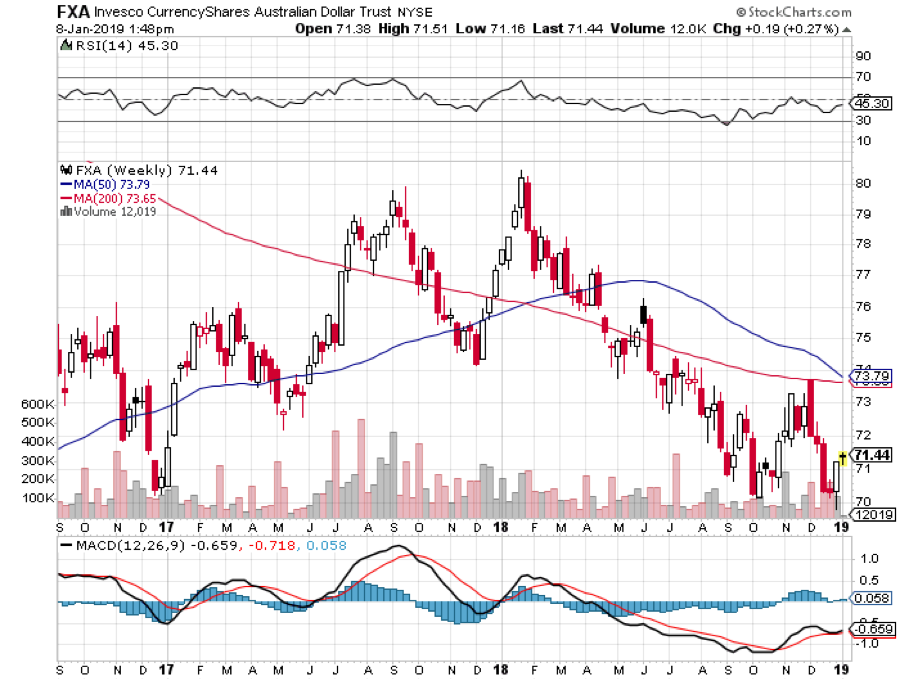

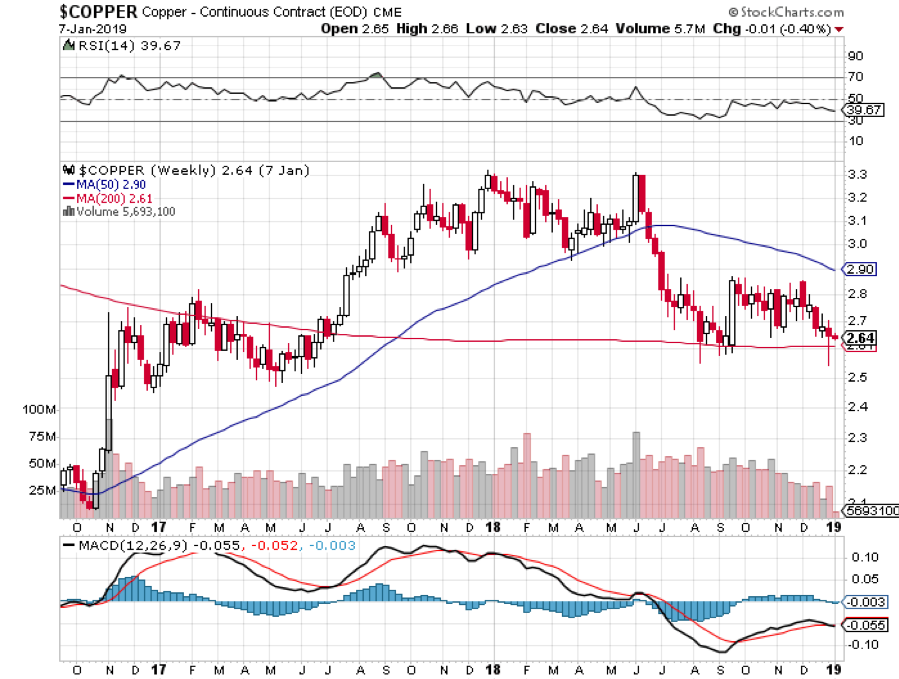
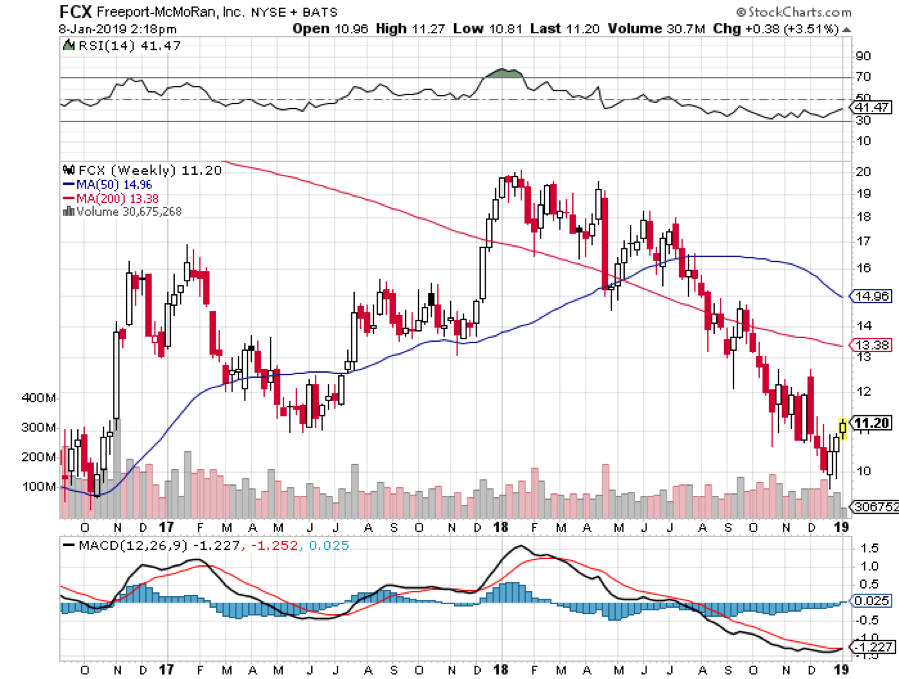

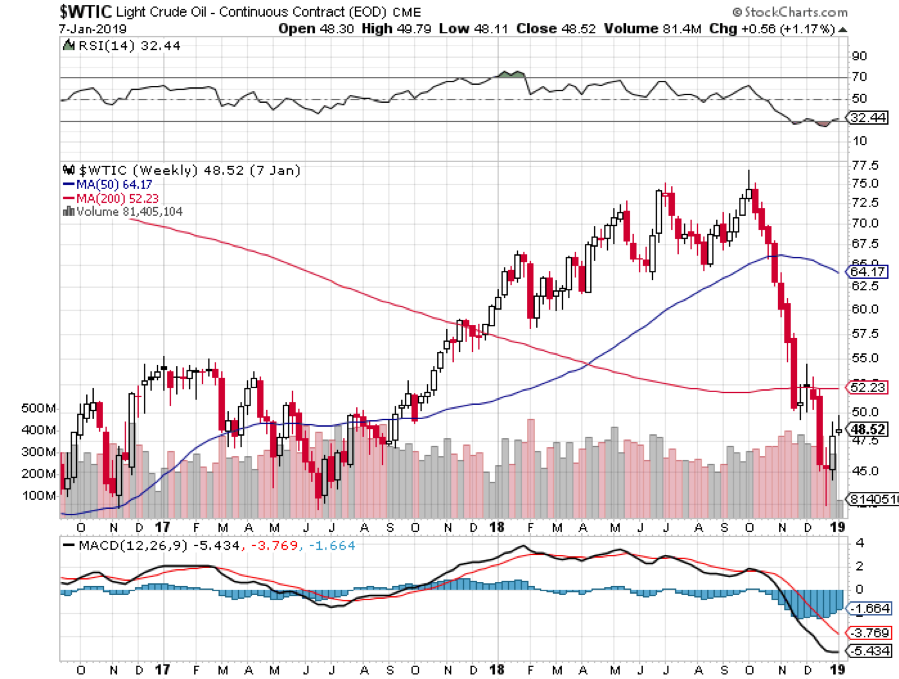
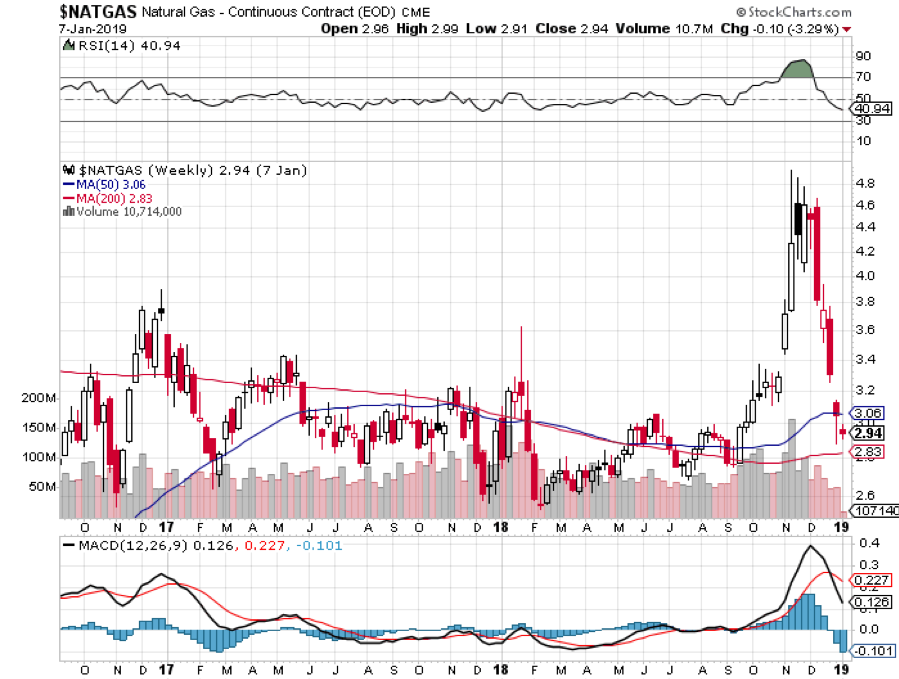
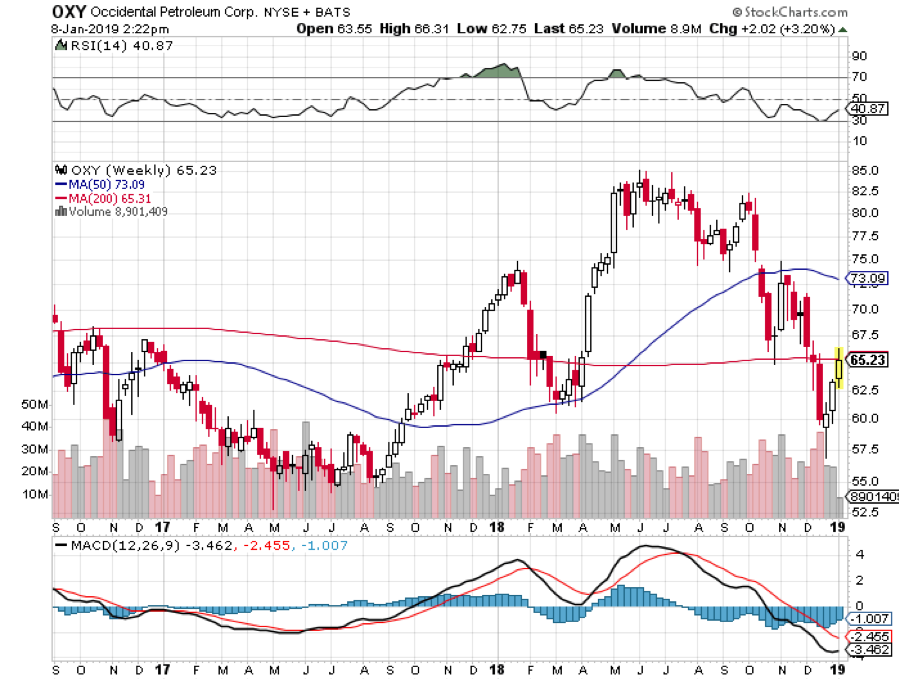
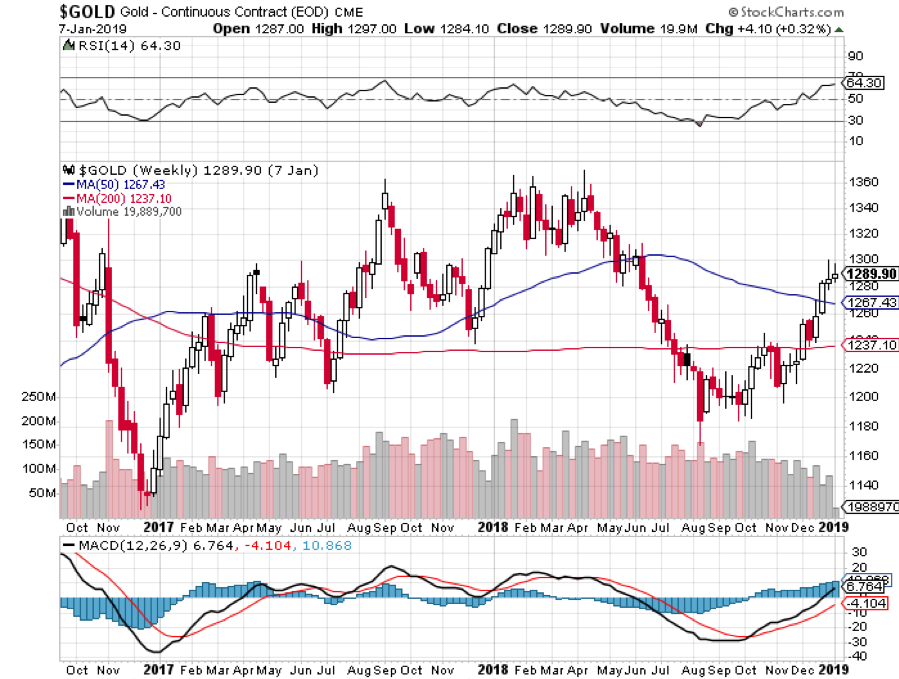
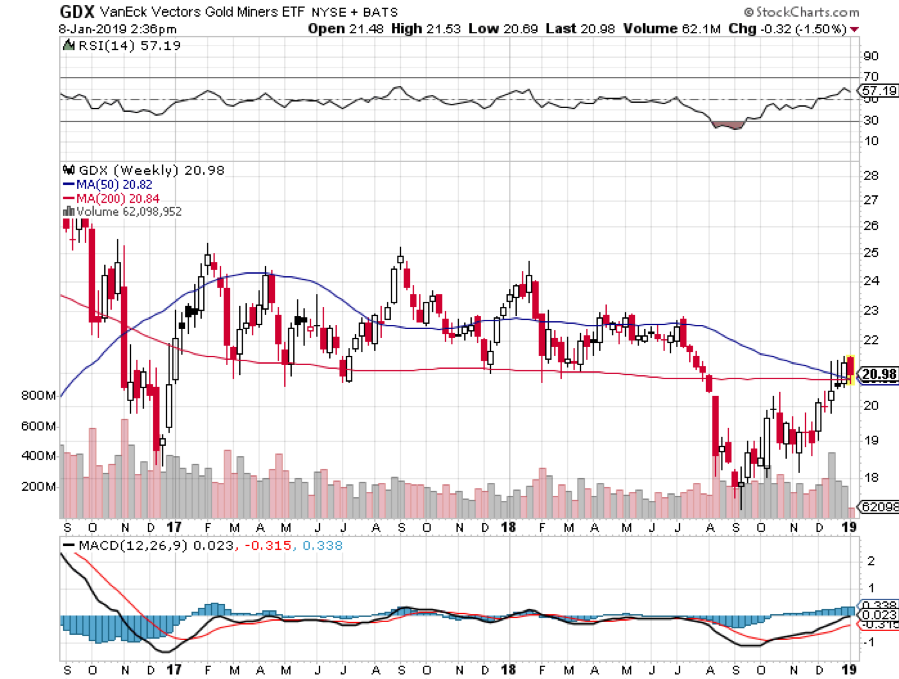
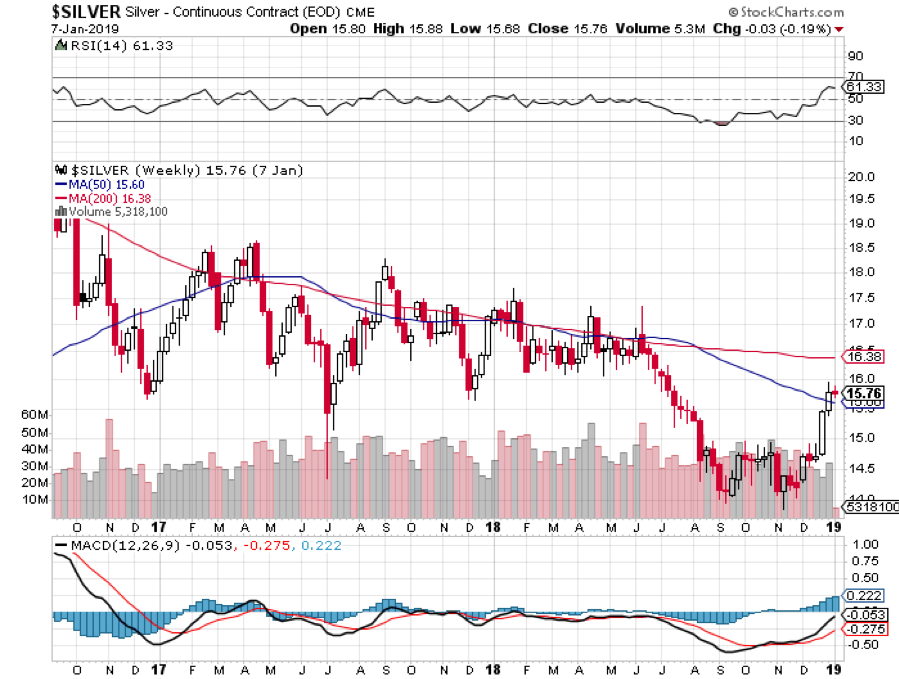
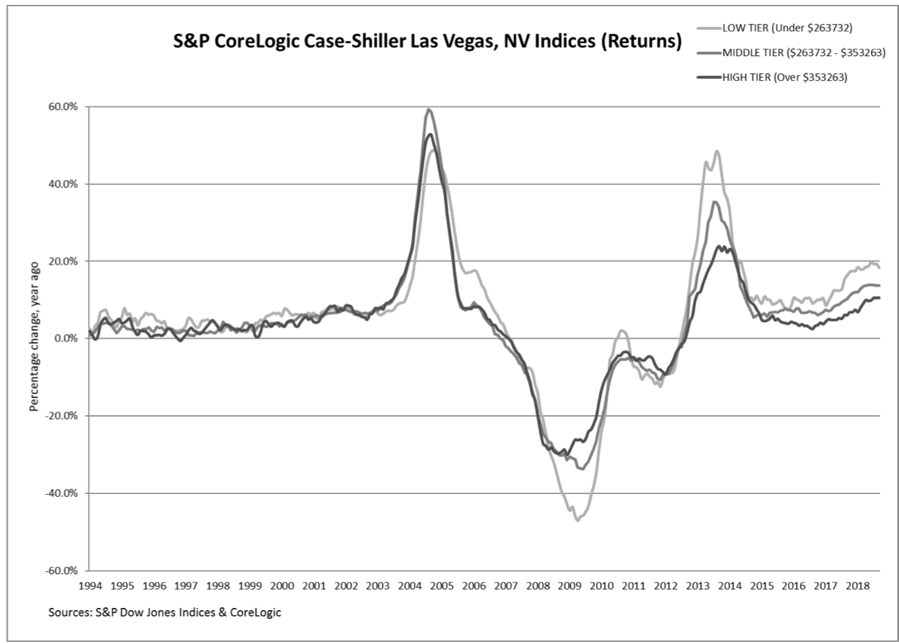
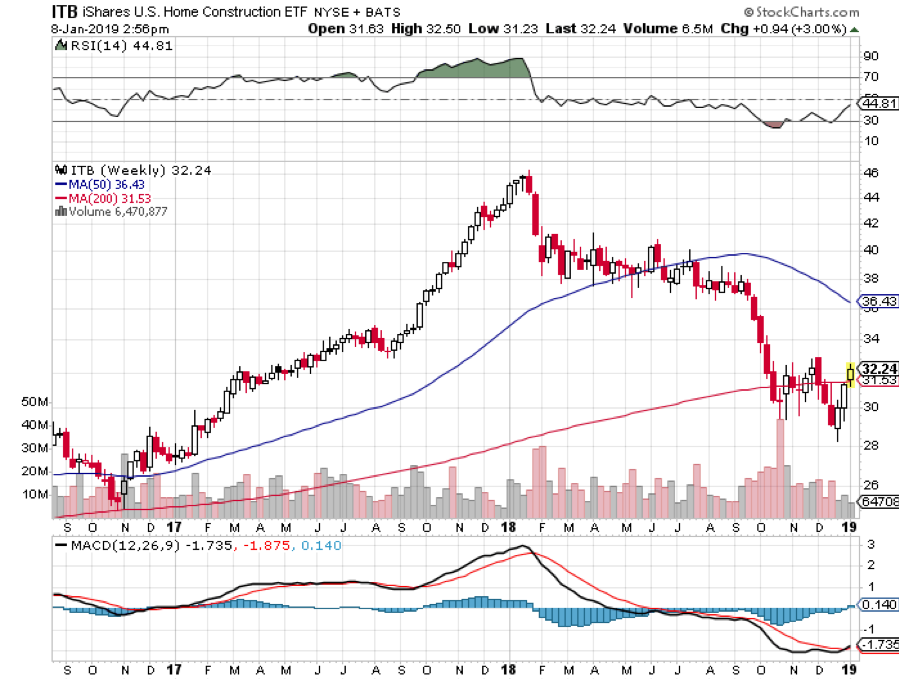
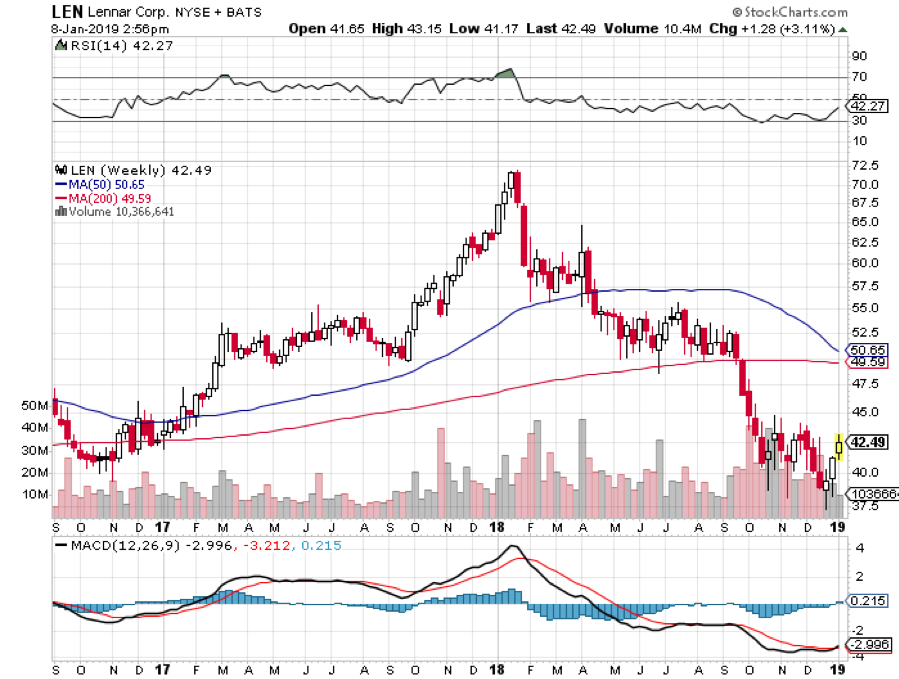
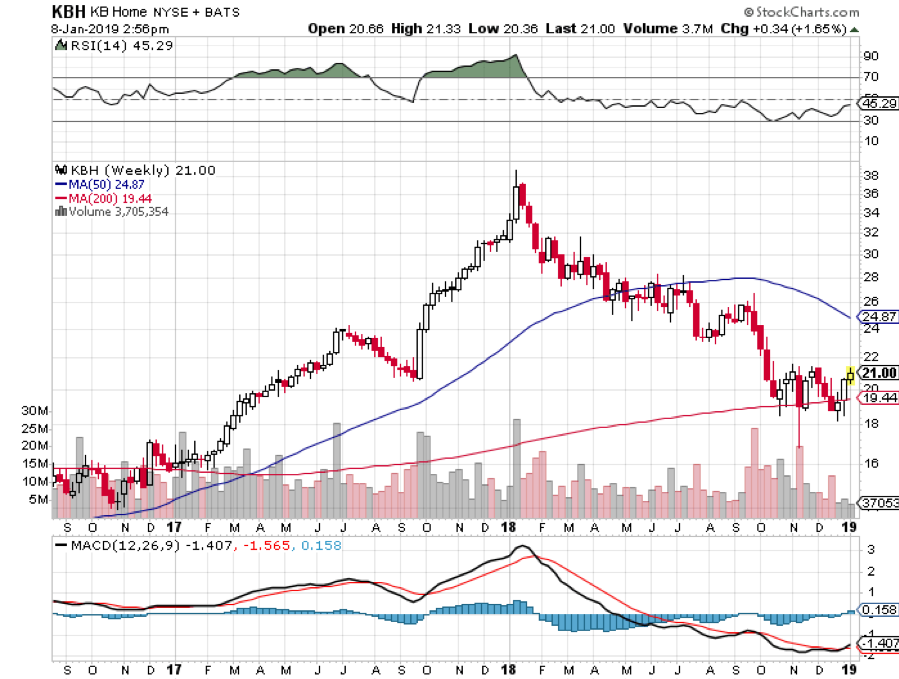
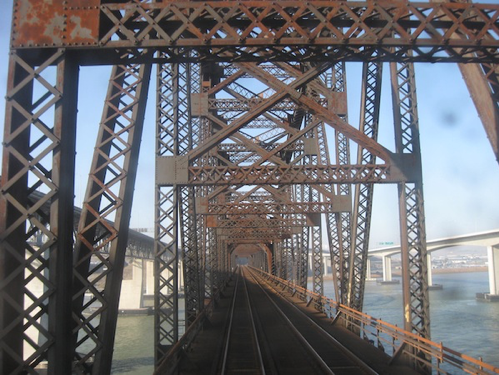 Crossing the Bridge to Home Sweet Home