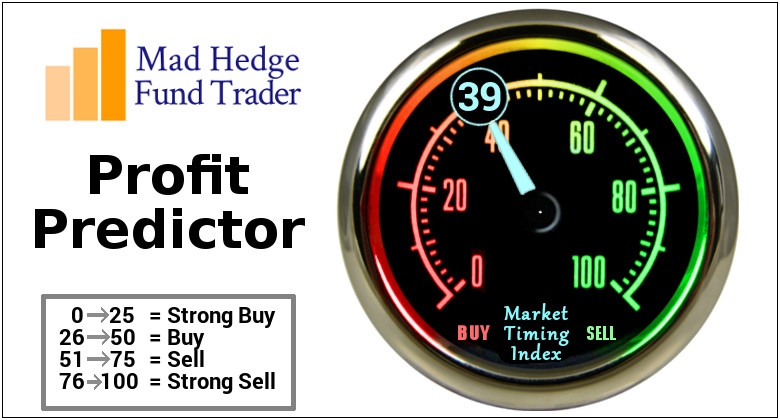
Market’s are gridlocked.
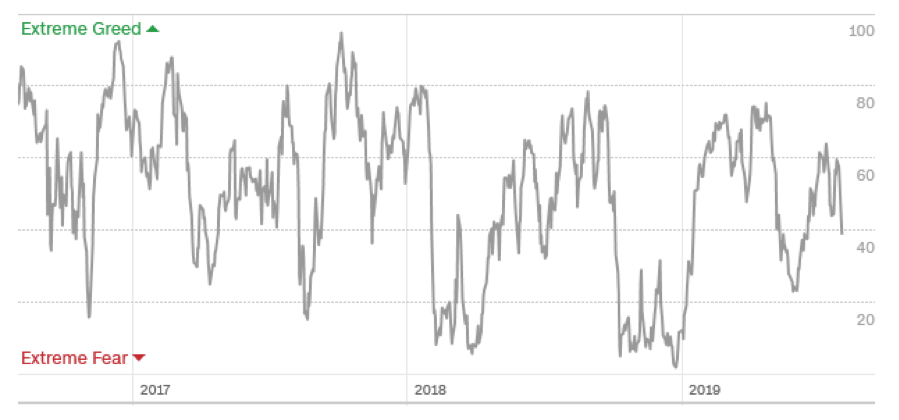
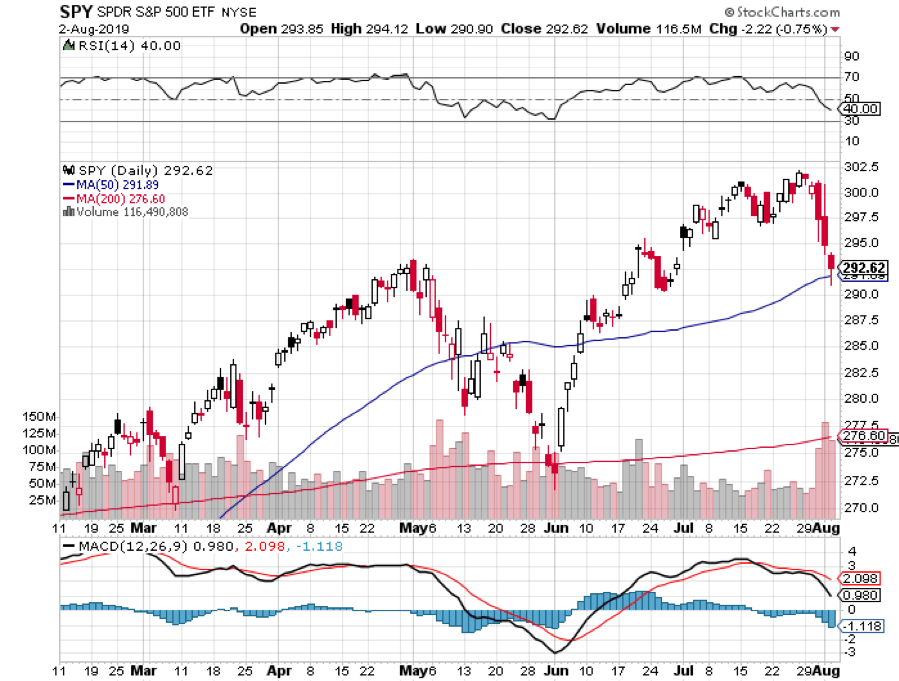
Traders don’t want to chase the market at an all-time high on top of a 2,000-point rally. They don’t want to sell short either since a Tweet could come out at any time triggering a squeeze.
Will the trade war continue for another week or a year?
On top of all that, we have a president who attempts to manipulate the market more than any in history.
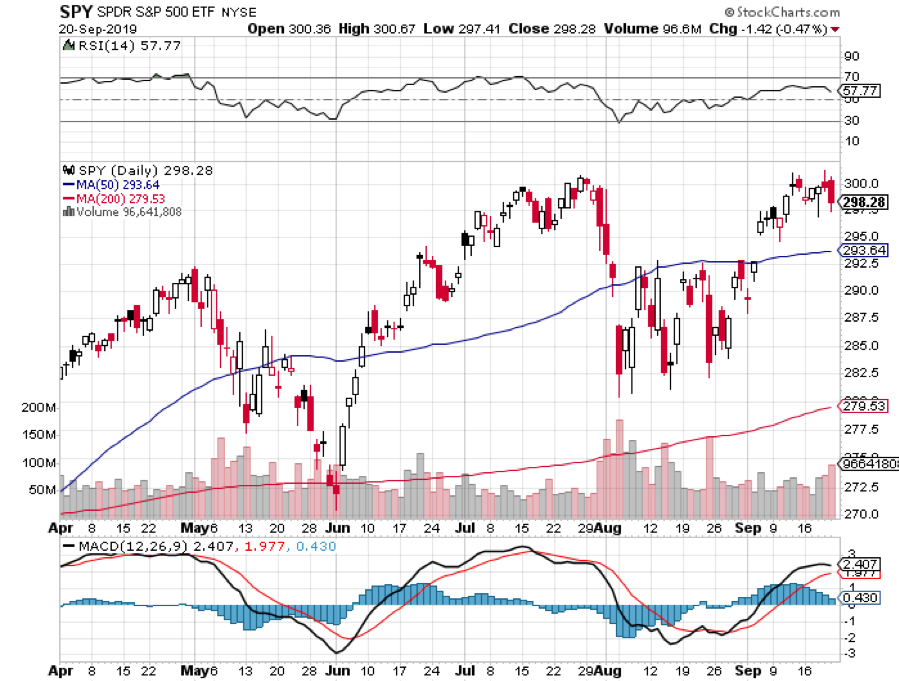
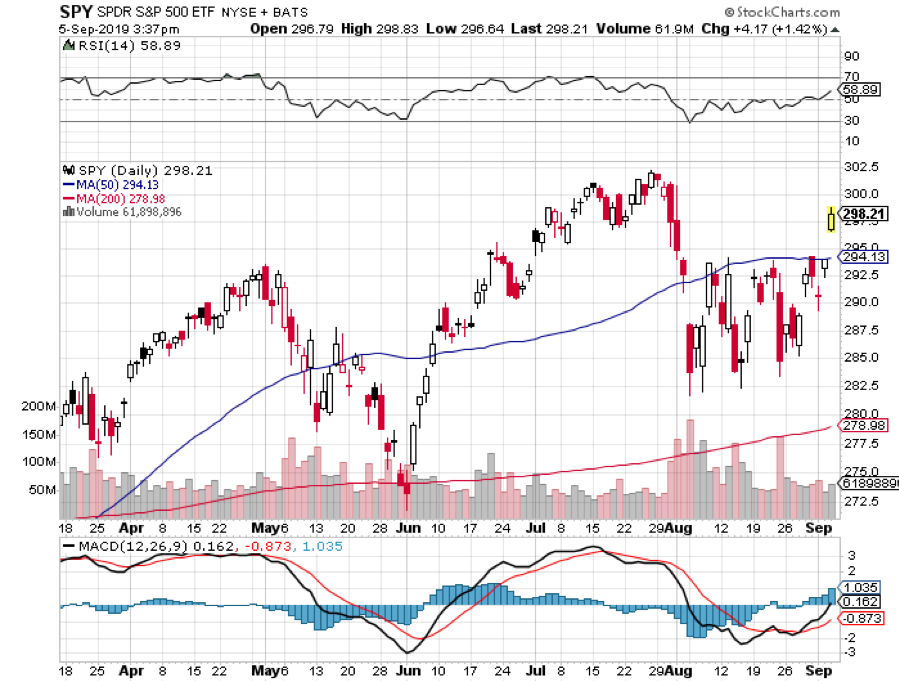
And here is the problem. While the major indexes remain dead unchanged over the past 18 months, earnings have been falling. That has made them more expensive than at any time over the past several years.
And this is in the face of an onslaught of negative economic data that continues to deteriorate by the day, all caused by the trade war.
So, as a result, there is nothing to do here. The market is too high to buy and too low to sell. Clients call me with trade ideas, and I tell them they are reaching. There is nothing worse than reaching for the marginal trade when there is really nothing to do.
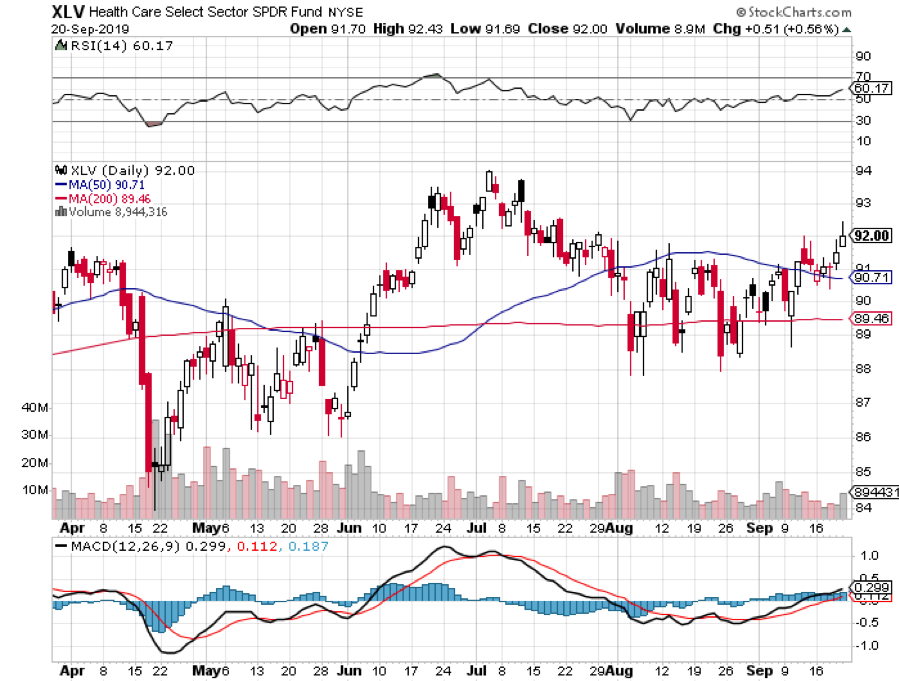
At least I’ll have something to do in the coming week. I’ll be launching the Mad Hedge Biotech and Health Care Letter, the newest addition to our family of research services. In addition to technology, I expect Biotech and Health Care to be one of the top-performing sectors in the coming decade.
I have taken out a full-time researcher in the field who has been grinding out reports for me since January 1. The invitation to the webinar should reach you in a few days where I will explain why keeping up with this sector is so important.
There is no law that says you have to have a trade on every day of the year. Cash is beautiful. Better than that, cash has option value. It’s worth a fortune to have dry powder when markets meltdown or melt-up. You get to catch other investors’ trades when they are puking. That is the best time ever to make money.
When my four technology positions expired at their maximum profit point on Friday, I celebrated. I went down to a bankruptcy sale for an antique store in Berkeley and bought a vintage Champaign magnum bottle for $10.
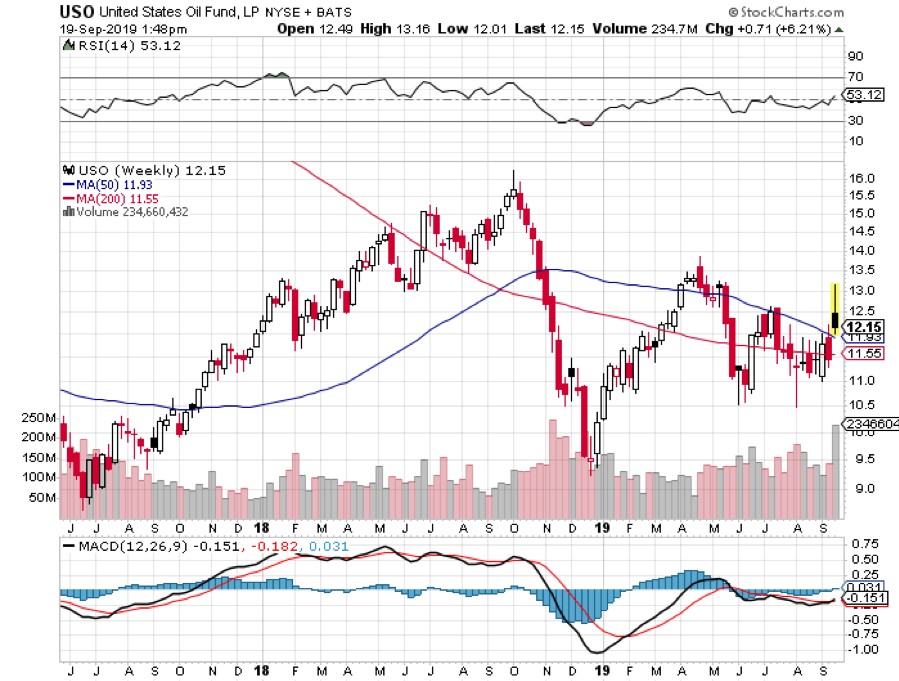
The week was kicked off by mass drone strikes that took out Saudi oil production, axing 6 million barrels a day off the global market. Half of that will be back in a day. Oil prices spike $10, the largest one-day move in history. This is clearly the end result of the US unilaterally pulling out of the US Iran Nuclear Agreement and the economic sanctions that followed, thus inviting retaliation.
General Motors (GM) workers struck, with 48,000 hourly workers hitting the picket lines. The last strike in 1998, also at a market top, lasted for 54 days. Could be this the long-awaited inflationary run-up in wages? Expect many more strikes to come.
China’s economy slowed, with Industrial output up 4.4%, the slowest since 2002. Trade war impacts will keep hitting the economy for months to come. The bad news? Business is not responding to recent stimulus and, with 70% of the country’s oil originating in Saudi Arabia, they now have a bigger headache.
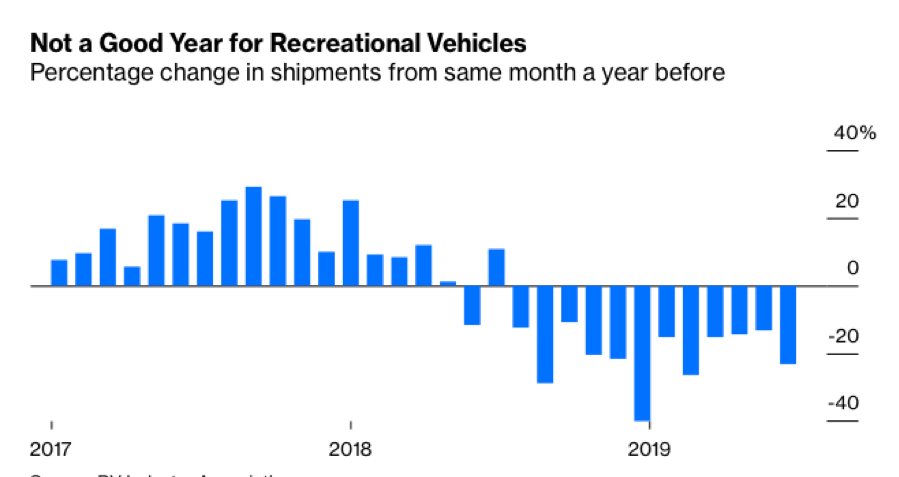
Recreational Vehicle sales are falling off a cliff, down 22% YOY, as consumer cut back discretionary spending. It’s another reliable pre-recession indicator.
Recession fears are the highest in a decade, according to the Bank of America Merrill Lynch fund manager survey. Some 38% of managers are making the bear call versus 34% in August. Only 7% of managers expect value to outperform growth over the next 12 months.
Some 53% of CFOs think we’ll be in a recession in a year, and 67% by end 2020. These are the highest pessimism numbers in a decade. Germany already in recession is the largest concern, followed by a slowing China. It’s all linked. We are all one global economy, like it or not.
Philly Fed plunged, from 16.8 to 12.0, indicating fading business confidence. The trade war universally gets the blame. Notice how nervous everyone is getting.
Apple got tagged with a $14 billion fine in another “not invented here” penalty issued by the Irish government. It’s another attack on American big tech. Apple says they followed Irish tax law to the letter.
The Fed cut a quarter but talks down future rate hikes. Buy the rumor, sell the news. Probably no rate cut for October, so December is the next time we get a swing at the piñata. This will have zero effect on the economy, but further punishes savers.
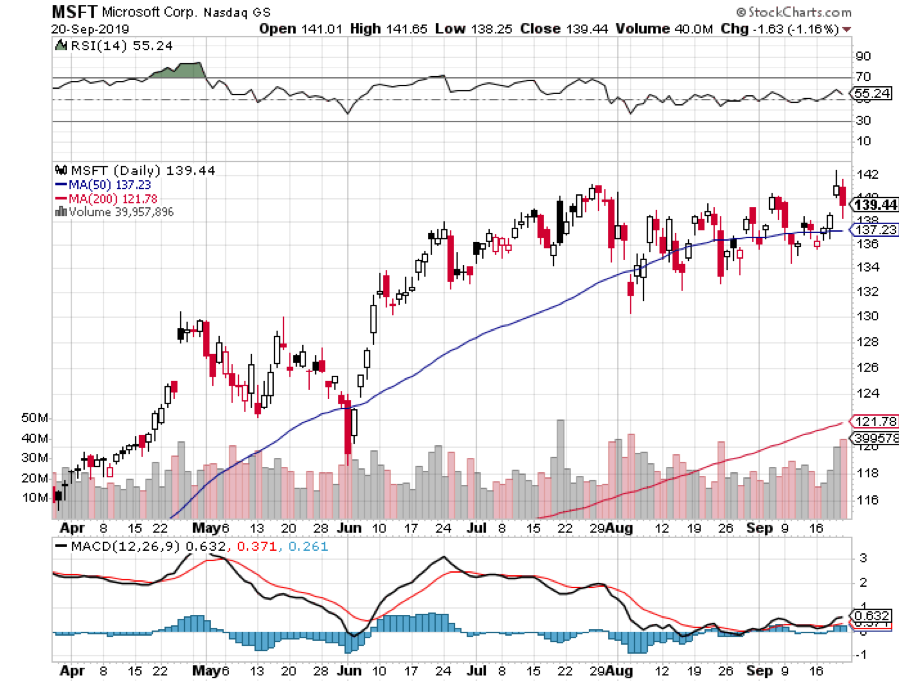
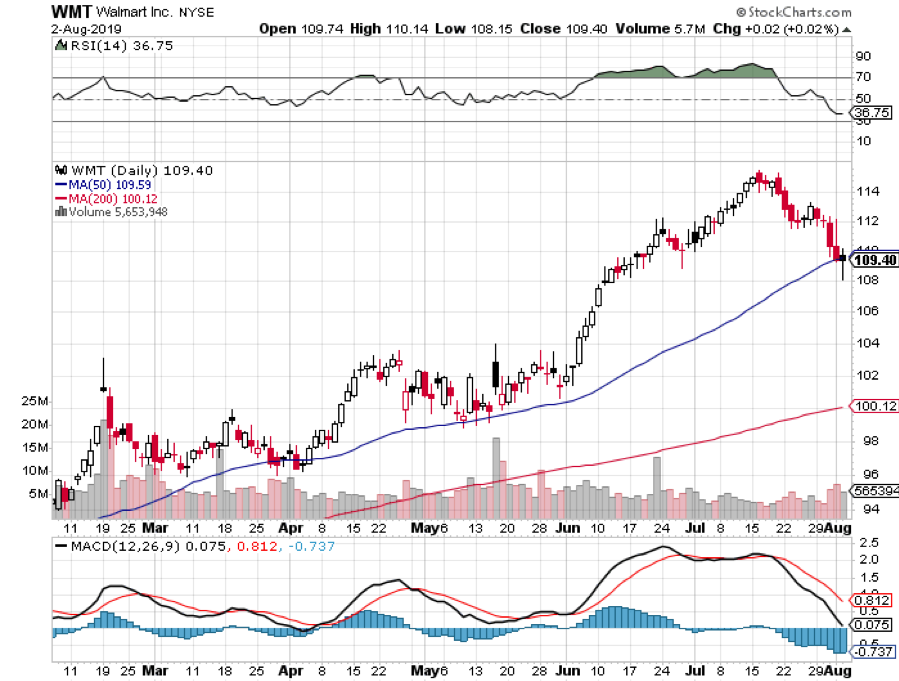
Microsoft (MSFT) announced a $40 billion share buyback and raises its dividend by 11%. It’s a huge positive for the company and the market in general. I’ll try to buy the Thursday opening if it doesn’t open up at a stupid price. Buy Seattle real estate….and more Microsoft. Bill Gates’ creation has bought back 25% of its shares over the past decade.
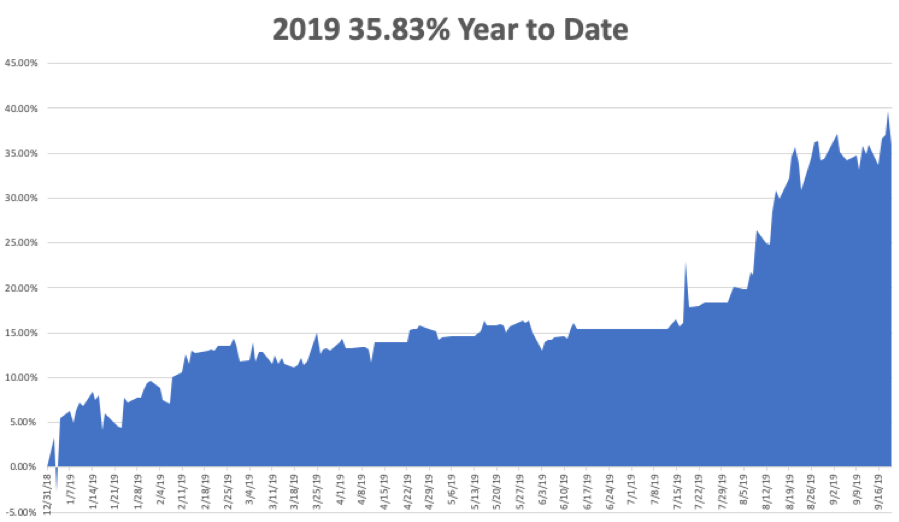
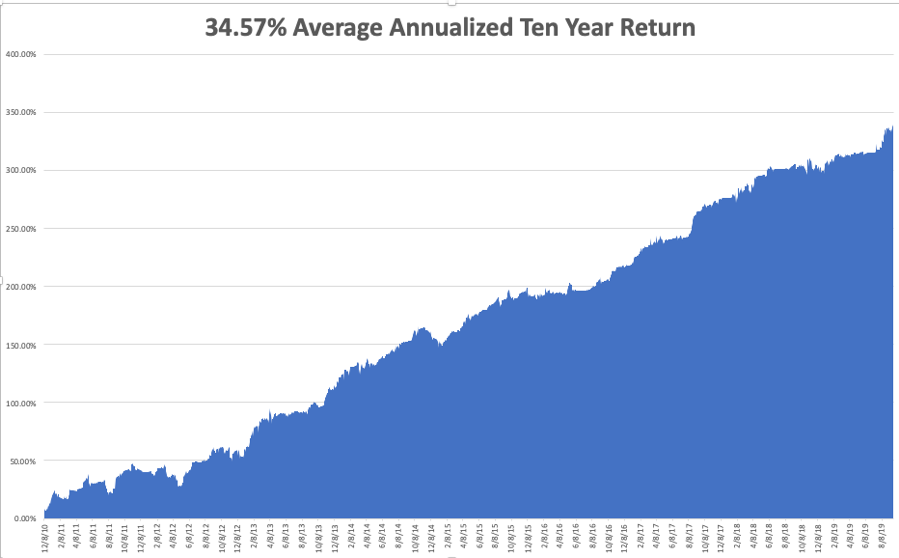
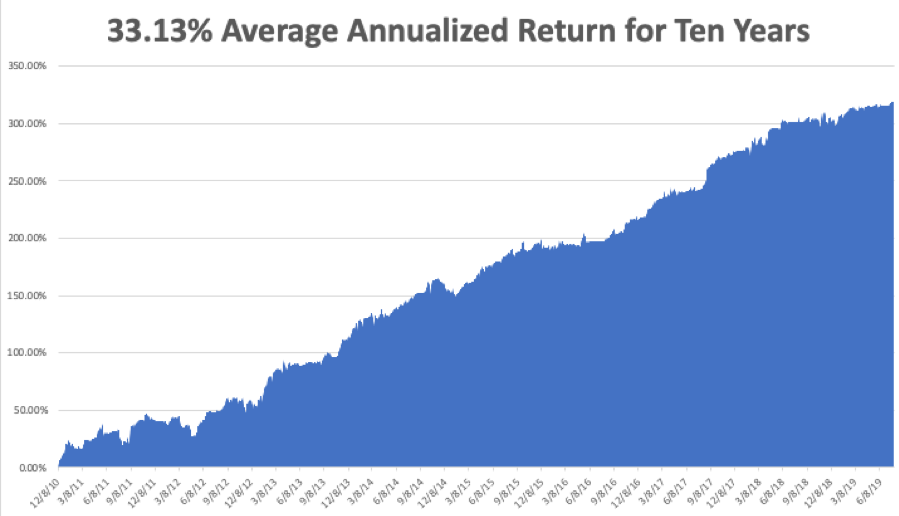
The Mad Hedge Trader Alert Service still doing well in this indecisive market. My Global Trading Dispatch reached a new all-time high of 336.07% and my year-to-date ground up to +35.83%. My ten-year average annualized profit bobbed up to +34.57%.
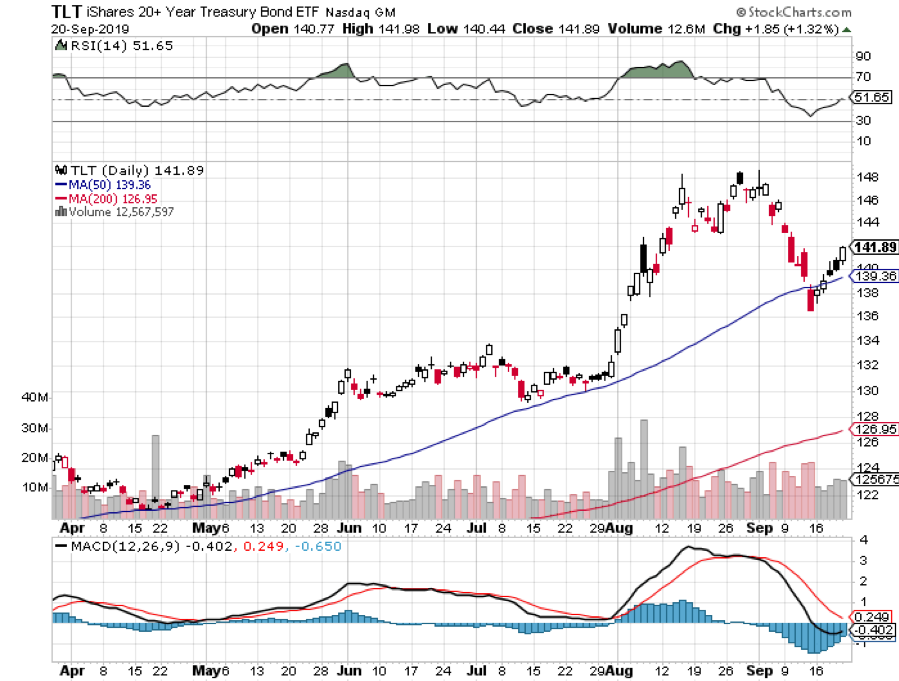
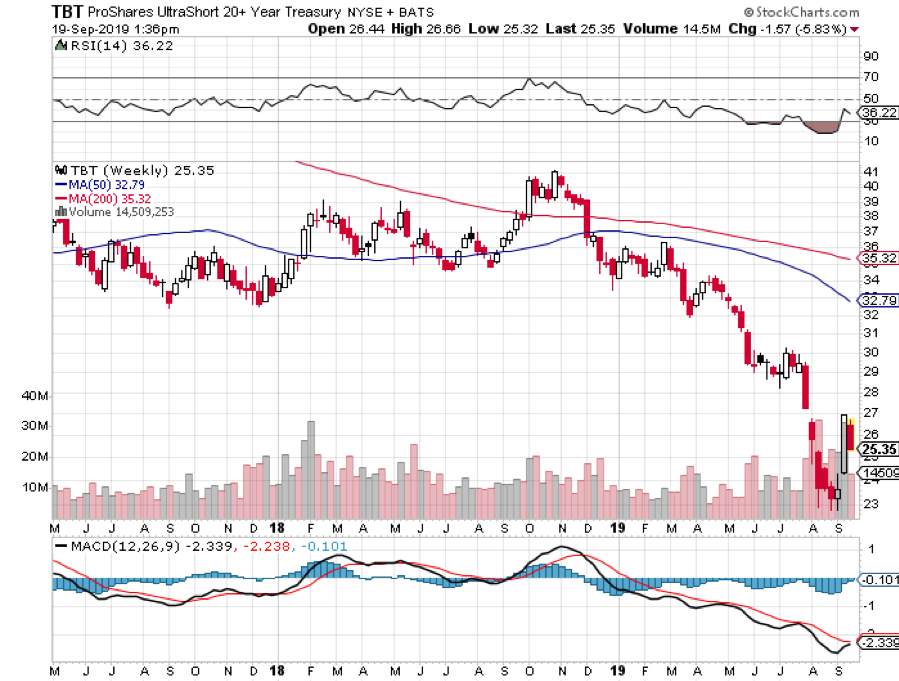
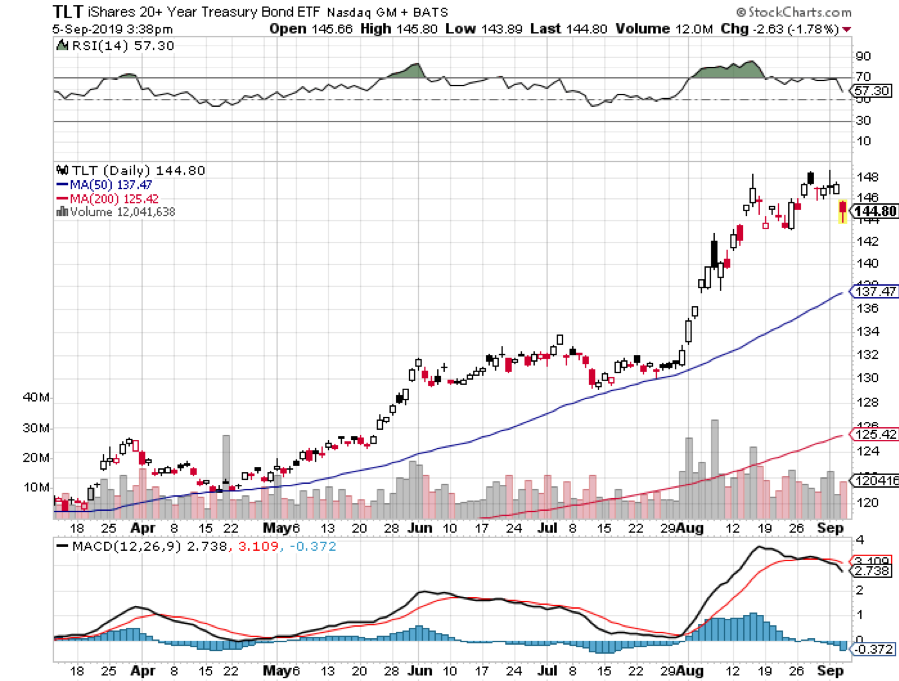
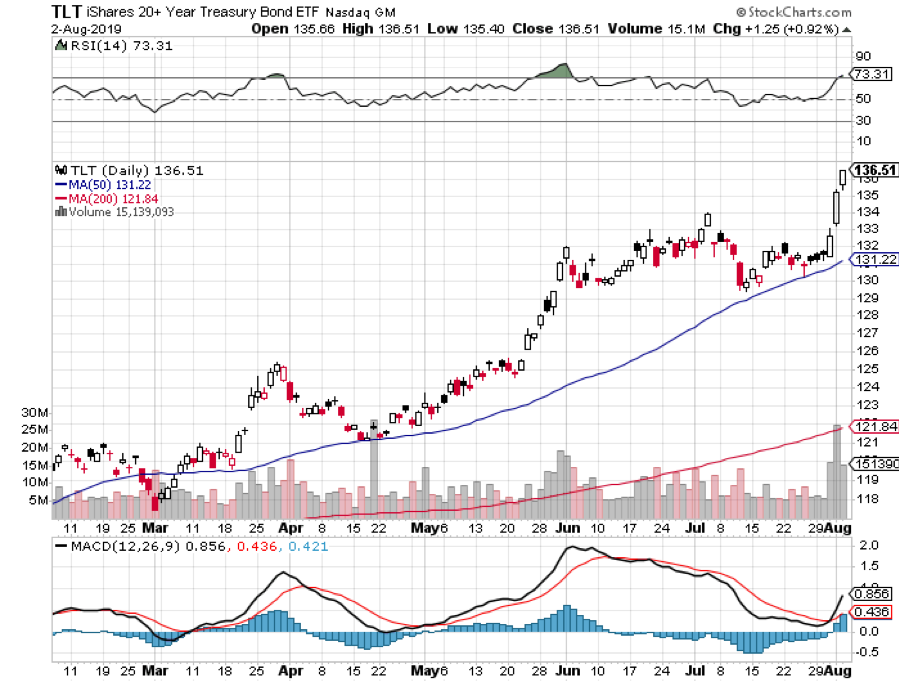
I took profits in my long bond position (TLT) earlier in the week, capturing a four-point rally there. I am left with my short position in oil (US), which needs a $9 a barrel move against it to lose money. That should be fine as long as there is not another attack on the Saudi oil fields.
It is interesting to note that this ramped up the implied volatilities on oil options going into the Friday close over fears of just such an event. We will get all that back at the Monday morning opening….as long as the weekend proves peaceful.
On Monday, September 23 at 8:30 AM, the Chicago Fed National Activity Index for August is out.
On Tuesday, September 24 at 9:00 AM, the S&P Case-Shiller National Home Price Index is updated, for July.
On Wednesday, September 25, at 8:30 AM, we learn August New Home Sales.
On Thursday, September 26 at 8:30 AM, the Weekly Jobless Claims are printed. We also obtain the final read for Q2 GDP.
On Friday, September 27 at 8:30 AM, the August Durable Goods is printed. The Baker Hughes Rig Count is released at 2:00 PM.
As for me, I’ll be doing a ten-mile backpack through Point Reyes National Seashore with a 60-pound pack and feasting on freeze-dried food in front of a campfire. Got to remain bootcamp-ready. You never know when Uncle Sam is going to come calling again.
Good luck and good trading.
John Thomas
CEO & Publisher
The Diary of a Mad Hedge Fund Trader