I have been pounding the table trying to get readers out of gold since early December. Now, my friend at stockcharts.com, Mike Murphy, has produced a stunning series of charts showing that this may be more than just a short-term dip and another buying opportunity.
Mike explains that a number of traditional chart, technical, and intermarket signs are flashing serious warning signals. At the very least, we are going to test $1,500 an ounce sometime soon. If that doesn?t hold, then $1,250 is in the cards.
To make matters particularly fiendish for traders, we may see a false breakdown through $1,500 first, well into the 1,400?s, that sucks in tons of capitulation sellers before an uptrend resumes. It is a scenario that will be enough to test even the most devoted of gold bugs.
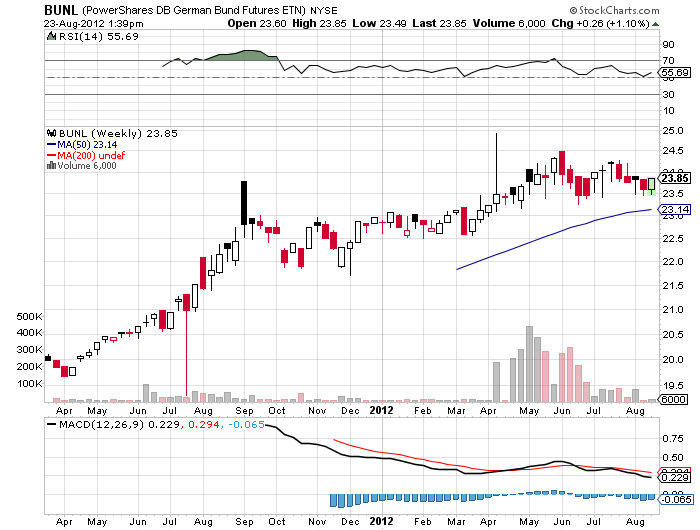
At risk is nothing less than the end of a bull market that is entering its 12th year. The shares of gold miners suggest that the demise of the bull market is already a foregone conclusion. The index for this group (GDM) has breached major support once again and is looking for a new four year low. Since this index usually correlates very highly with the barbarous relic, the grim writing is on the wall.
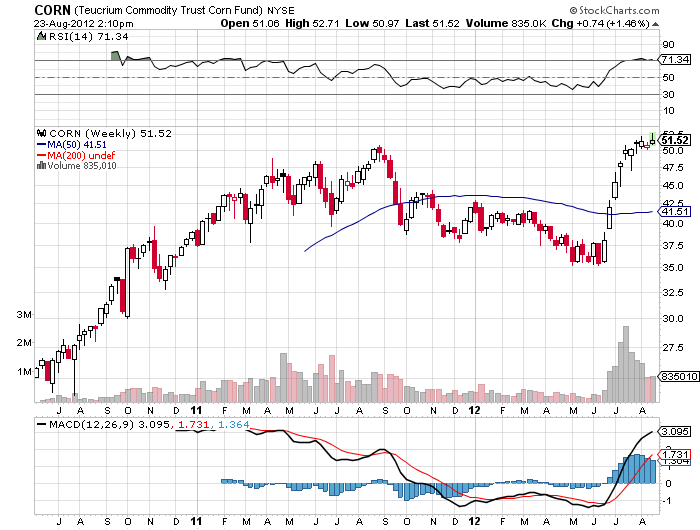
A strong dollar does not auger well for gold either. Look at the chart below, and you see the dollar basket (UUP) has punched through to an eight month high. Until two weeks ago, this was primarily a weak yen story. But since then, both the euro (FXE) and Sterling (FXB) have collapsed, adding fuel to the fire. And it is not just gold that is feeling the heat. The entire commodities space has been the pain trade, including oil (USO), copper (CU), and other hard assets.
There are a host of reasons why the yellow metal has suddenly become so unloved. The largest holder of the gold ETF (GLD), John Paulson, is getting big redemptions in his hedge fund, forcing him to sell. This is why the selling is so apparent in the paper gold markets, like the ETF?s, but not the physical.
India has suddenly seen its currency, the rupee, drop against the greenback. That reduces the buying power of the world?s largest gold importer. With years of pernicious deflation ahead of us, who needs a traditional inflation hedge like the yellow metal?
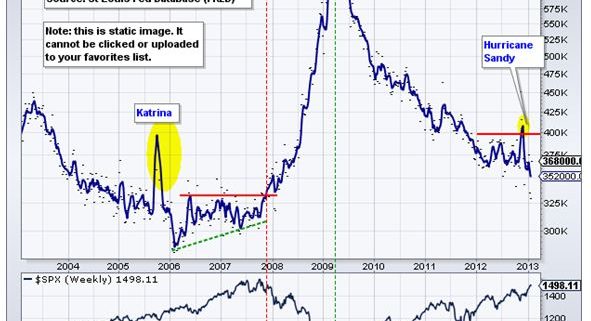
Here is the final nail in the coffin for gold. Look at the last chart of the Federal Reserve Bank of St. Louis?s measurement of the broader monetary base. It shows that it has exploded to the upside in recent months. In the past, gold matched the rise in the money supply step for step. Now it?s not. If a market can?t rally on fabulous news, which it has obviously failed to do since the last QE was launched in September, then you sell the daylights out of it. That is what most traders believe.
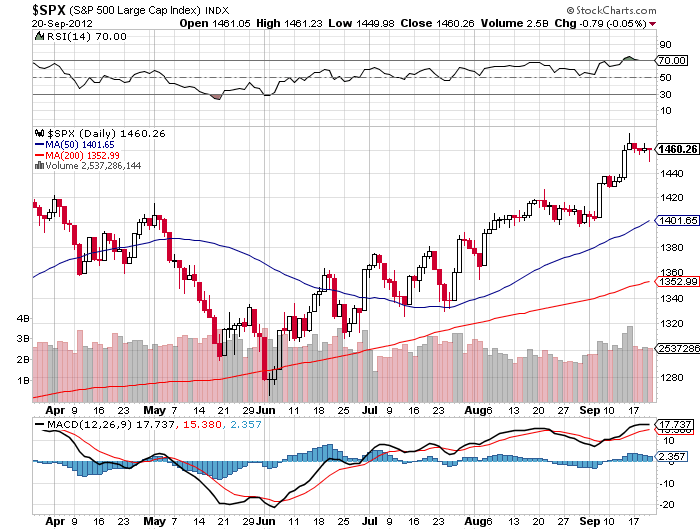
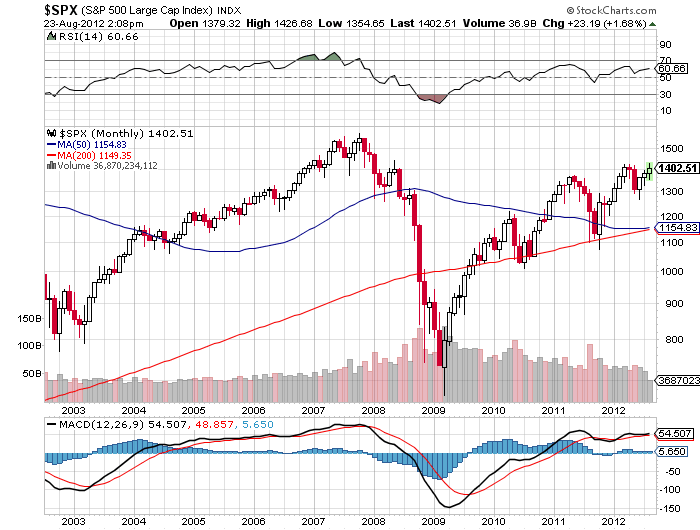
The screaming conclusion here is that traders are pouring their money into stocks instead of gold. Now, paper trumps gold. Conditions for the barbarous relic will, therefore, probably get worse before they get better.
Ben Bernanke affirmed as much last week when he told Congress that quantitative easing would continue unabated for the foreseeable future. That means rising stocks and flat bonds, all of which are bad for gold. The bottom line here is that when gold makes its first run at $1,500, I am not going to jump in as a buyer.


Weekly December, 2011 to February, 2013
Adjusted Monetary Base
Reserve Bank of St. Louis

Suddenly Going Out of Style