In summarizing the global financial system today, I recall the classic fifties James Dean movie, Rebel Without a Cause. Two cars are racing towards a cliff and the chicken has to bail out first. But the chicken gets his jacket sleeve stuck on a door knob, and his car dives over the cliff and crashes and burns.
Thus, here we are entranced by the world’s two largest economies in a race towards a cliff, but this time, it’s an economic one. Will rational minds prevail, or will our leaders miscalculate and plunge the world into a Great Depression? In other words, will the crashing car land on us?
That’s what happened during the 1930s when after the 1929 stock market crash lead to tit for tat tariffs that eliminated economic growth for a decade. It was only after the massive defense spending of WWII that the slump ended. This time the script is playing out exactly the same way.
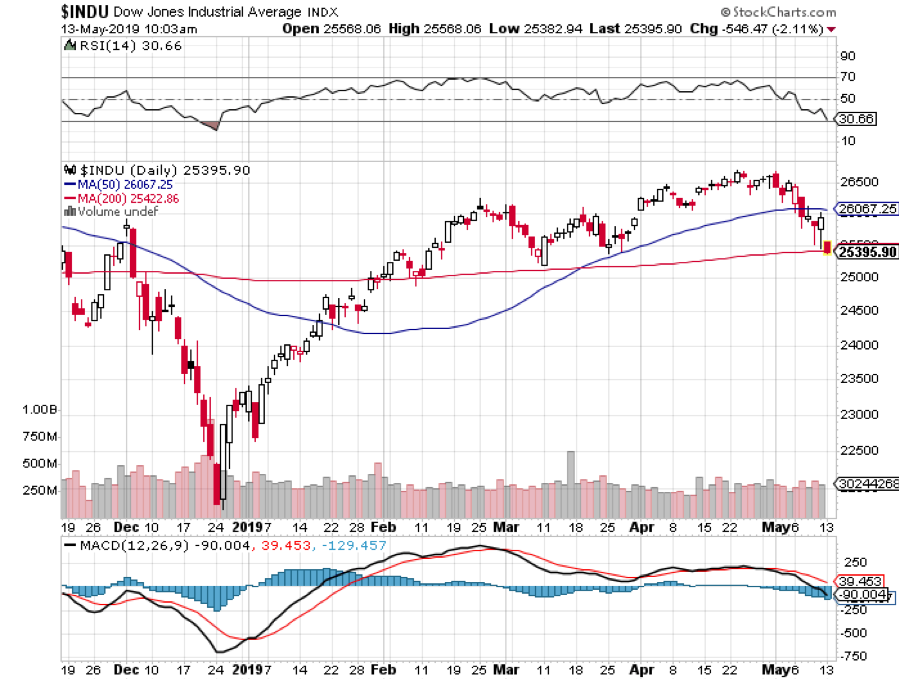
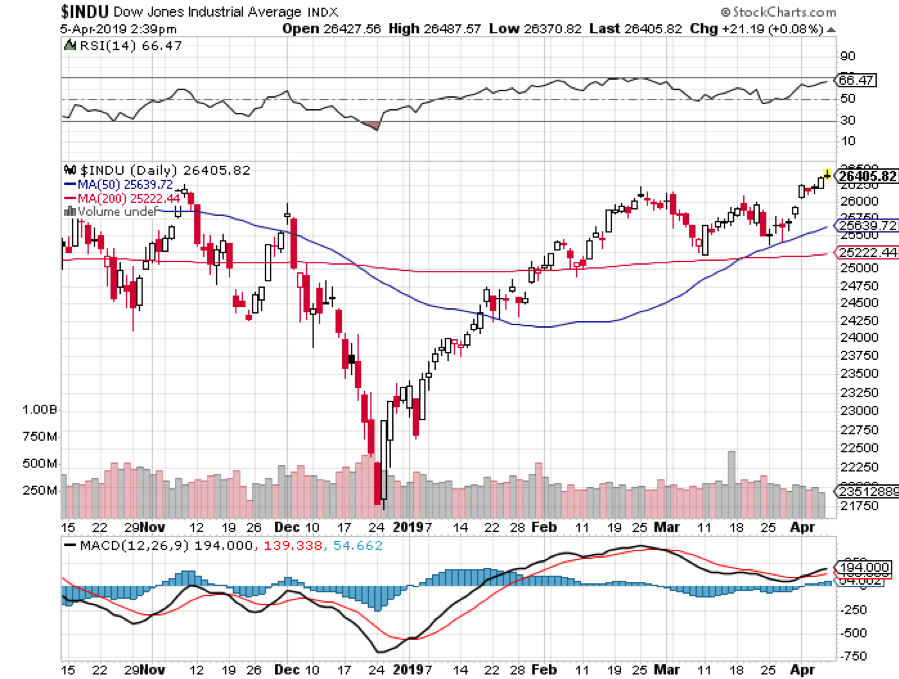
Certainly, the stock market believes in the rosier scenario. The Dow average only fell 1,278 points last week. In a real “NO DEAL” case, it would have given up the full 4,500 points it gained since December.
A prolonged trade war until the next election would take us well into a recession and back to down the 18,000 that prevailed before the last presidential election.
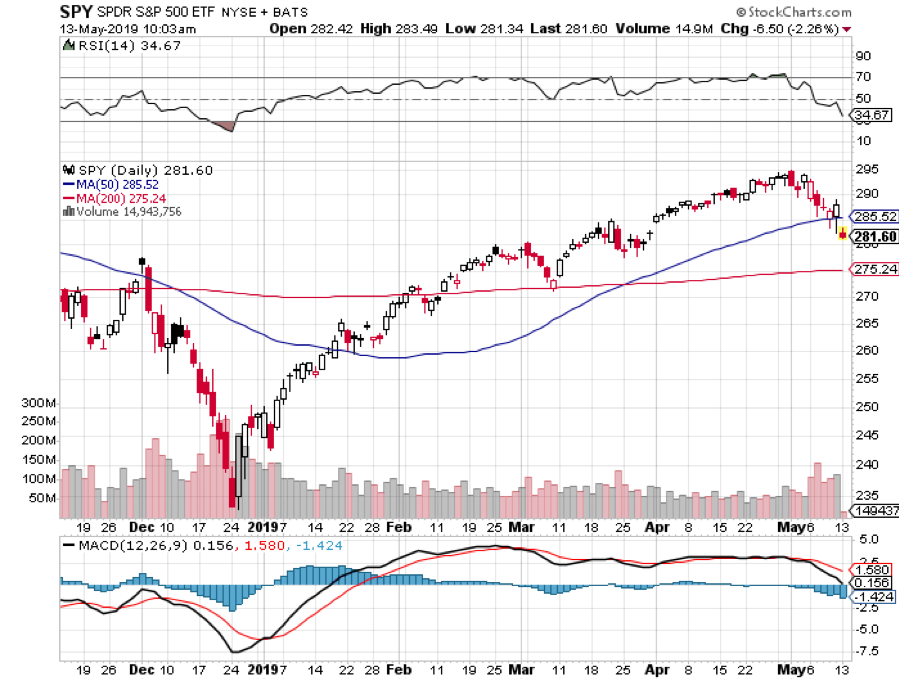
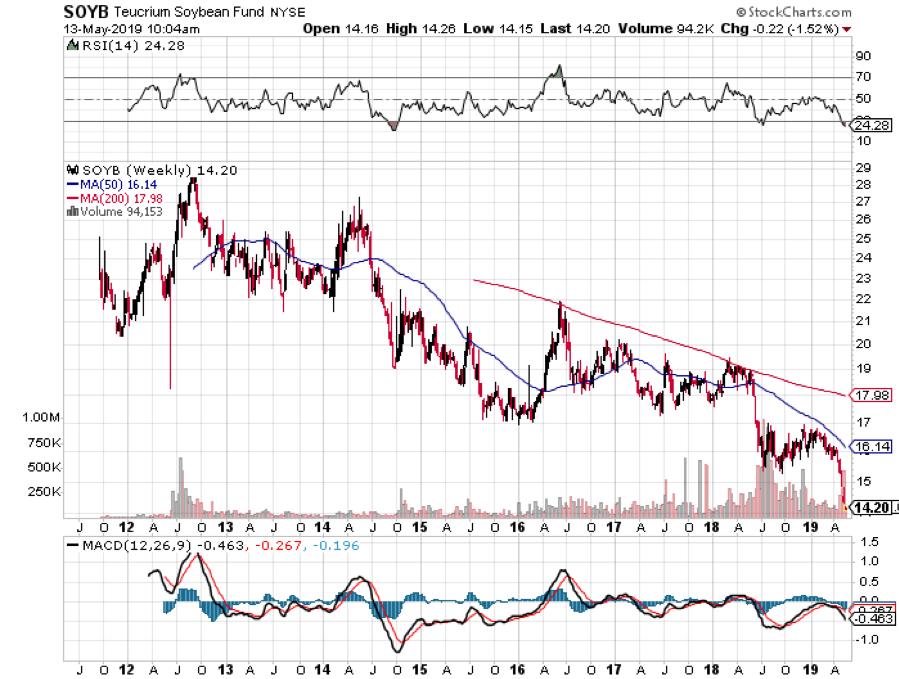
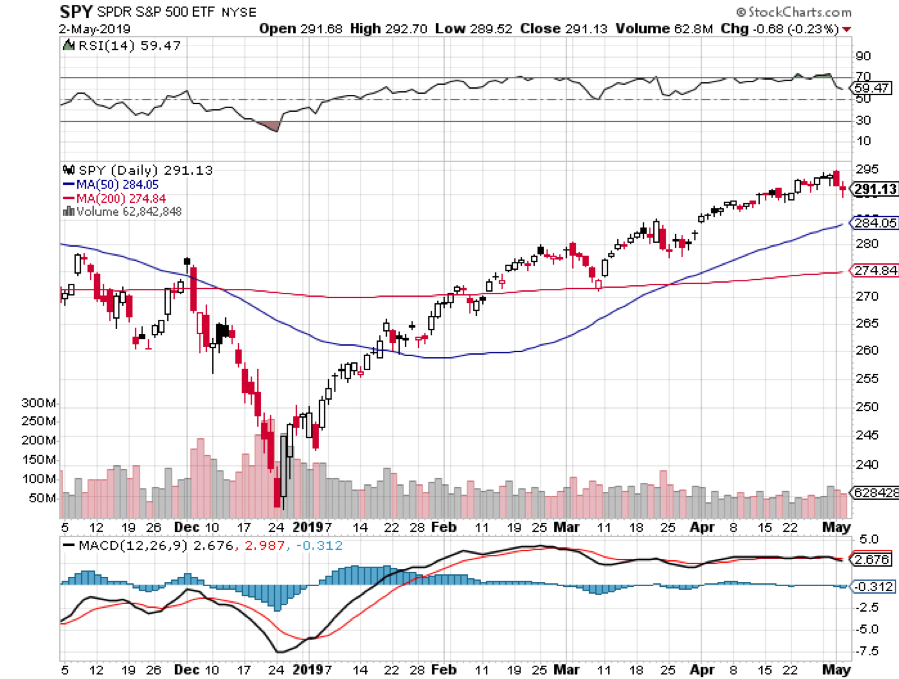
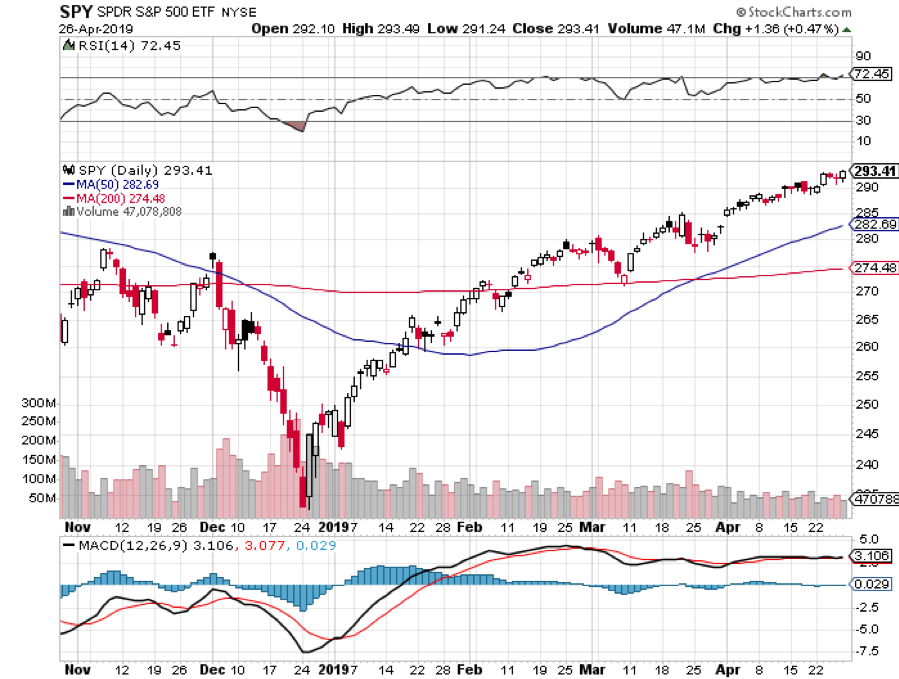
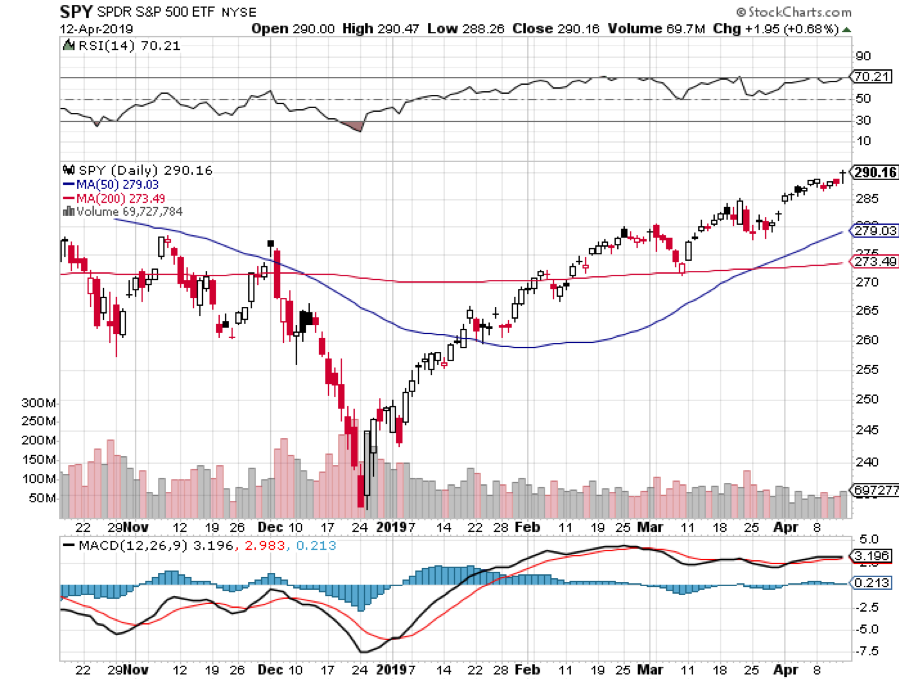
For the short term, the S&P 500 (SPY) is clearly gunning for the 200-day moving average at $275. That would take us down 6.78% from the recent high. I have been using soybean prices (SOYB) as an indicator of China trade negotiation success. It hit a seven-year low this morning.
It's all about trade talks all the time now and nobody has the slightest idea of what is coming next. So, I’ll sit back and wait until the Volatility Index (VIX) hits $30, or the (SPY) drops to $275 before entertaining another trade alert. Until then, I’ll maintain my 100% cash position.
I reach all these conclusions after two days of solid sleep, recovering from four days of bacchanalia at the SALT conference in Las Vegas. I'll write more about this when the market stops crashing long enough for me to write it up.
Long term followers of this letter are laughing because they recall that two years ago I predicted that the next bear market would start precisely on May 10 at 4:00 PM EST. That estimate was arrived at by an intricate calculation of the timing of a coming yield curve inversion and recession.
The S&P 500 (SPY) hit an all-time high of $295 on May 2 at 4:00 PM EST, seven trading days early. Who knew that it would be a Tweet that did it?
Uber went public last week, likely at an $82 billion valuation which sucked $10 billion out of the market. Not helping was a stock market crash and an Uber driver’s strike that spread from the US to London. After car operating expenses are taken out, drivers only net a paltry $5 an hour.
The Fed warned about high stock prices, and business borrowing is at an all-time high just two days before the market dumped. Maybe we should listen to our central bank?
US Job Openings soared in March, by a stunning 346,000 to 7.5 million. This is what tops look like.
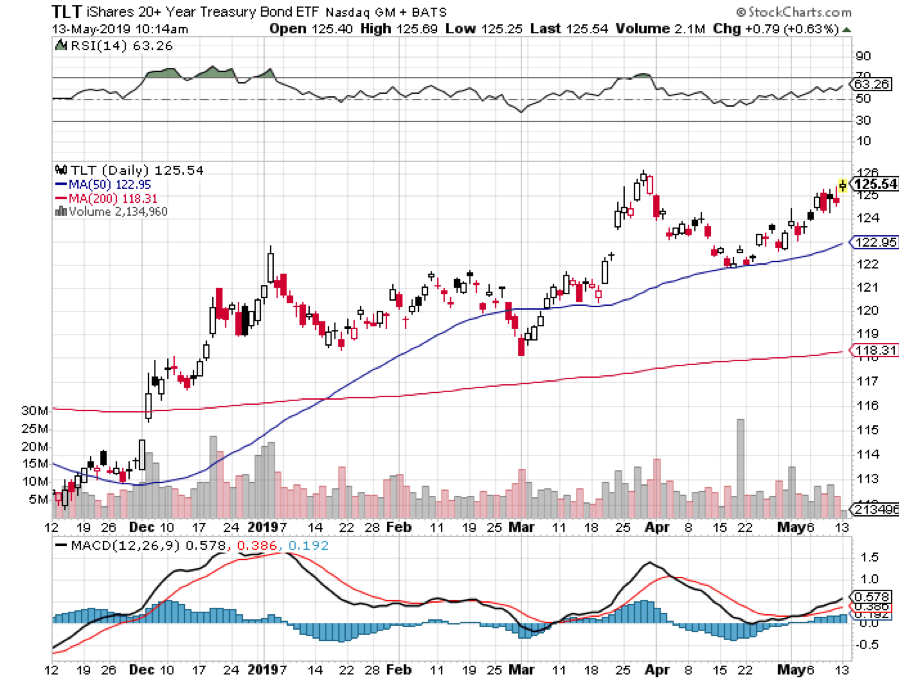
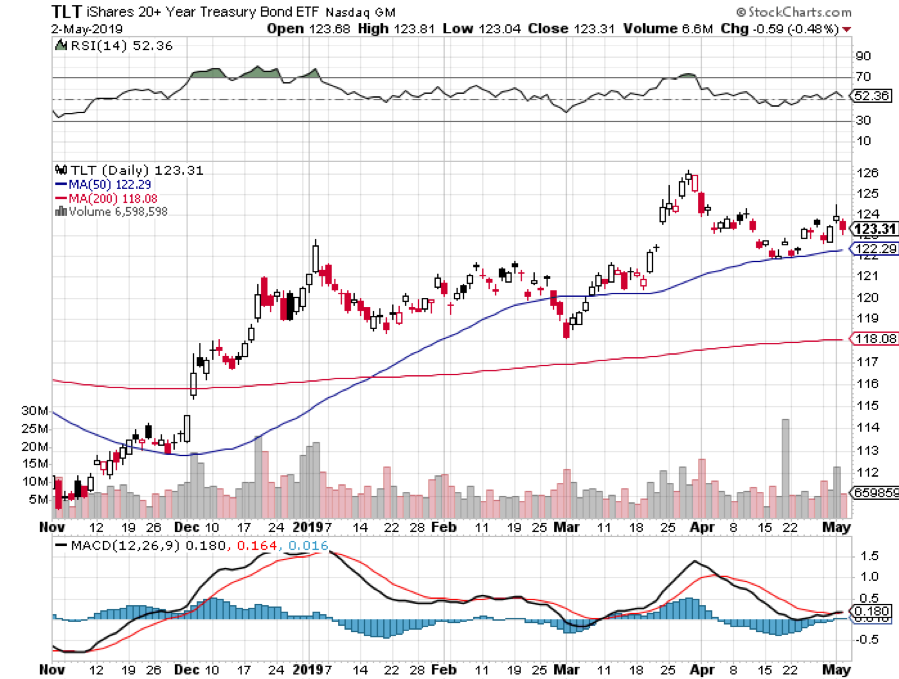
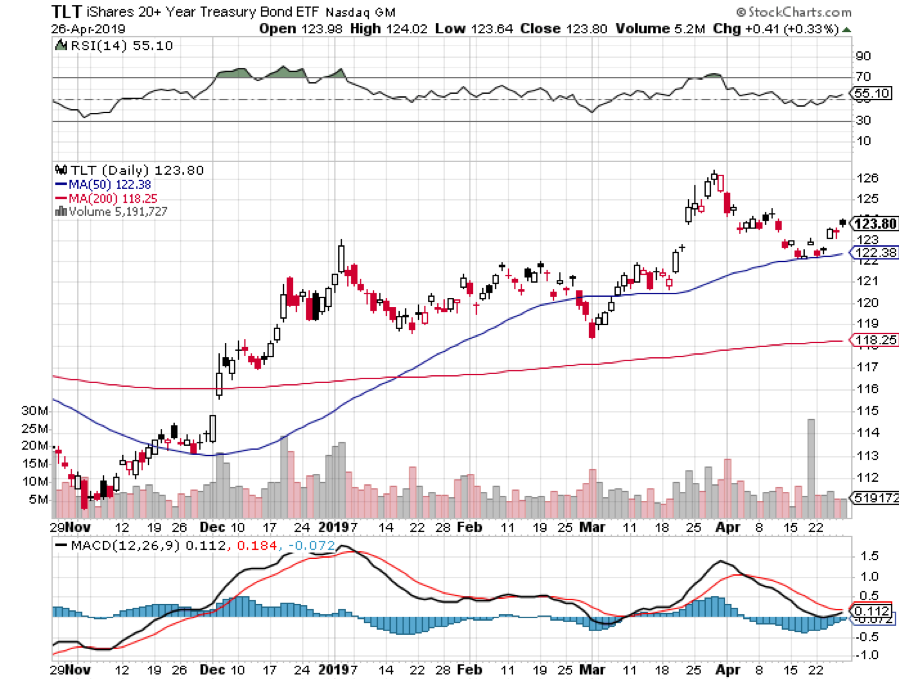
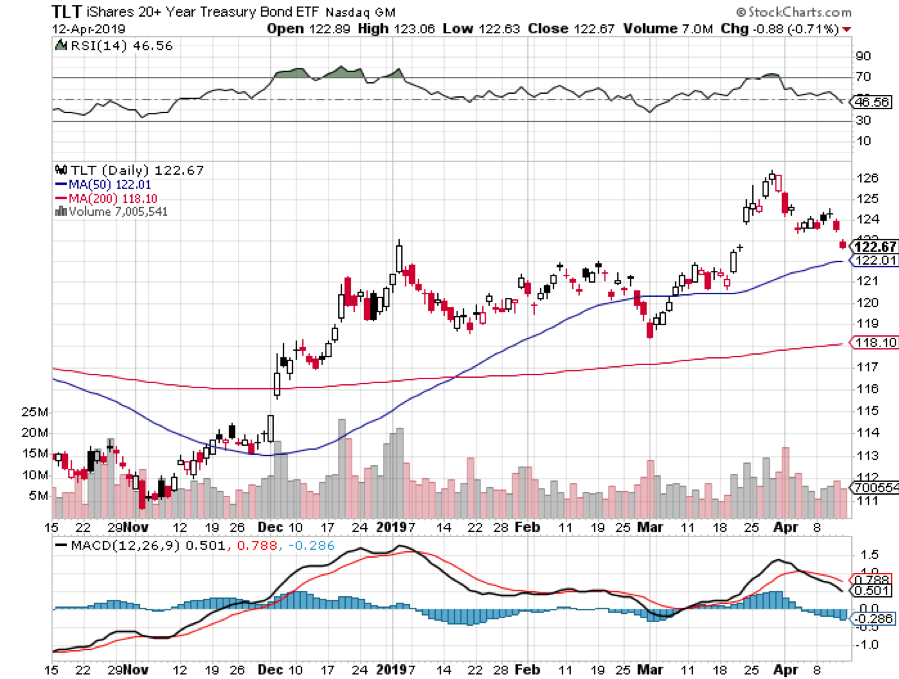
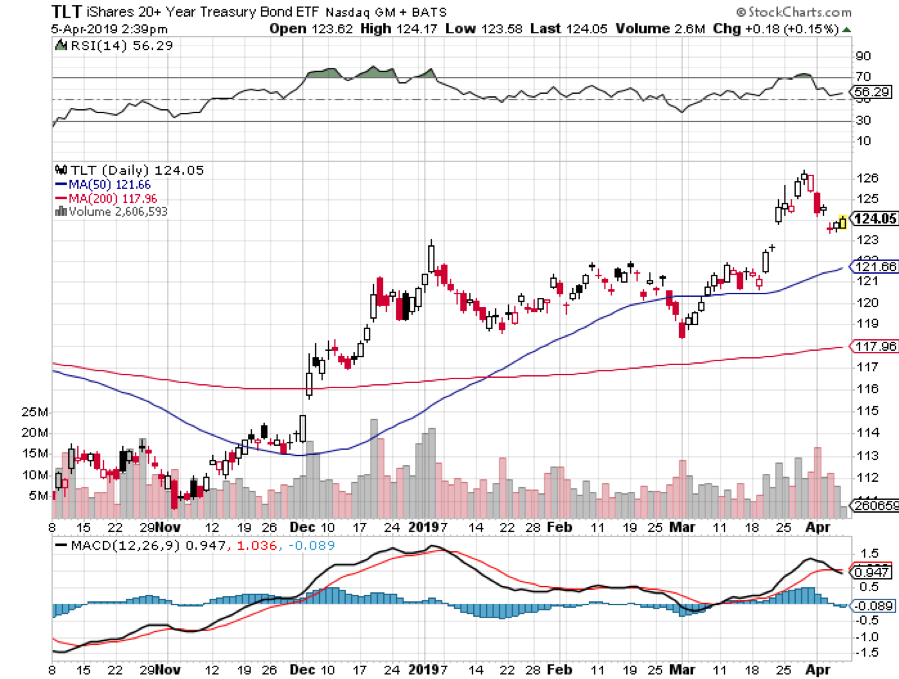
Bonds exploded to the upside on stock market panic, as the world stampedes to “RISK OFF.” There’s a great (TLT) short sale setting up here, but not quite yet.
The US trade deficit hit a five-year low in March, down 16.2% to $20.7 billion. This is due to a big 23.7% jump in US exports to China, thanks to China’s massive economic stimulus program, not ours. But at what cost?
The Mad Hedge Fund Trader dumped its last position Monday morning and, as a result, was completely up 50 basis points on the week. You may have noticed that I have been stopping out of positions must faster than usual recently and now you know the reason why.
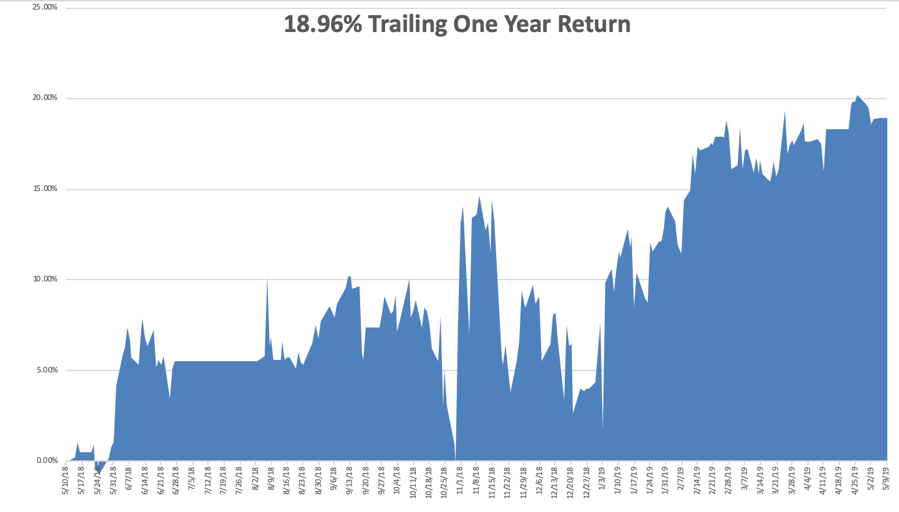
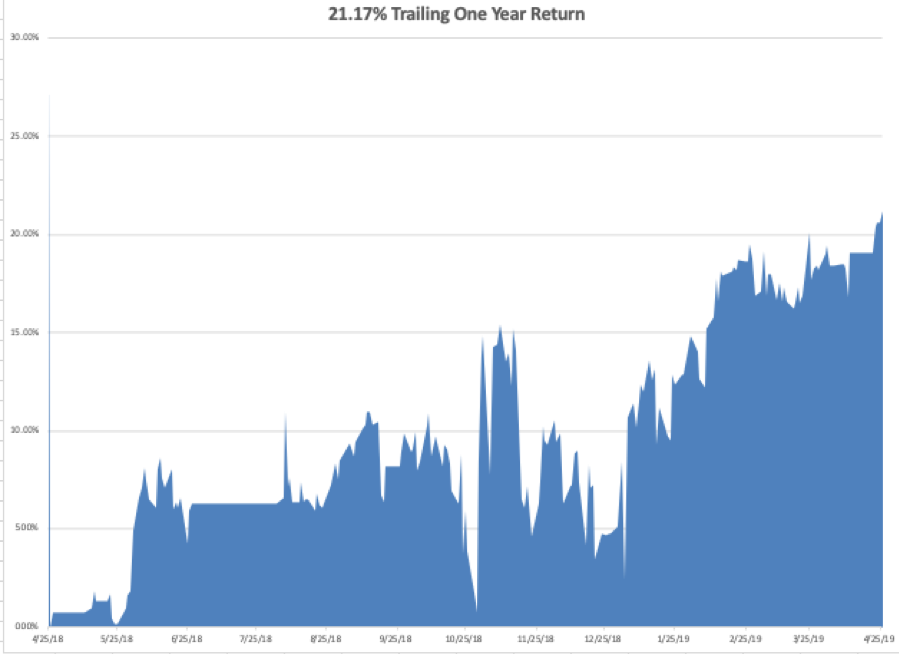
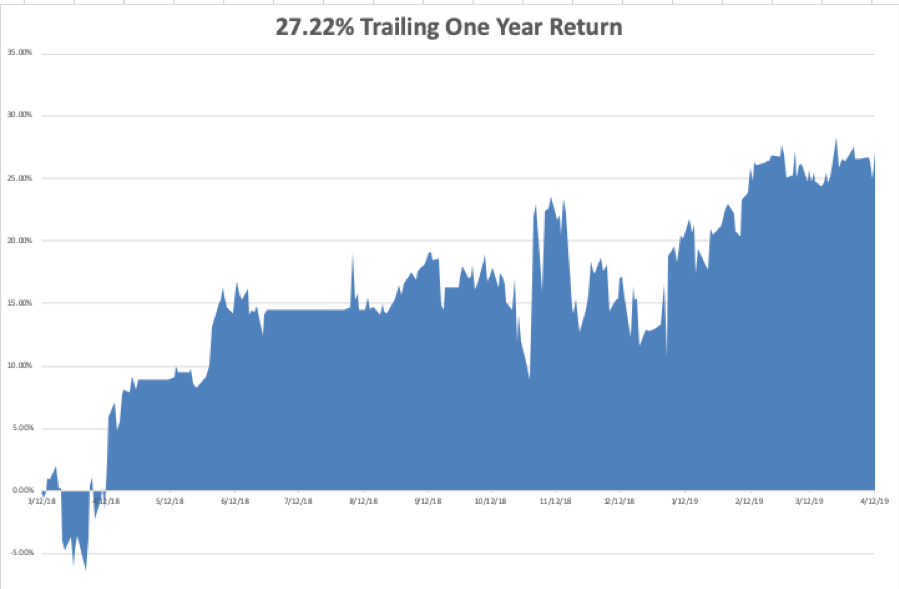
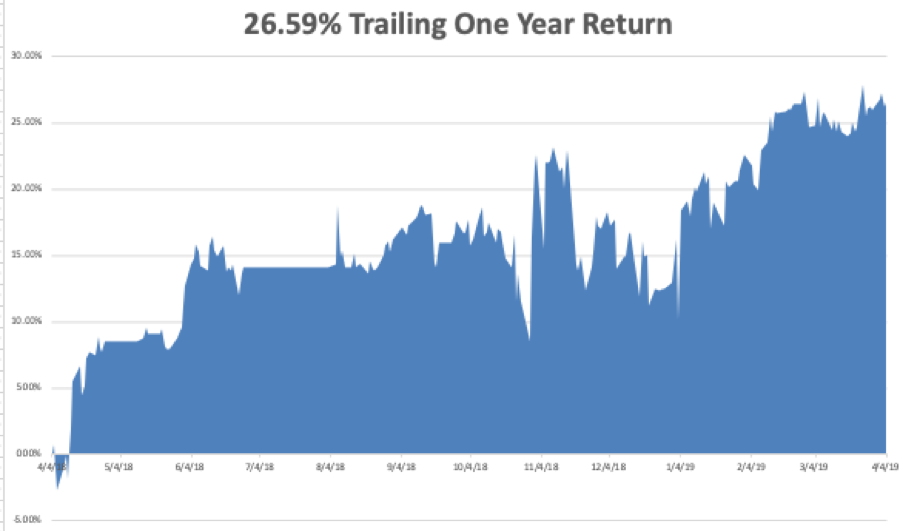
Global Trading Dispatch closed the week up 14.59% year to date and is down -1.13% so far in May. My trailing one-year retreated to +18.96%.
Mad Hedge Technology Letter gave back some ground with two new very short-term positions in Intuit (INTU) and Google (GOOG) which expire on Friday
Some 11 out of 13 Mad Hedge Technology Letter round trips have been profitable this year.
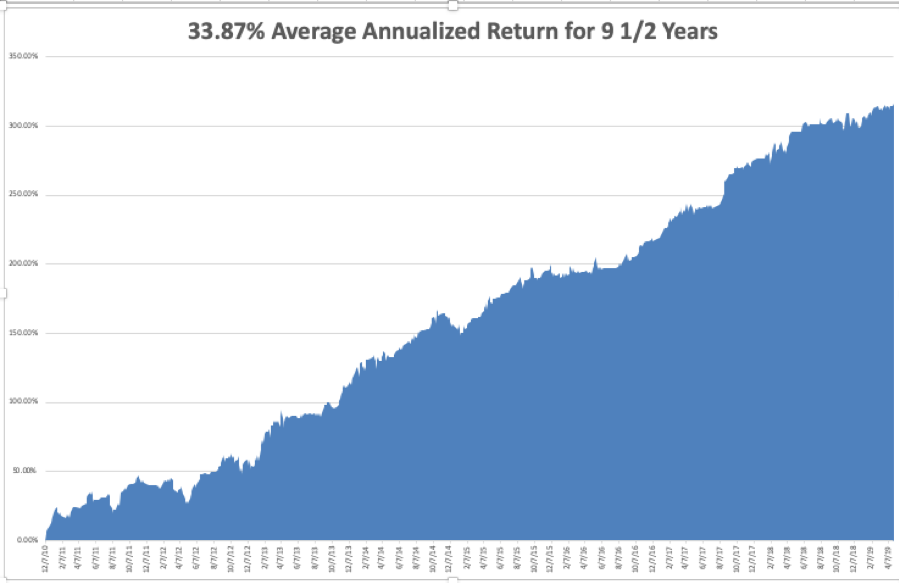
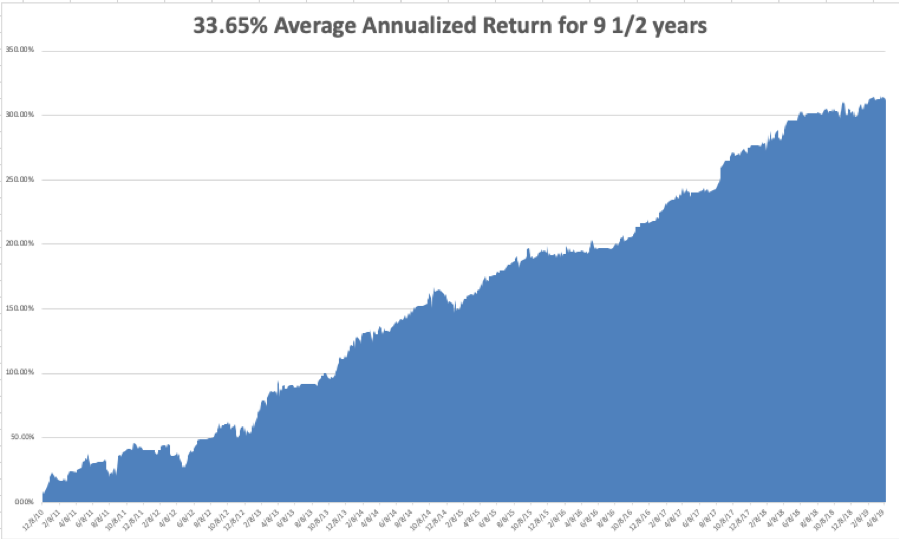
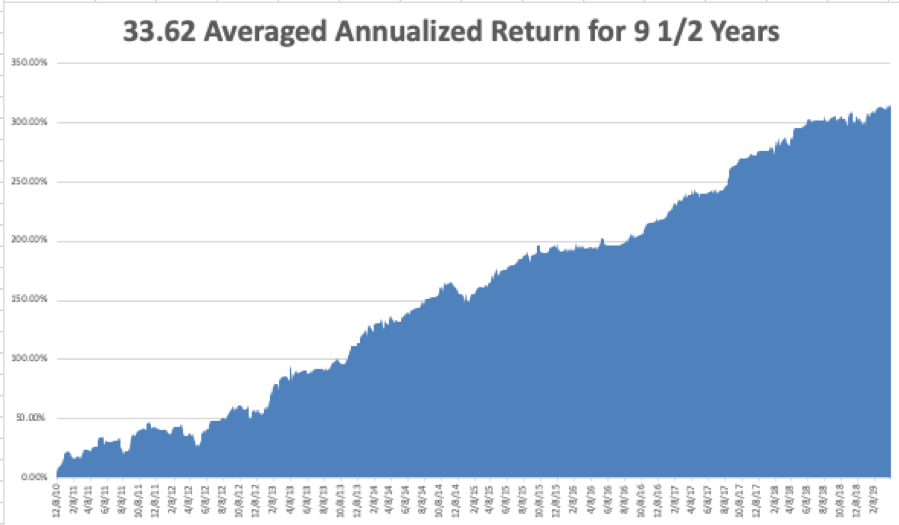
My nine and a half year profit rose slightly to +314.73%. With the markets in free fall, I am now 100% in cash with Global Trading Dispatch and 80% cash in the Mad Hedge Tech Letter. I’ll wait until the markets find their new range and then jump in on the long side.
The coming week will be pretty boring on the data front.
On Monday, May 13 at 11:00 AM, the April Survey of Consumer Sentiment is announced.
On Tuesday, May 14, 6:00 AM EST, the NFIB Small Business Index is out.
On Wednesday, May 15 at 8:30 AM, March Retail Sales are released
On Thursday, May 16 at 8:30 AM, Weekly Jobless Claims are published. March Housing Starts to come out at the same time.
On Friday, May 17 at 10:00 AM, March Consumer Sentiment is printed.
As for me, I will be flying back from Las Vegas over the weekend having attended the SALT conference and my own Mad Hedge Fund Trader strategy luncheon. The highlight of the week was listening to Woodstock veterans Credence Clearwater Revival. I’ll write more about it next week.
Good luck and good trading.
John Thomas
CEO & Publisher
The Diary of a Mad Hedge Fund Trader