Global Market Comments
October 31, 2025
Fiat Lux
Featured Trade:
(OCTOBER 29 BIWEEKLY STRATEGY WEBINAR Q&A),
(SPY), (TLT), (GLD), ($WTIC), (USO), (TAN)

Global Market Comments
October 31, 2025
Fiat Lux
Featured Trade:
(OCTOBER 29 BIWEEKLY STRATEGY WEBINAR Q&A),
(SPY), (TLT), (GLD), ($WTIC), (USO), (TAN)
Global Market Comments
October 27, 2025
Fiat Lux
Featured Trade:
(MARKET OUTLOOK FOR THE WEEK AHEAD, or THE YEAREND RALLY HAS STARTED),
(NFLX), (SPY), (TLT), ($VIX), (GM), (TSLA),
(USO), (PHM), (GLD), (AAPL), (SLV), (FXI)

Global Market Comments
October 13, 2025
Fiat Lux
Featured Trade:
(MARKET OUTLOOK FOR THE WEEK AHEAD, or A FRIDAY AFTERNOON SURPRISE)
($INDU), (SPY), (GLD), (TLT), (USO), ($VIX),
(GS), (MSTR), (TSLA), (NFLX), (IBKR)

Global Market Comments
September 22, 2025
Fiat Lux
Featured Trade:
(MARKET OUTLOOK FOR THE WEEK AHEAD, or WHY THE CRASH WILL START ON NOVEMBER 5)
(GS), (JPM), (AAPL), (TLT), (MSFT)

Global Market Comments
September 19, 2025
Fiat Lux
Featured Trade:
(SEPTEMBER 17 BIWEEKLY STRATEGY WEBINAR Q&A),
(GS), (HOOD), (DAX), (SPY), (TLT),
(GLD), (MSTR), (PFE), (FCX), (BITO)
Global Market Comments
September 4, 2025
Fiat Lux
Featured Trade:
(THIS WILL BE YOUR BEST PERFORMING ASSET FOR THE NEXT 30 YEARS),
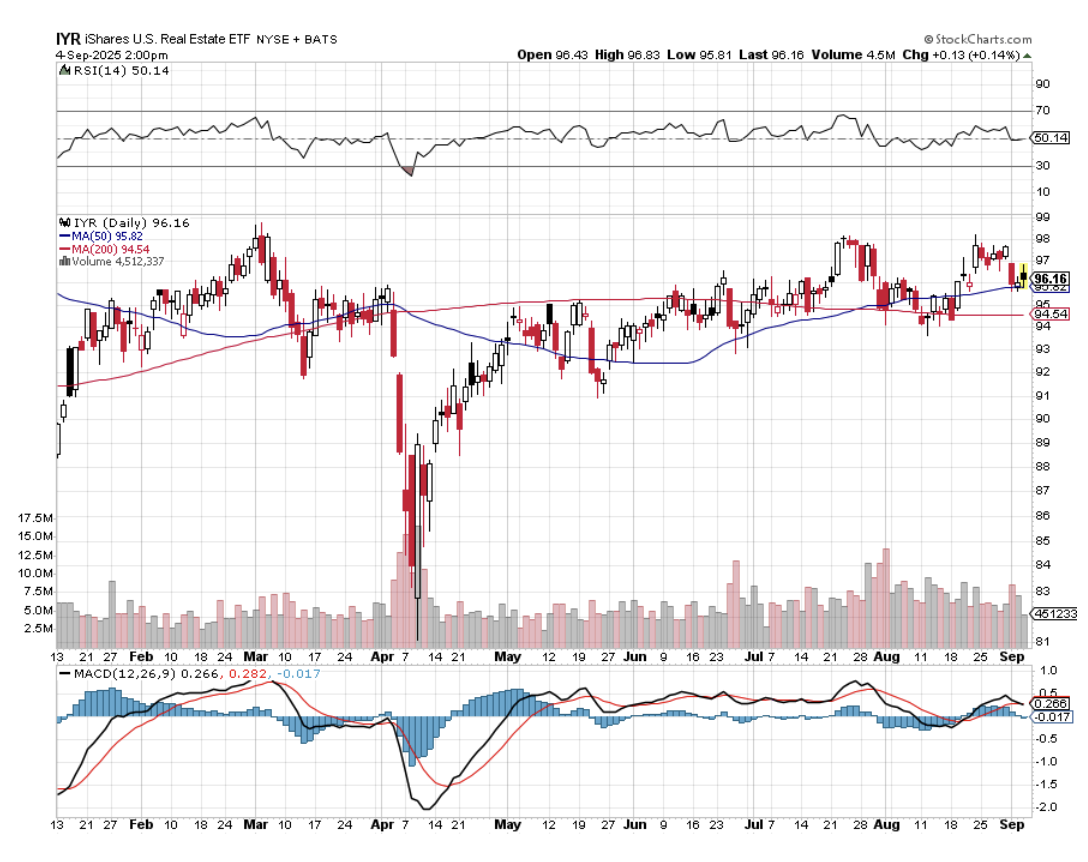
(IYR), (PHM), (LEN), (DHI), (TLT), (HYG), (MUB), (SPY)


Lately, I have spent my free time trolling the worst slums of Oakland, CA.
No, I’m not trying to score a drug deal, hook up with some ladies of ill repute, or get myself killed.
I was looking for the best-performing investment for the next 30 years.
Yup, I was looking for new homes to buy.
As most of you know, I try to call all of my readers at least once a year and address their individual concerns.
Not only do I pick up some great information about regions, industries, businesses, and companies, but I also learn how to rapidly evolve the Diary of a Mad Hedge Fund Trader service to best suit my voracious, profit-seeking readers.
So when a gentleman asked me the other day to reveal to him the top-performing asset of the next 30 years, I didn’t hesitate: your home equity.
He was shocked.
I then went into the economics of the Oakland trade with him.
West Oakland was built as a working-class neighborhood in the late 1890s because it was a short hop on the ferry to San Francisco. Many structures still possess their original Victorian gingerbread designs and fittings.
Today, it is a 5-minute BART ride under the Bay to the San Francisco financial district.
A one three-bedroom, two-bath home I saw was purchased a year ago for $450,000, with a $50,000 down payment, and a 6.5% loan on the balance.
The investor quickly poured $50,000 into the property, with new paint, heating, hot water, windows, a kitchen, bathrooms, and flooring.
A year later, he listed it for sale at $650,000, and the agent said there was a bidding war on that would probably take the final price up to $700,000.
Excuse me, gentlemen, but that is a 400% return on a 50,000 investment in 12 months.
As Oakland rapidly gentrifies, the next buyer will probably see a doubling in the value of this home in the next five years.
Try doing that in the stock market.
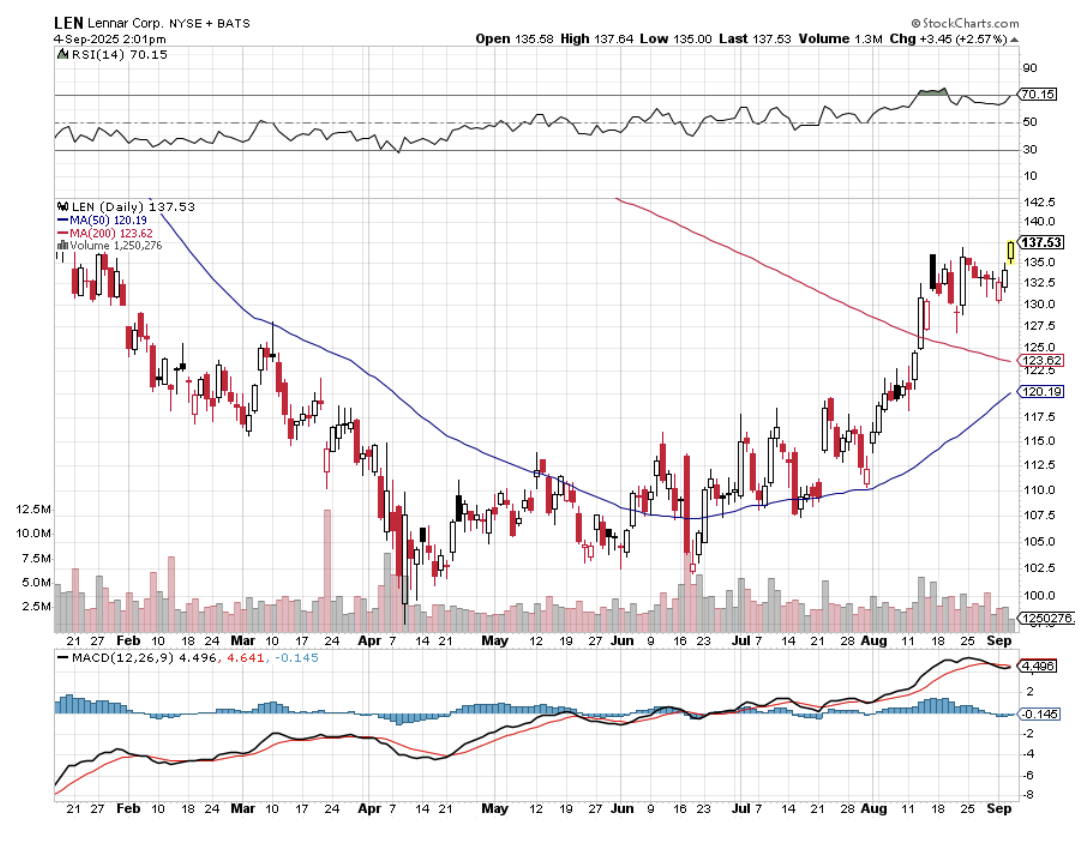
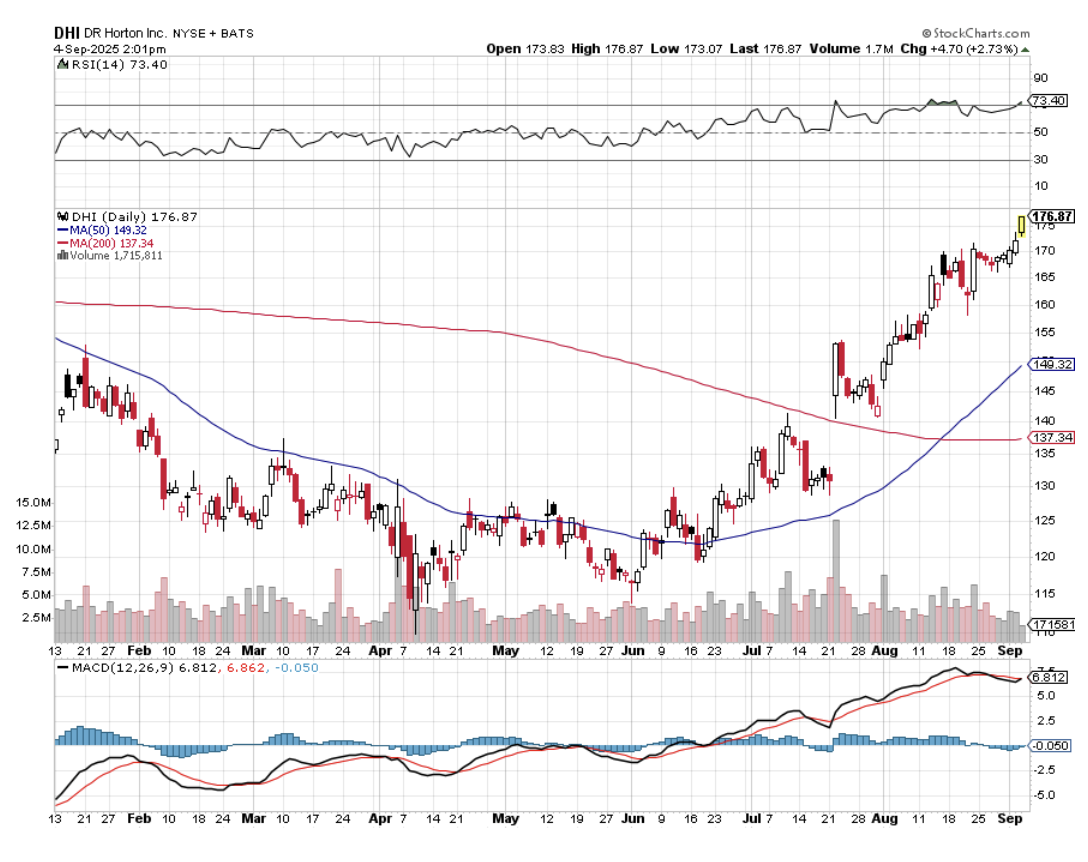
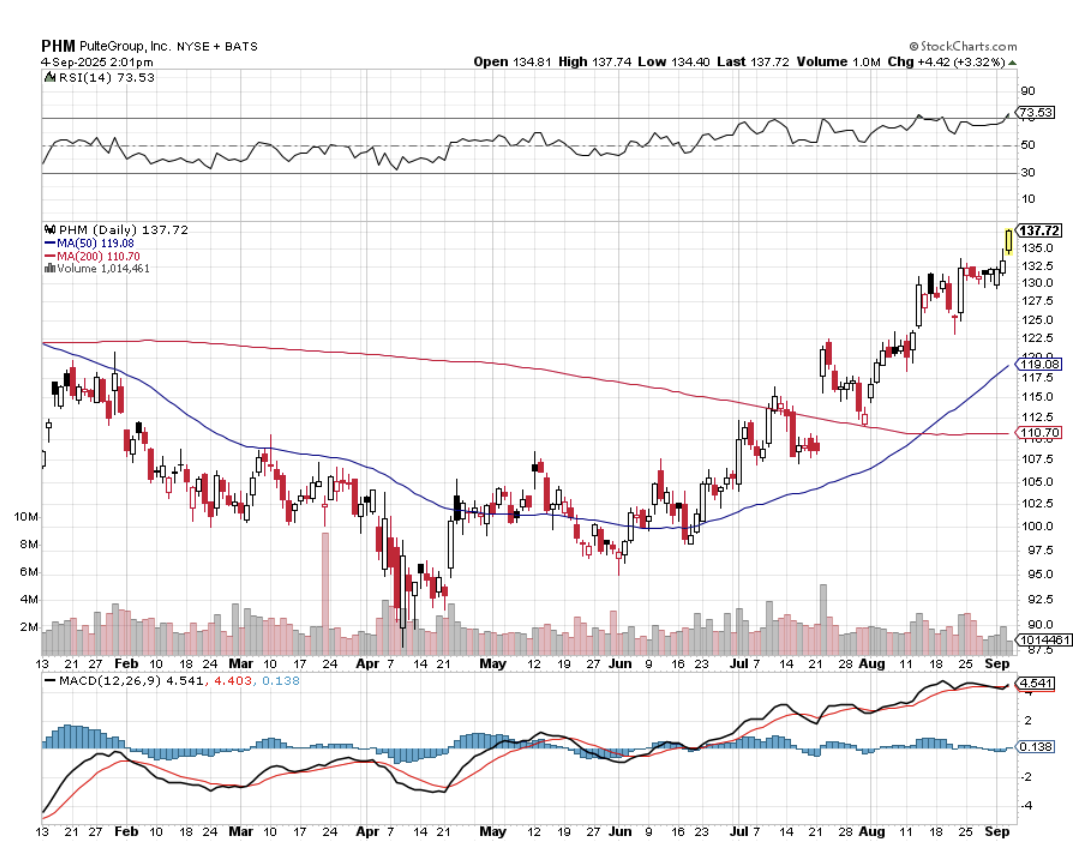
Needless to say, housing stocks like Lennar Homes (LEN), D.R. Horton (DHI), and Pulte Homes (PHM) need to be at the core of any long-term stock portfolio.
I then proceeded to list off to my amazed subscriber the many reasons why residential housing is just entering a Golden Age that will drive prices up tenfold, if not 100-fold, in the decades to come. After all, over the last 60 years, the value of my parents’ home in LA went up 100-fold and the equity 1,000-fold.
1) Demographics. The last decade started out as the hard decade for housing, when 80 million downsizing baby boomers unloaded their homes for greener pastures at retirement condos and assisted living facilities.
The 65 million Gen Xers who followed were not only far fewer in number, but earned much less, thanks to globalization and hyper-accelerating technology.
All of this conspired to bring us a real estate crash that bottomed out in 2011.
During the 2020s, the demographics math reverses.
That’s when 85 million millennials start chasing the homes owned by 65 million Gen Xers.
And as they age, this group will be earning a lot more disposable income, thanks to a labor shortage.
2) Population Growth
If you think it's crowded now, you haven’t seen anything yet.
Over the next 30 years, the US population is expected to soar from 335 million today to 450 million. California alone will rocket from 38 million to 50 million.
That means housing for 115 million new Americans will have to come from somewhere. It sets up a classic supply/demand squeeze.
That’s why megaprojects like the San Francisco to Los Angeles bullet train, which may seem wasteful and insane today, might be totally viable by the time they are finished.
3) They’re Not Building Them Anymore
Or at least not as much as they used to.
Total housing starts for 2024 were 1.55 million, a 3% decline from the 1.60 million total from 2023. Single-family starts in 2023 totaled 1.01 million, down 10.6% from the previous year. That means they are producing half of peak levels.
The home building industry has to more than triple production just to meet current demand.
Builders blame import taxes (tariffs) for materials like lumber (Canada) and drywall (Mexico), regulation, zoning, the availability of buildable land, lack of financing, and labor shortages.
The reality is that the companies that survived the 2008 crash are a much more conservative bunch than they used to be. They are looking for profits, not market share. They are targeting a specific return on capital for their business, probably 20% a year pretax.
It is no accident that new homebuilders like Lennar (LEN), Pulte Homes (PHM) and (DHI) make a fortune when building into rising prices and restricted supply. Their share prices have been on an absolute tear lately, and that is with a heartbreaking 6.5% mortgage rate.
This strategy is creating a structural shortage of 10 million new homes in this decade alone.
4) The Rear View Mirror
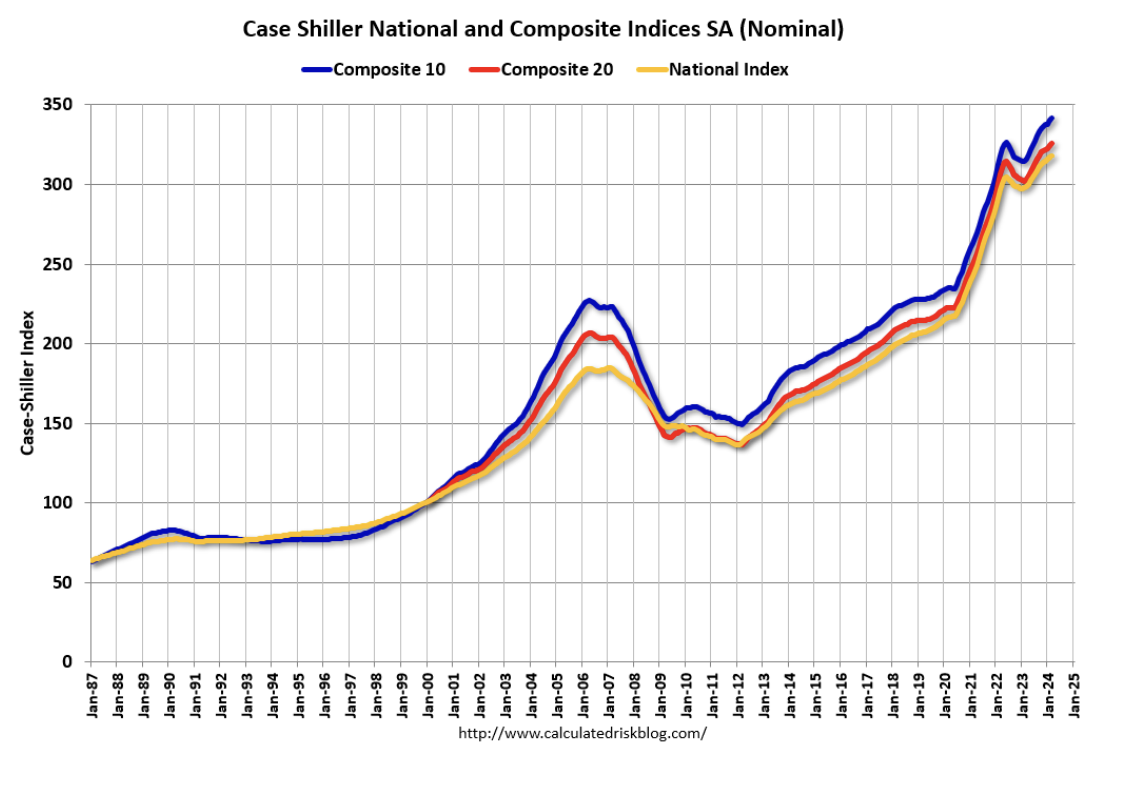
The Case Shiller CoreLogic National Home Price Index (see below) has started to fall after decades of increases. This will finally start to address affordability, one of the most daunting issues facing the market today.
Unless you have a new Internet start-up percolating in your garage, it is going to be very hard to beat your own home’s net return.
5) The Last Leverage Left
A typical down payment on a new home these days is 25%. That gives you leverage of 4:1. So in a market that is rising by 5.0% a year, your increase in home equity is really 20% a year.
Pay a higher interest rate, and down payments as low as 10% are possible, bringing your annual increase in home equity to an eye-popping 50%.
And if you qualify for an FHA loan up to $633,000, only a 3.5% deposit is required.
There are very few traders who can make this kind of return, even during the most spectacular runaway bull market. And to earn this money on your house, all you have to do is sleep in it at night.
6) The Tax Breaks are Great
The mortgage interest on loans up to $750,000 is deductible on your Form 1040, Schedule “A”, with a $40,000 limitation.
You can duck the capital gains entirely if the profit is less than $500,000, you’re married, and have lived in the house for 2 years or more.
Any gains above that are taxed at only a maximum 20% rate. These are the best tax breaks you can get anywhere without being a member of the 1%. Profits can also be deducted on the sale of a house if you buy another one at the equivalent value within 18 months.
7) There is No Overbuilding Anywhere
You know those forests of cranes that blighted the landscape in 2020? They are nowhere to be seen.
The other signs of excess speculation, liar’s loans, artificially high appraisals, and rapid flipping no longer exist. Much of this is now illegal, thanks to new regulations.
No bubble means no crash. Prices should just continue grinding upwards in a very boring, non-volatile way.
So the outlook is pretty rosy for individual homeownership for the foreseeable future.
Just don’t forget to sell by 2030 when the demographics reverse.
That's when the next round of trouble begins.

For Sale
Global Market Comments
September 3, 2025
Fiat Lux
Featured Trade:
(TESTIMONIAL)
(HOW TO SPOT A MARKET TOP),
(SPY), (NFLX), (TSLA), (PLTR), (LEN), (TLT), (BAC), (MS), (GS)
Global Market Comments
August 29, 2025
Fiat Lux
Featured Trade:
(AUGUST 27 BIWEEKLY STRATEGY WEBINAR Q&A),
(BA), (FXI), (SPY), (QQQ), (CCJ), (VSTR), (LEN), (PHM), (KBH), (RKT), (JPM), (BAC), (GS), (MS), (CCI), (DHI), (GLD), (MSTR), (TLT)

Global Market Comments
August 15, 2025
Fiat Lux
Featured Trade:
(AUGUST 13 BIWEEKLY STRATEGY WEBINAR Q&A),
(ALB), (TSLA), (FCX), (GLD), (NVDA), (TLT)