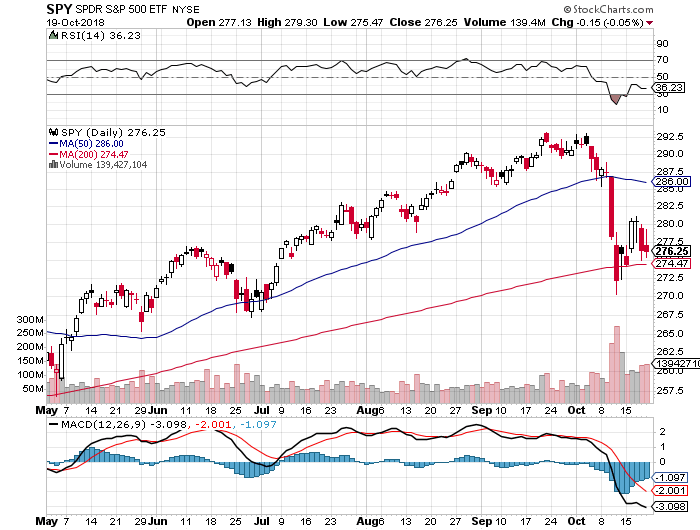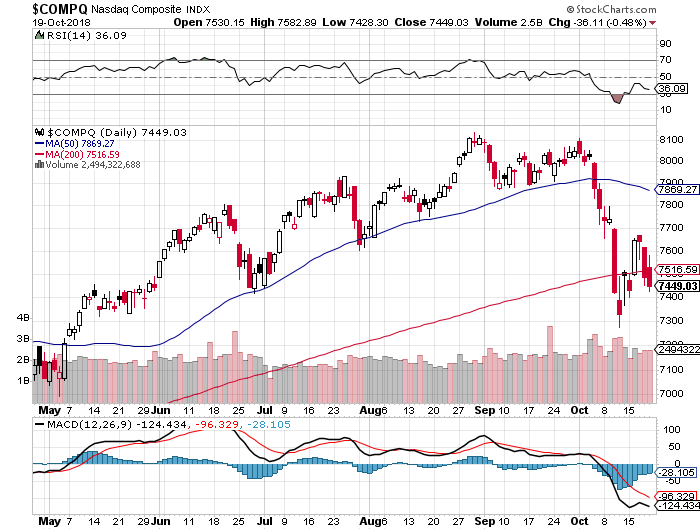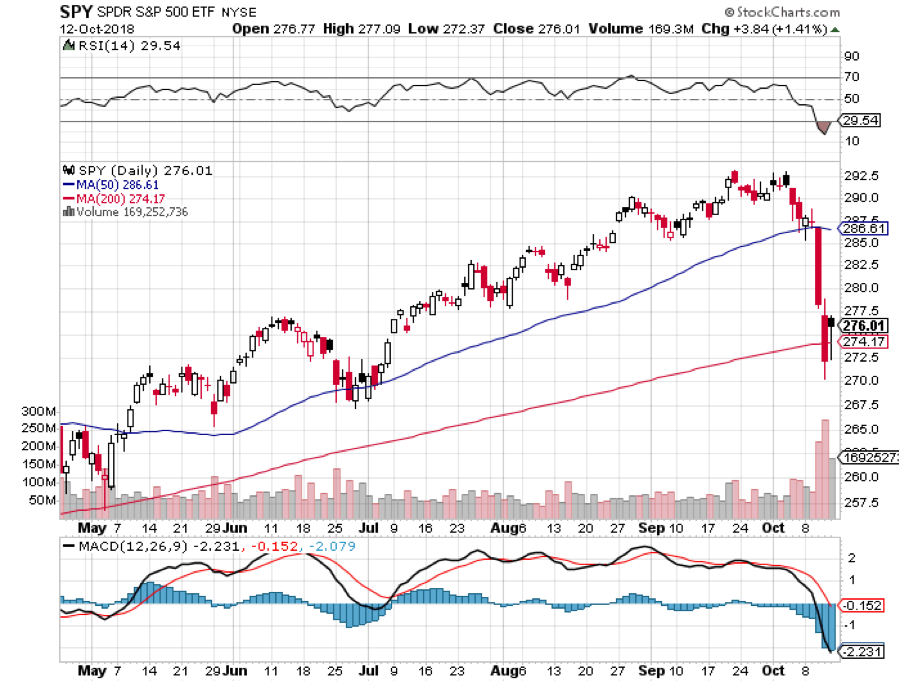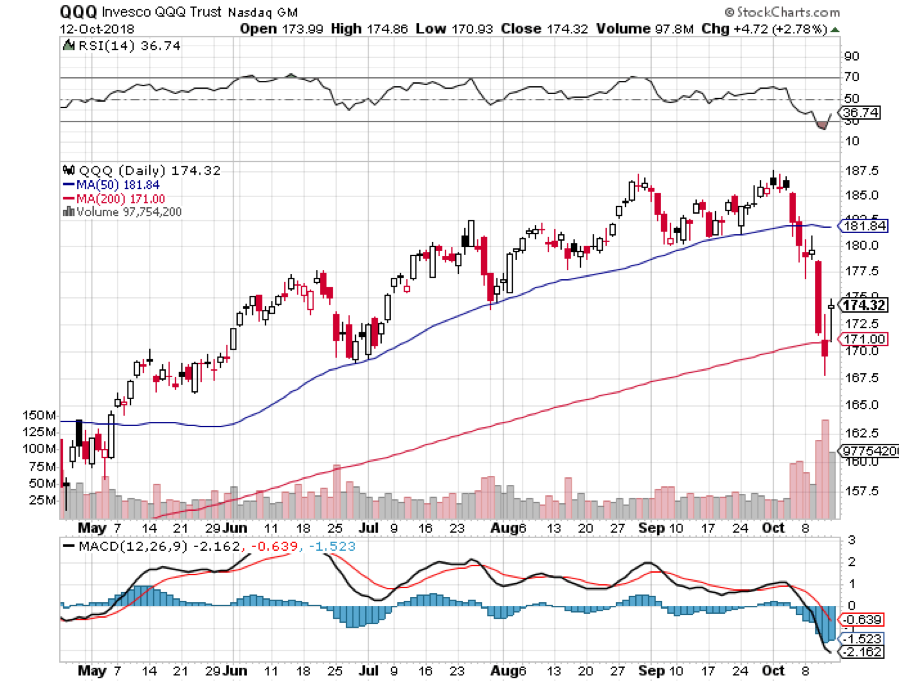
If you missed 2018, you get to do it all over again. That’s what the major indexes are offering us after giving up all of this year’s gains, and then some.
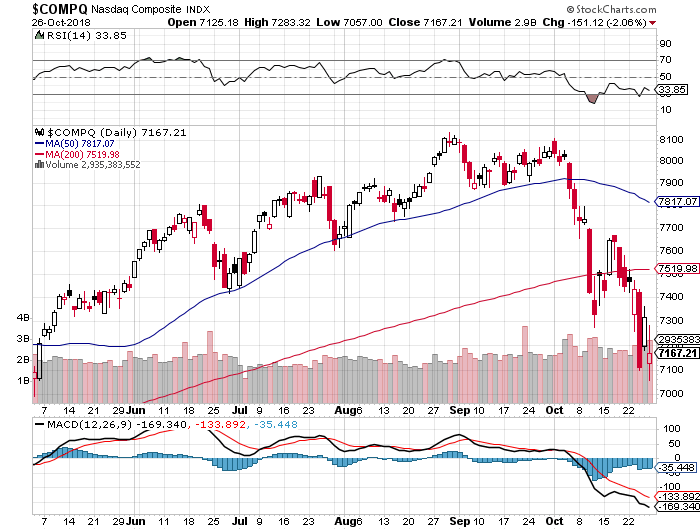
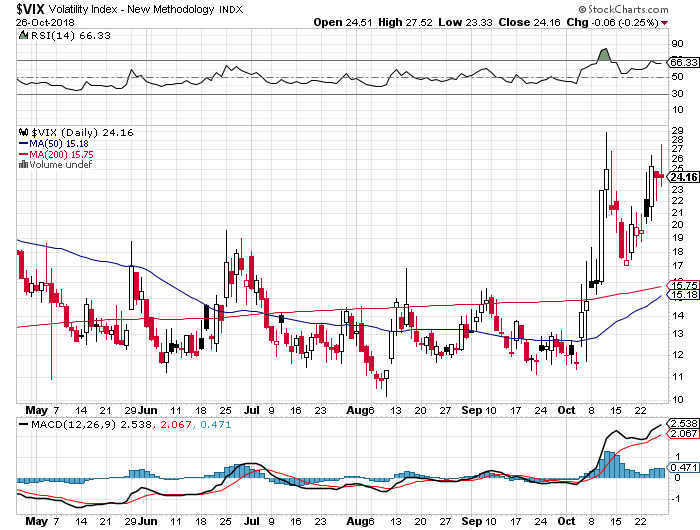
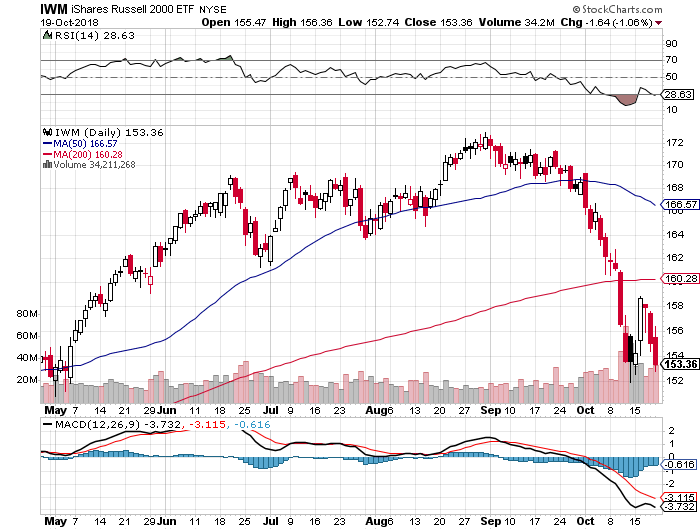
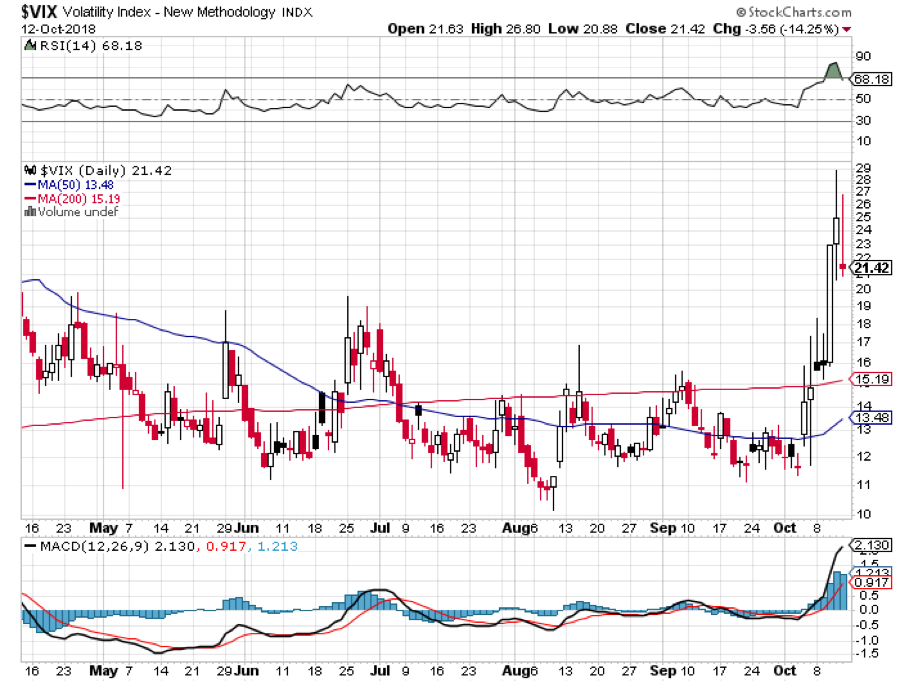
We go into the coming week with markets giving their most oversold readings since the popping of the 2000 Dotcom bubble and the 1987 crash. Markets are shouting imminent recession loud and clear.
Except that markets have discounted 13 out of the last six recessions and it is currently discounting one of those non-recessions.
Here is my calendar of upcoming potential market bottoms. Please note that all are within the next seven trading days.
October 29-reversal day of the Friday selloff.
October 31-rebalancing of funds will require a large amount of equity buying for month end. Facebook (FB) reports.
November 1-the Apple (AAPL) earnings are out.
November 7-the midterm elections.
There is no way that we are going into a recession and a bear market now. That is 2019 business. Bear markets don’t begin with real interest rates at zero which they are at now (3.1% ten-year Treasury yield – 3.1% inflation rate = zero). And they may well still be at zero in a year (4% ten-year Treasury yield – 4% inflation rate= zero).
Earnings are still great in the technology area, 50% of the national total. The Dotcom market top was characterized by the collection of vast numbers of eyeballs, not actual cash.
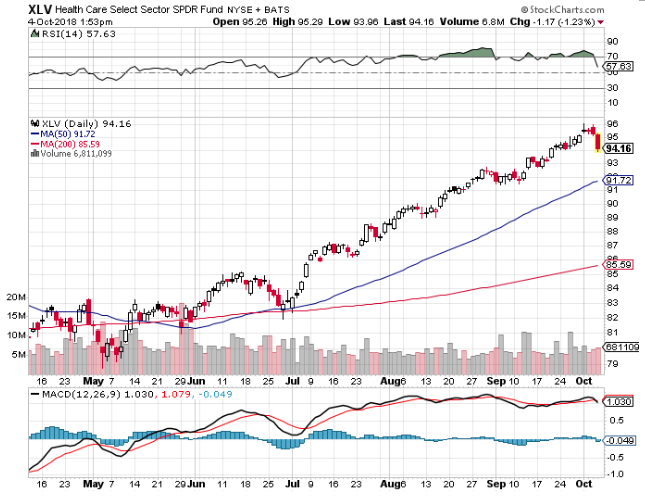
This means that you want to buy the big dips. This is the best entry point for blue-chip technology stocks since 2015. With a price earnings multiple now at 14.9 times 2019 earnings, stocks have given up half the valuation gains since the 2009 market bottom IN A MONTH!
Global trade is collapsing. There is no doubt that businesses massively pulled forward orders to beat the administration’s punitive import duties, thus artificially boosting the Q3 GDP numbers.
The chickens will come to roost in Q1 2019 which is what the stock market may be screaming at us right now with its nightmarish price action.
The big print of the week was the Q3 GDP at 3.5%, down substantially from the 4.2% figure for Q2. That may be the last hot number we see for many years as the tax cuts and spending burst wear off. Next year we return to the long-term average of 2.5%...I hope. If I’m wrong we’ll see zero growth in 2019.
Tesla (TSLA) announced a profit for the first time since 2016, sending the shares soaring. The stock is back up to the level that prevailed before Elon Musk’s last nervous breakdown. Tesla 3’s are flooding the streets of California.
In the meantime, the economic data remains hot with Weekly Jobless Claims still hugging an all-time low at 215,000. But it is all backward-looking data.
Of course, the highlight of the week was the Mad Hedge Lake Tahoe Conference which couldn’t have taken place in more ideal conditions. The food was outstanding, the bottles of Caymus cabernet were fast-flowing, and we even had the option of crashing the wedding in the ballroom next door (I saw some incredibly hot distant cousins).
While I lectured away on the prospects for markets and interest rates, children built sandcastles outside on the balmy Tahoe beach 20 feet away. We had a lot of doctors attend this year and I have to admit it was the first time I was offered a colonoscopy in exchange for a newsletter subscription.
Good cheer was had by all and there was a lot of exchanging of trading tips, email addresses, and phone numbers. It is clear the readers are making fortunes with my service. Most have already committed to coming back next year.
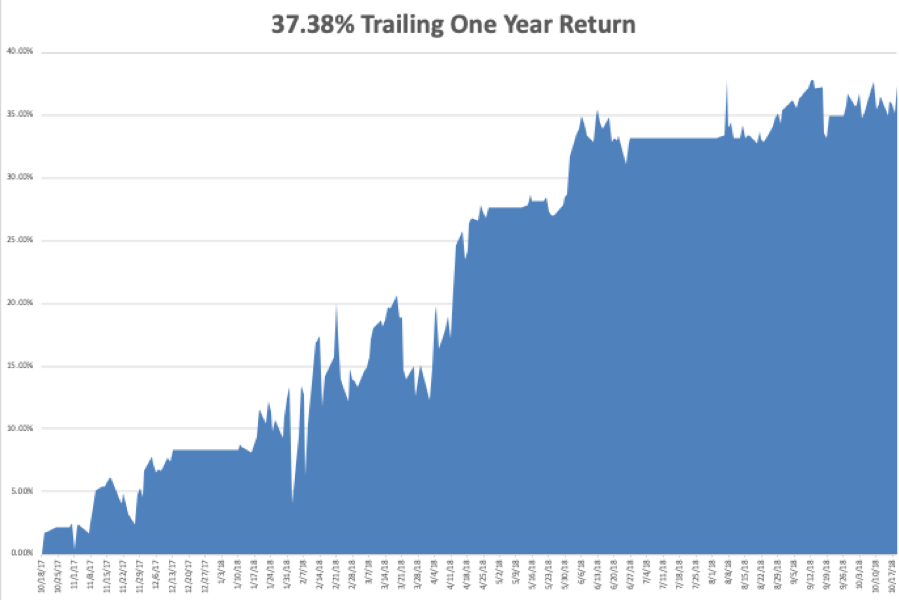
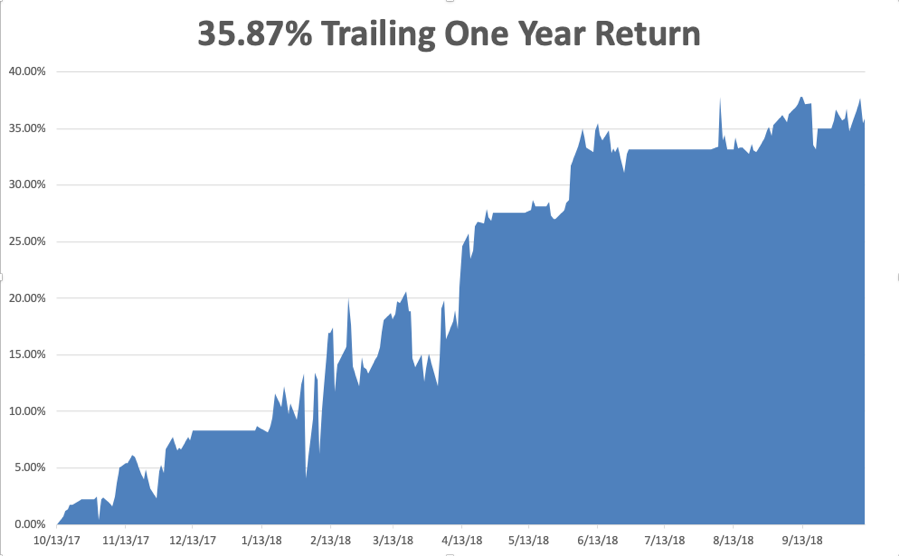
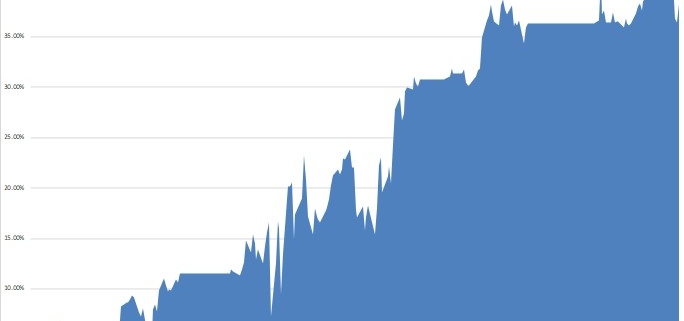
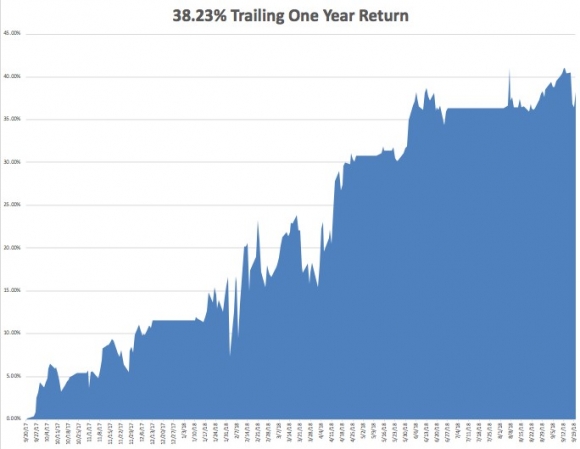
My year-to-date performance has faded to a still market-beating 22.37%, and my trailing one-year return stands at 30.68%. October is down -6.02%, despite a gut-punching, nearly instant NASDAQ swoon of 13.7%. Most people will take that in these horrific conditions.
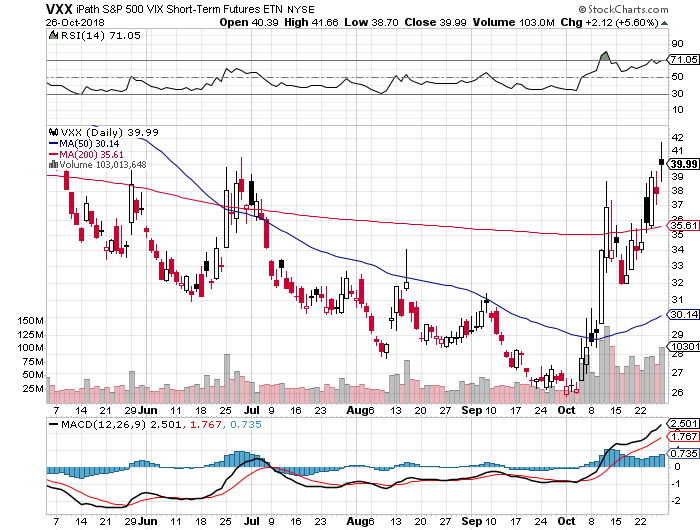
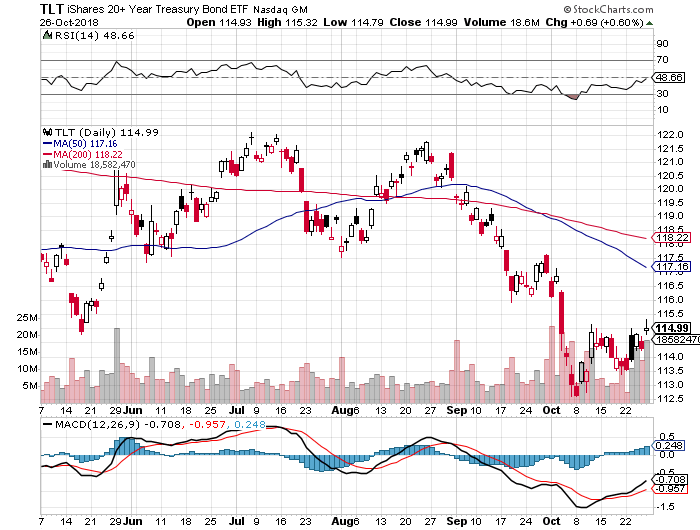
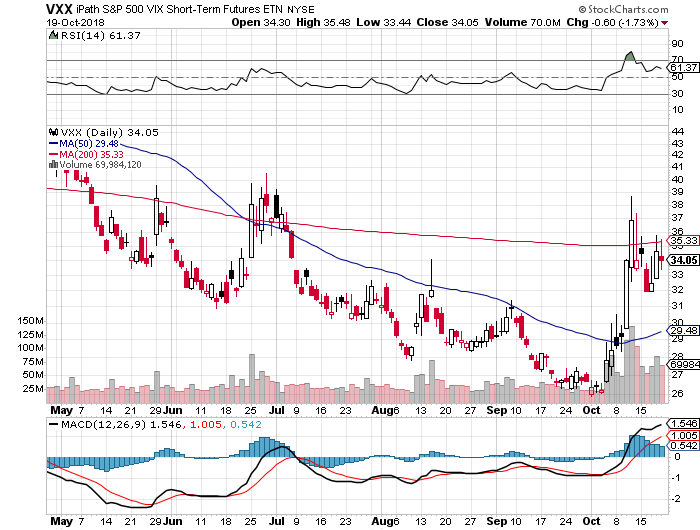
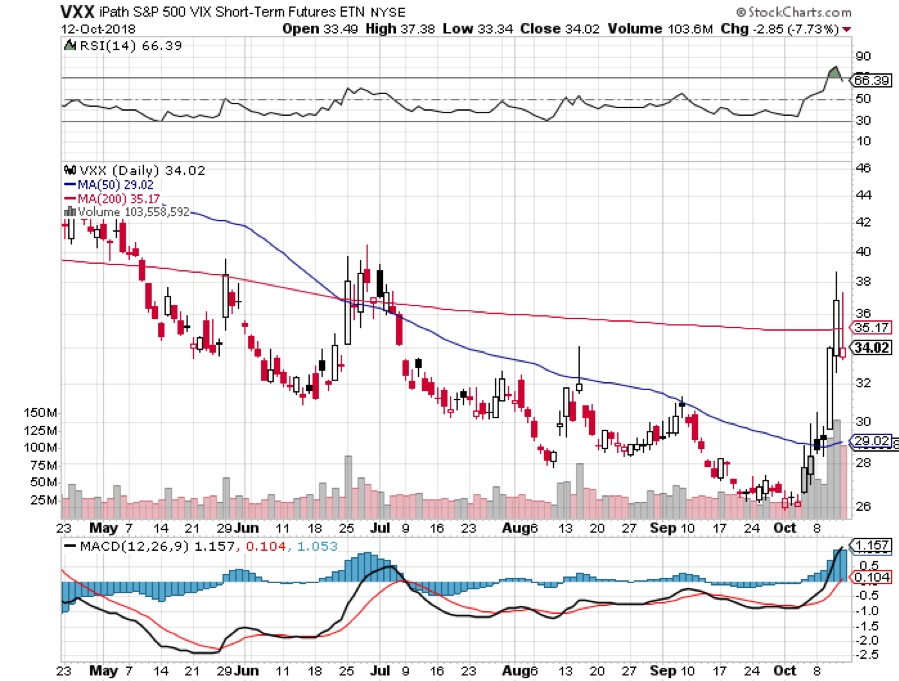
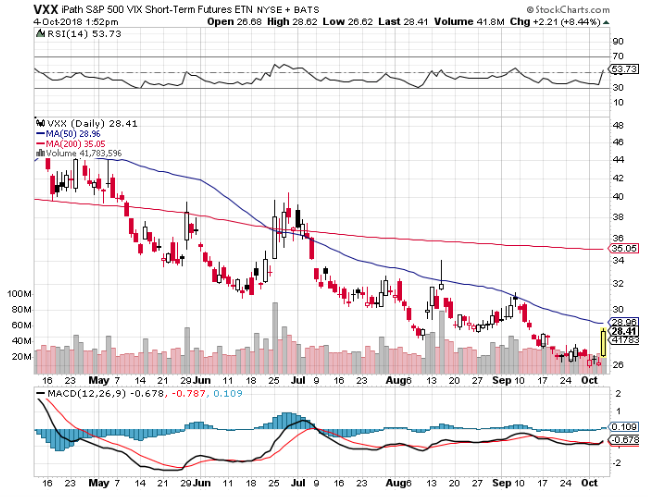
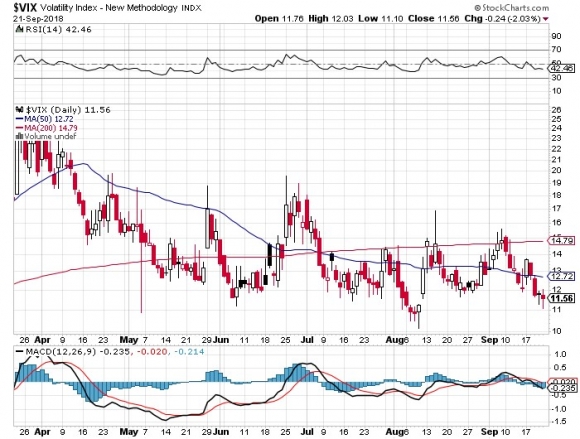
My single stock positions have been money makers, but my short volatility position (VXX), which I put on way too early, was a disaster eating up all of my profits. I bought puts with the (VXX) at $30. It hit an incredible $42 on Friday. That's why you only take on small 5% positions in outright volatility securities.
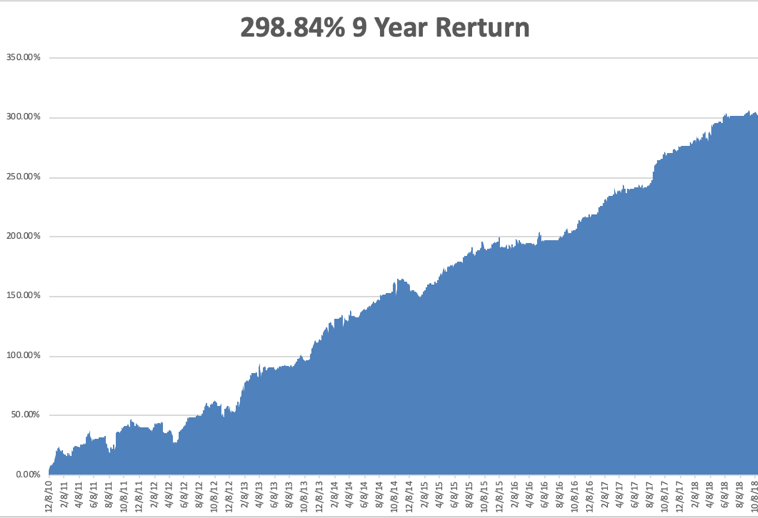
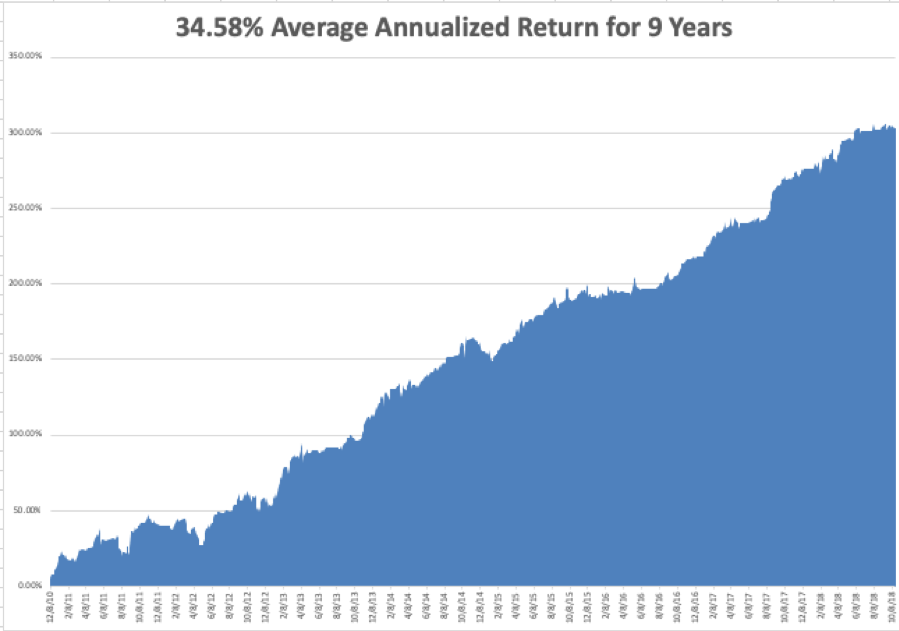
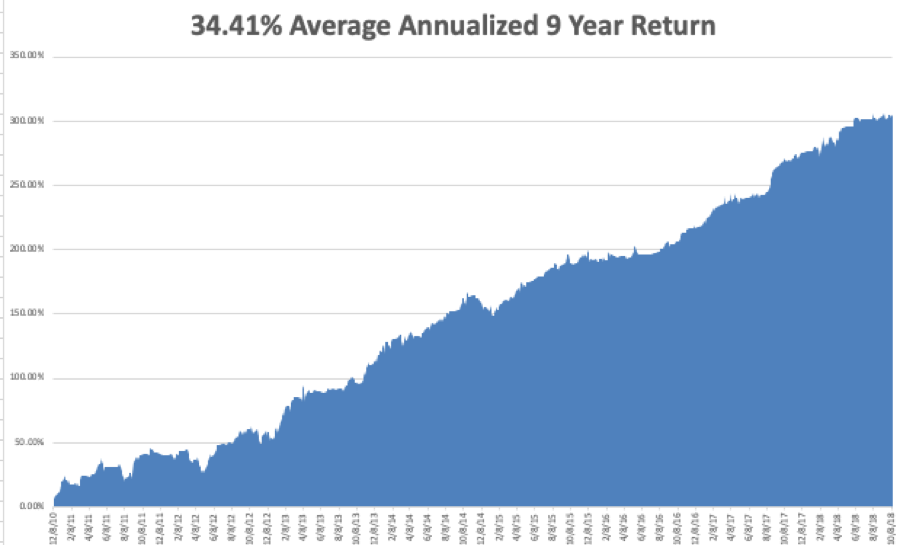
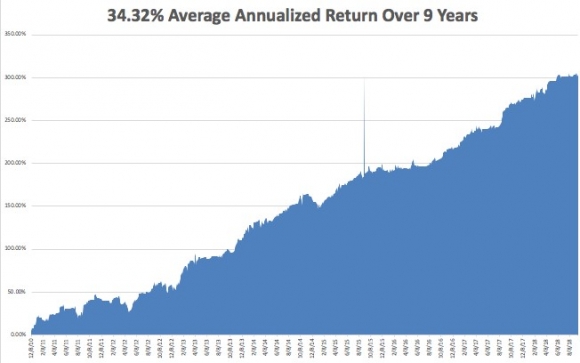
My nine-year return retreated to 298.84%. The average annualized return stands at 34.58%. Global Trading Dispatch is now only 44 basis points from an all-time high.
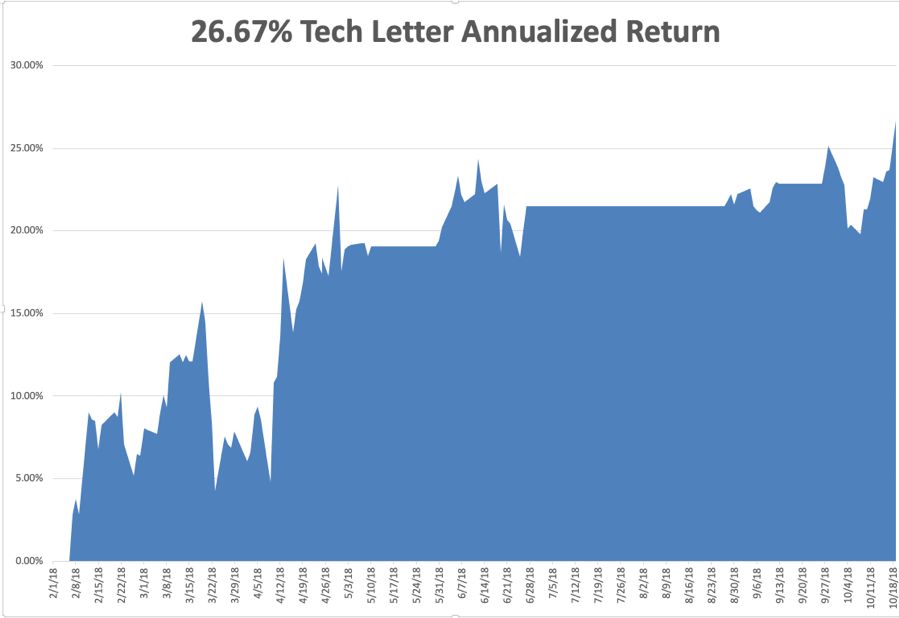
The Mad Hedge Technology Letter has done an outstanding job in October, giving back only -0.89% despite having an aggressively long portfolio. It still maintains an impressive annualized 20.31% profit. It almost completely missed the tech meltdown and then went aggressively long our favorite names right at the market bottom.
This coming week will be focused on the trifecta of jobs data and a few blockbuster technology earnings reports.
Monday, October 29 at 8:30 AM, the October Dallas Fed Manufacturing Survey is out.
On Tuesday, October 30 at 9:00 AM, the Corelogic S&P 500 Case-Shiller Home Price Index is released. Facebook (FB) and FireEye (FEYE) report. earnings.
On Wednesday, October 24 at 8:15 AM, the ADP Employment Report is published, a read on private hiring.
At 10:30 AM the Energy Information Administration announces oil inventory figures with its Petroleum Status Report.
Thursday, October 25 at 8:30, we get Weekly Jobless Claims. Apple (AAPL) reports.
On Friday, October 26, at 8:30 AM, the October Nonfarm Payroll Report is announced. The Baker-Hughes Rig Count follows at 1:00 PM.
Good luck and good trading.
John Thomas
CEO & Publisher
The Diary of a Mad Hedge Fund Trader