Followers of my Trade Alert service have noticed some unusual activity during the last two days. Instead of recommending put spreads, I have started advising the purchase of outright puts.
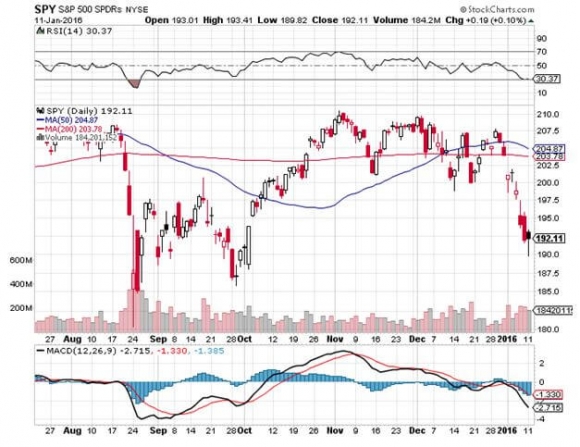
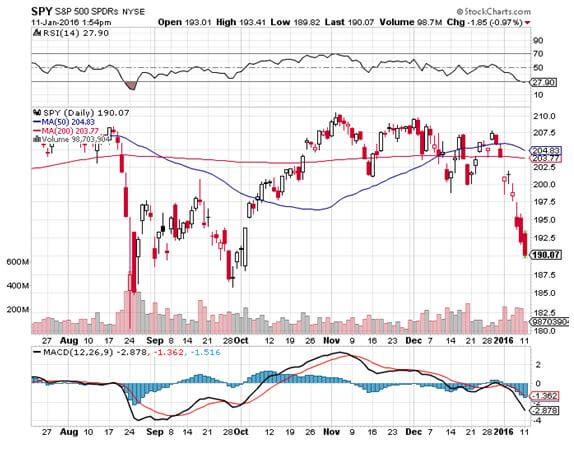
Coming on top of big declines in the S&P 500 (SPY), you may have thought that I have lost my mind, if I hadn?t already done so a long time ago.
My kids would agree with you.
However, there is a method to my madness.
The truly brilliant aspect to the option spread strategy that I have been using for the past four years was that the positions had an embedded short volatility aspect to them.
While you were long volatility with your long leg, this was offset by the short volatility in your short leg.
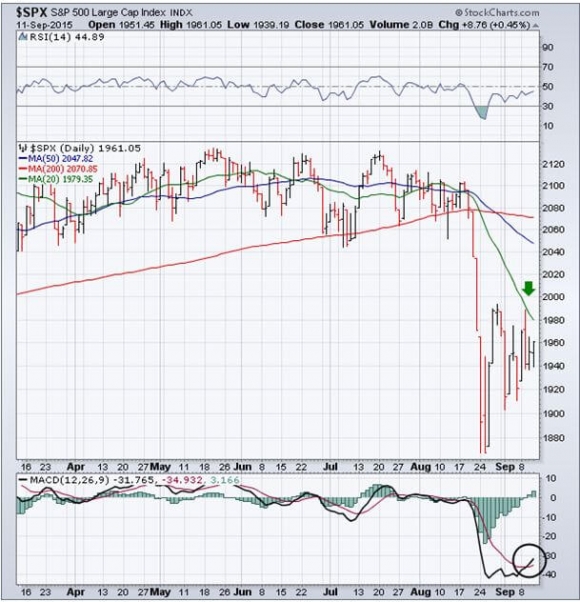
This gave you a net volatility exposure of close to zero, a great thing to have during a time of secular declining volatility, as we have seen since 2012. Think of the first eight months of 2015, when index prices barely budged.
It also meant that you could achieve your maximum profit when the underlying stock remained unchanged, or moved only a few percent against you.
The nice thing about this low volatility was that it gave time to followers to get in and out of positions before large price changes occurred. Moves of only a few cents before you received trade alerts were common.
By focusing on front month options I also took maximum advantage of accelerated time decay going into each expiration. It was like having a rich uncle write you a check every day.
The low volatility delivered only small changes in the value of your portfolio from the day-to-day movements in the market, tiny enough for the novice investor to live with.
This is what enabled me to produce huge, outsized double digit returns while most other managers were sucking wind.
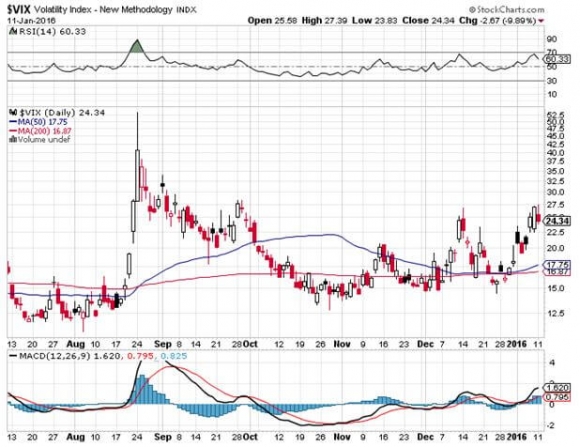
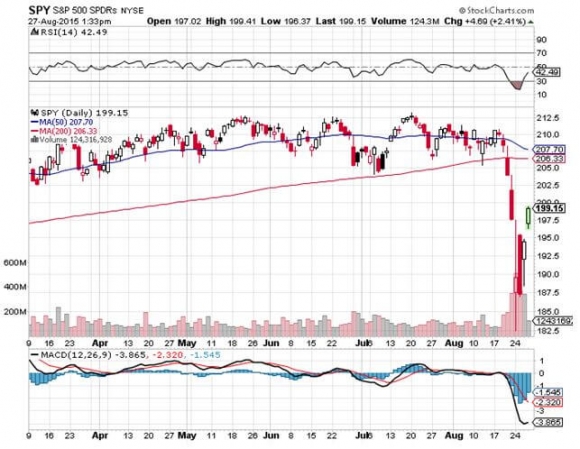
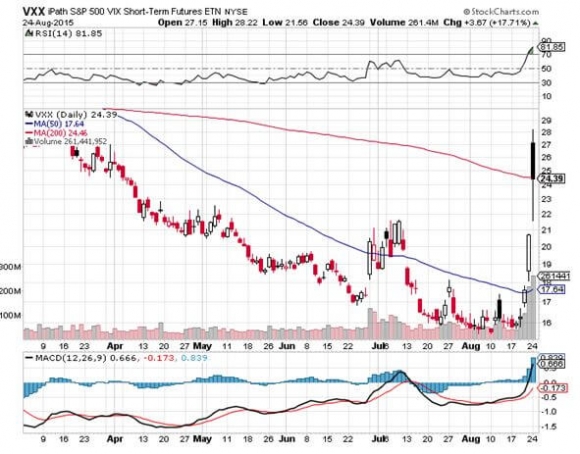
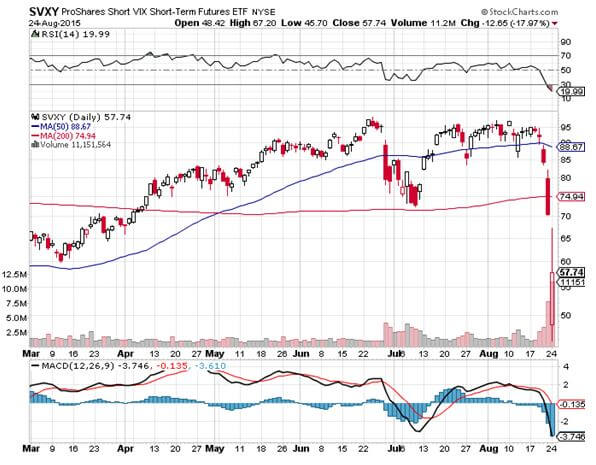
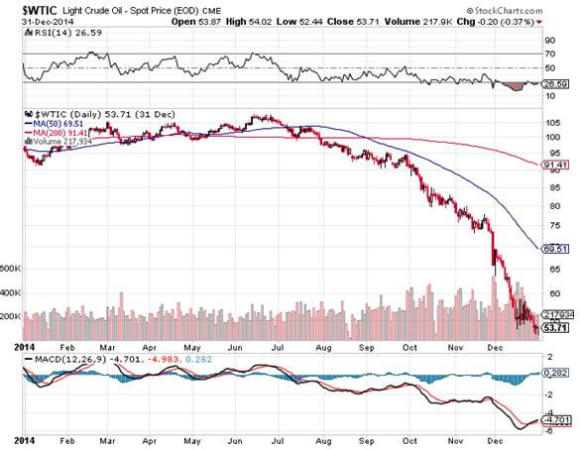
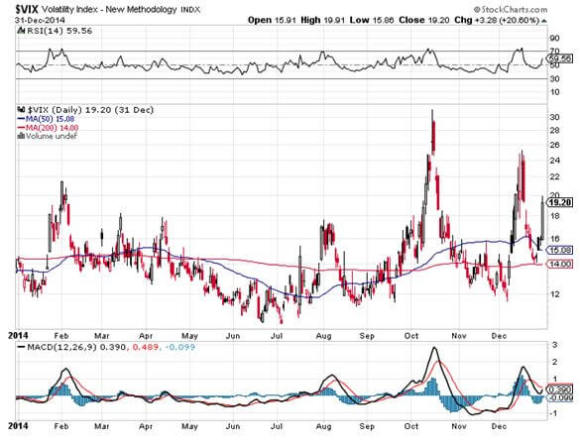
Since August 24, we have been in a completely different world. The long-term trend in volatility isn?t falling anymore. It has been rising.
What this brought to my trading book was a series of stop outs on options spread positions, whether they were call spreads or put spreads, and painful losses.
This is why I lost money in two out of three months in the recent quarter, a rare event. Having an embedded short volatility position was alas costing me money.
So it is time to adjust our strategy to reflect this brave new, and more volatile world.
So instead of running positions into expiration, I am going to start hedging them with options when a breakdown in the market appears imminent.
This is why I picked up the February $190 puts on Friday to hedge my January $185-$190 calls spread. It is also why I bought the February $187 puts to hedge my January $182-$187 call spread.
Why the mismatch in expirations? It ducks the problem of final week super accelerated time decay with my long puts. It also means I can continue with the short positions after the Friday January expiration, if I choose to do so.
There is one complication with this approach. Individual options are vastly more volatility than option spreads. So it won?t be unusual for an option to move 5%-10% by the time you receive the Trade Alerts. To be forewarned is to be forearmed.
Let?s look at out current positions as examples. For further analysis you have to be familiar with the concept of on option delta. Delta is a letter of the Greek alphabet used by traders to refer to the movement of an option relative to its underlying security.
A delta of 10% means that a $1 move in the underlying produces a 10-cent move in the option, which you see in deep out-of-the-money options. A delta of 90% means that a $1 move in the underlying produces a 90-cent move in the option, which is found with deep-in-the-money options.
The January $185-$190 vertical call debit spread had two legs, and the delta can be calculated as following:
A long January 185 call with a delta of +19%
A short January 190 call with a delta of -39% (negative since you are short)
This gives you a net delta of (39% - 19%) = -20%.
In other words, a $1 move down in the underlying (SPY) index only moves the $185-$190 call spread south by -20 cents.
In the case of the $182-$187 call spread, the net delta is only 14%, giving you a move in the spread of only 14 cents for the $1 (SPY) move.
Let?s say that the market looks like it is going to pieces and I want to hedge my downside exposure. That means I need to buy puts against my long call spread.
Since my net delta is only -20% on the January $185-$190 vertical call debit spread, I only need to buy 20% as many puts to neutralize the position, or 0.2 X 22 = 4.4 options.
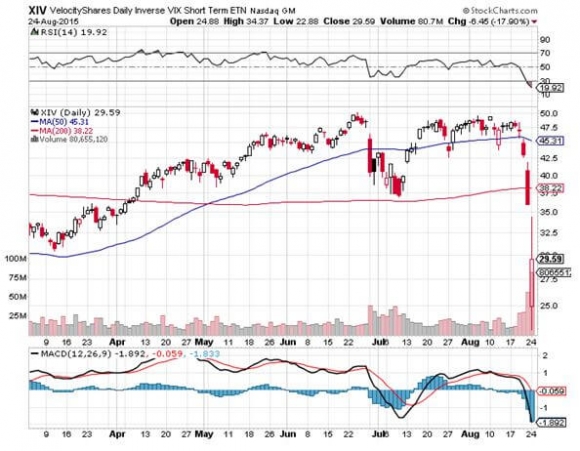
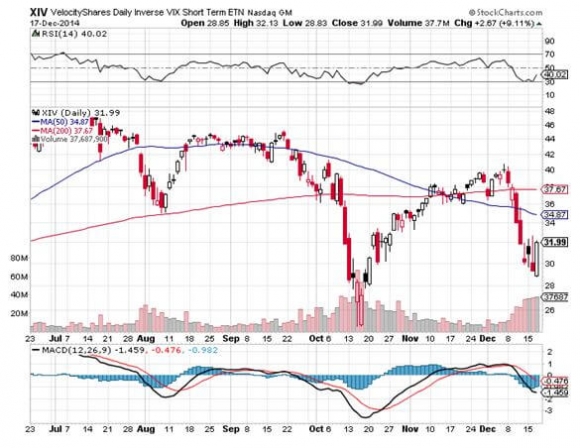
To be more aggressive on the downside I increased my put purchase to 13 contracts to also provide extra downside protection of my short volatility (XIV) position. I then repeated this exercise on Monday for the $182-$187 vertical call debit spread.
What we end up with is a portfolio that is profitable at all points with a Friday January 15 (SPY) options expiration between $187-$194. Now you don?t have to touch the position, unless we break out of that range.
This prevents you from attempting to trade every triple digit ratchet in the market between now and then. This is a hopeless exercise. I know because I have tried it many times, to no avail.
Yes, I know this all sounds complicated. But this is how the pros do it. This is how they make money. It?s all about preserving your capital and making incremental profits on top of it. Watch, and learn.
Learn from my errors and prosper.