I think we are only days, at the most weeks, away from the next crisis coming out of Washington. It can come for any of a dozen different reasons.
Wars with Syria, Iran or North Korea. The next escalation of the trade war with China. The failure of the NAFTA renegotiation. Another sex scandal. The latest chapter of the Mueller investigation.
And then there's the totally unexpected, out of the blue black swan.
We are spoiled for choice.
For stock investors, it's like hiking on the top of Mount Whitney during a thunderstorm with a steel ice axe in hand.
So, I am going to buy some fire insurance here while it is on sale to protect my other long positions in technology and financial stocks.
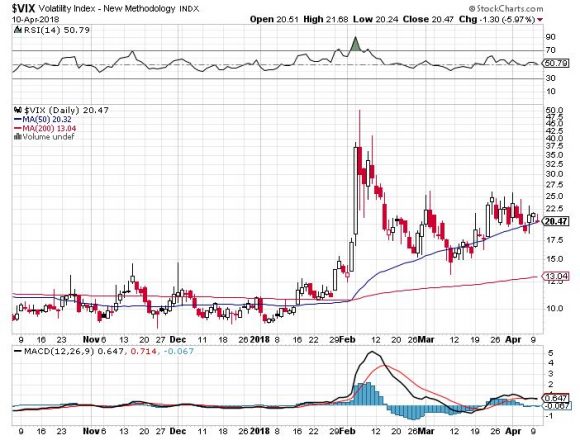
Since April 1, the Volatility Index (VIX) has performed a swan dive from $26 to $15, a decline of 42.30%.
I have always been one to buy umbrellas during parched summers, and sun tan lotion during the frozen depths of winter. This is an opportunity to do exactly that.
Until the next disaster comes, I expect the (VXX) to trade sideways from here, and not plumb new lows. These days, a premium is paid for downside protection.
The year is playing out as I expected in my 2018 Annual Asset Class Review (Click here for the link.). Expect double the volatility with half the returns.
So far, so good.
If you don't do options buy the (VXX) outright for a quick trading pop.
You may know of the Volatility Index from the many clueless talking heads, beginners, and newbies who call (VIX) the "Fear Index."
For those of you who have a PhD in higher mathematics from MIT, the (VIX) is simply a weighted blend of prices for a range of options on the S&P 500 index.
The formula uses a kernel-smoothed estimator that takes as inputs the current market prices for all out-of-the-money calls and puts for the front month and second month expirations.
The (VIX) is the square root of the par variance swap rate for a 30-day term initiated today. To get into the pricing of the individual options, please go look up your handy-dandy and ever-useful Black-Scholes equation.
You will recall that this is the equation that derives from the Brownian motion of heat transference in metals. Got all that?
For the rest of you who do not possess a PhD in higher mathematics from MIT, and maybe scored a 450 on your math SAT test, or who don't know what an SAT test is, this is what you need to know.
When the market goes up, the (VIX) goes down. When the market goes down, the (VIX) goes up. Period.
End of story. Class dismissed.
The (VIX) is expressed in terms of the annualized movement in the S&P 500, which today is at $806.06.
So, for example, a (VIX) of $15.48 means that the market expects the index to move 4.47%, or 121.37 S&P 500 points, over the next 30 days.
You get this by calculating $15.48/3.46 = 4.47%, where the square root of 12 months is 3.46 months.
The volatility index doesn't really care which way the stock index moves. If the S&P 500 moves more than the projected 4.47%, you make a profit on your long (VIX) positions. As we know, the markets these tumultuous days can move 4.47% in a single day.
I am going into this detail because I always get a million questions whenever I raise this subject with volatility-deprived investors.
It gets better. Futures contracts began trading on the (VIX) in 2004, and options on the futures since 2006.
Since then, these instruments have provided a vital means through which hedge funds control risk in their portfolios, thus providing the "hedge" in hedge fund.
If you make money on your (VIX) trade, it will offset losses on other long positions. This is how the big funds most commonly use it.
If you lose money on your long (VIX) position, it is only because all your other long positions went up.
But then no one who buys fire insurance ever complains when their house doesn't burn down.
"Chance Favors the Prepared," said French scientist Louis Pasteur.
https://www.madhedgefundtrader.com/wp-content/uploads/2018/04/John-and-swans-story-1-image-4-e1524088218881.jpg250300MHFTRhttps://madhedgefundtrader.com/wp-content/uploads/2019/05/cropped-mad-hedge-logo-transparent-192x192_f9578834168ba24df3eb53916a12c882.pngMHFTR2018-04-19 01:07:062018-04-19 01:07:06Diving Back Into the (VIX)
Featured Trade:
(THE MARKET OUTLOOK FOR THE WEEK AHEAD, or THE WEEK THAT NOTHING HAPPENED),
(TLT), (GLD), (SPY), (QQQ), (USO), (UUP),
(VXX), (GOOGL), (JPM), (AAPL),
(HOW TO HANDLE THE FRIDAY, APRIL 20 OPTIONS EXPIRATION), (TLT), (VXX), (GOOGL), (JPM)
This was the week that American missiles were supposed to rain down upon war-torn Syria, embroiling Russia in the process. It didn't happen.
This was the week that the president was supposed to fire special prosecutor Robert Mueller, who with his personal lawyer is currently reading his private correspondence for the past decade with great interest. That didn't happen either.
It was also the week that China was supposed to raise the stakes in its trade war with the United States. Instead, President Xi offered a conciliatory speech, taking the high road.
What happens when you get a whole lot of nothing?
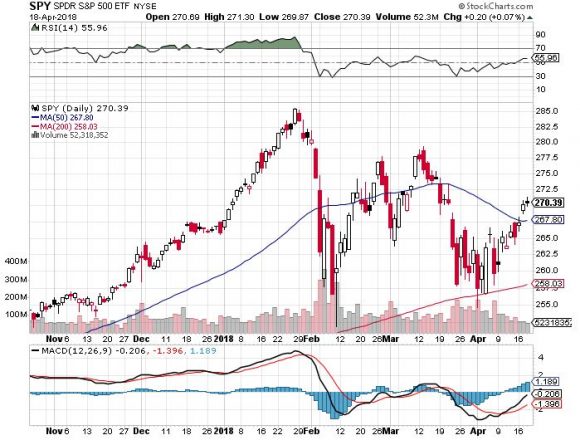
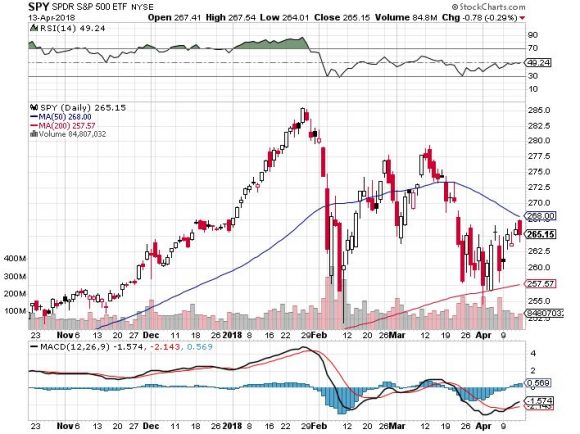
Stocks rally smartly, the S&P 500 (SPY) rising by 2.87% and the NASDAQ (QQQ) tacking on an impressive 3.45%. Several of the Mad Hedge long positions jumped by 10%.
And that pretty much sums up the state of the market today.
Get a quiet week and share prices will naturally rise, thanks to the power of that fastest earnings growth in history, stable interest rates, a falling dollar, and gargantuan share buybacks that are growing by the day.
With a price earnings multiple of only 16, shares are offering investors the best value in three years, and there is very little else to buy.
This is why I am running one of the most aggressive trading books in memory with a 70% long 30% short balance.
Something else unusual happened this week. I added my first short position of the year in the form of puts on the S&P 500 right at the Friday highs.
And, here is where I am sticking to my guns on my six-month range trade call. If you buy every dip and sell every rally in a market that is going nowhere, you will make a fortune over time.
Provided that the (SPY) stays between $250 and $277 that is exactly what followers of the Mad Hedge Fund Trader are going to do.
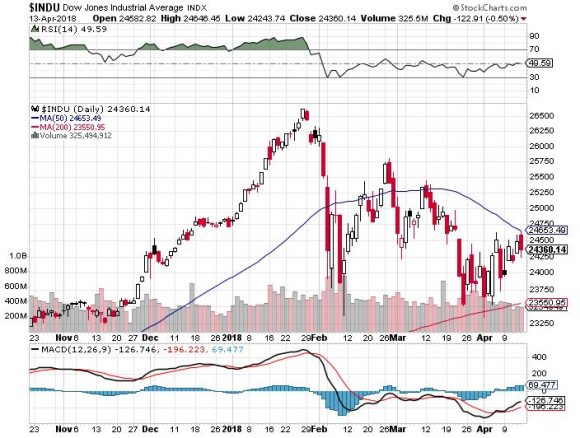
By the way, 3 1/2 months into 2018, the Dow Average is dead unchanged at 24,800.
Will next week be so quiet?
I doubt it, which is why I'm starting to hedge up my trading book for the first time in two years. Washington seems to be an endless font of chaos and volatility, and the pace of disruption is increasing.
The impending attack on Syria is shaping up to more than the one-hit wonder we saw last year. It's looking more like a prolonged air, sea, and ground campaign. When your policies are blowing up, nothing beats like bombing foreigners to distract attention.
Expect a 500-point dive in the Dow Average when this happens, followed by a rapid recovery. Gold (GLD) and oil prices (USO) will rocket. The firing of Robert Mueller is worth about 2,000 Dow points of downside.
Followers of the Mad Hedge Trade Alert Service continued to knock the cover off the ball.
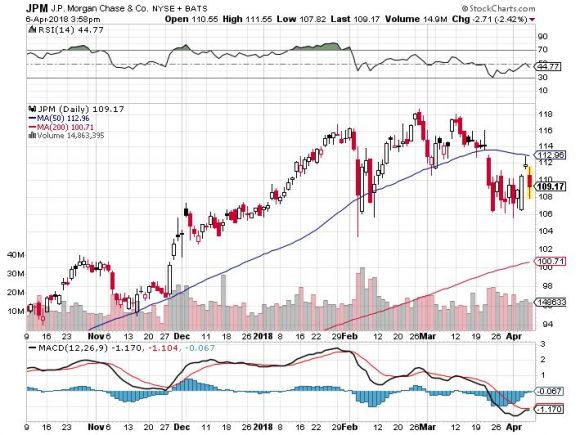
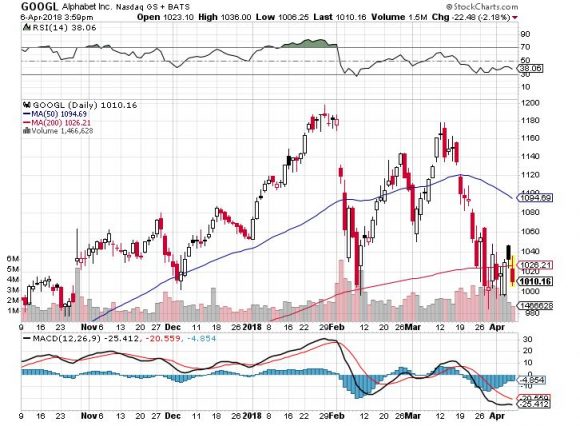
I continued to use weakness to scale into long in the best technology companies Alphabet (GOOGL) and banks J.P. Morgan Chase (JPM), and Citigroup (C). A short position in the Volatility Index (VXX) is a nice thing to have during a dead week, which will expire shortly.
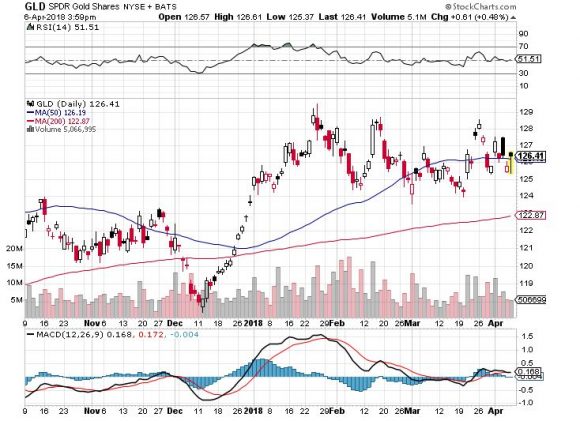
As hedges, I'm running a double short in the bond market (TLT) and a double long in gold (GLD). And then there is the aforementioned short position in the (SPY). I just marked to market my trading book and all 10 positions are in the money.
Finally, I took profits in my Apple (AAPL) long, which I bought at the absolute bottom during the February 9 meltdown. I expect the stock to hit a new all-time high in the next several weeks.
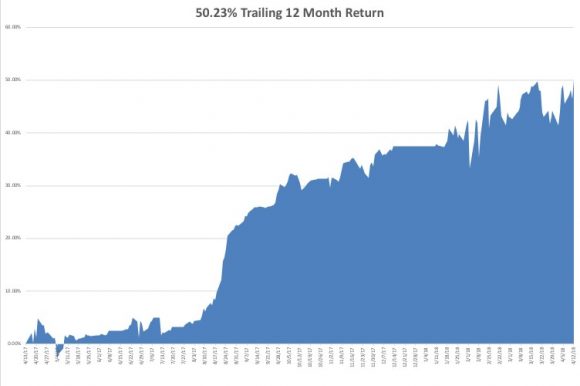
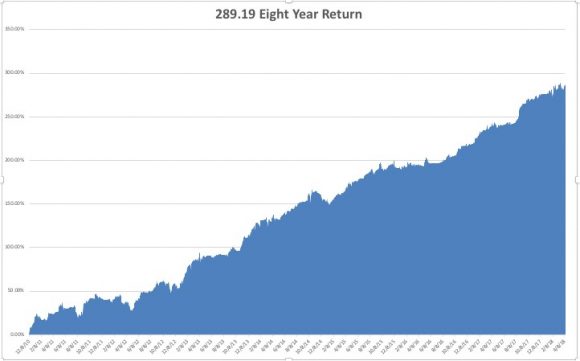
That brings April up to a +5.81% profit, my trailing one-year return to +50.23%, and my eight-year average performance to a new all-time high of 289.19%. This brings my annualized return up to 34.70%.
The coming week will be a slow one on the data front. However, there has been a noticeable slowing of the data across the board recently.
Is this a one-off weather-related event, or the beginning of something bigger? Is the trade war starting to decimate confidence and drag on the economy?
On Monday, April 16, at 8:30 AM, we get March Retail Sales. Bank of America (BAC) and Netflix (NFLX) report.
On Tuesday, April 17, at 8:30 AM EST, we receive March Housing Starts. Goldman Sachs (GS) and United Airlines (UAL) report.
On Wednesday, April 18, at 2:00 PM, the Fed Beige Book is released, giving an insider's view of our central bank's thinking on interest rates and the state of the economy. Morgan Stanley (MS) and American Express (AXP) report.
Thursday, April 19, leads with the Weekly Jobless Claims at 8:30 AM EST, which saw a fall of 9,000 last week. Blackstone (BX) and Nucor (NUE) report.
On Friday, April 20, at 10:00 AM EST, we get the Baker Hughes Rig Count at 1:00 PM EST. Last week brought an increase of 8. General Electric (GE) and Schlumberger (SLB) report.
As for me, I'll be heading into San Francisco's Japantown this weekend for the annual Northern California Cherry Blossom Festival. I'll be viewing the magnificent flowers, listening to the Taiko drums, eating sushi, and practicing my rusty Japanese.
Good Luck and Good Trading.
https://www.madhedgefundtrader.com/wp-content/uploads/2018/04/Japan-pix-story-1-image-6.jpg330219MHFTRhttps://madhedgefundtrader.com/wp-content/uploads/2019/05/cropped-mad-hedge-logo-transparent-192x192_f9578834168ba24df3eb53916a12c882.pngMHFTR2018-04-16 01:07:542018-04-16 01:07:54The Market Outlook for the Week Ahead, or The Week That Nothing Happened
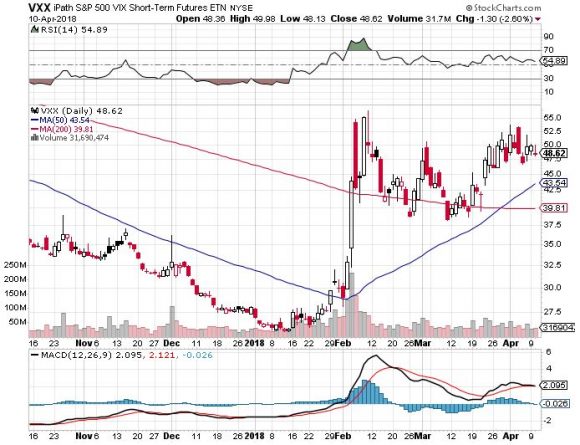
I have been trading the Volatility Index (VIX) since it was first created in 1993.
Let me tell you, the Volatility Index we have today is not your father's Volatility Index.
The (VIX) was originally a weighted measure of the implied volatility of just eight S&P 100 at-the-money put and call options.
Ten years later, in 2004, it expanded to use options based on a broader index, the S&P 500, which allows for a more accurate view of investors' expectations on future market volatility. That formula continues until today.
There were two generational lows in the (VIX) that have taken place since inception.
The first was in 1998 during the heyday of the mammoth hedge fund Long-Term Capital Management. The firm sold short volatility down to the $8 level and used the proceeds to buy every bullish instrument in the universe, from Japanese equities to Danish mortgage bonds and Russian government debt.
Then the Russian debt default took place and the (VIX) rocketed to $40. LTCM suffered losses in excess of 125% of its capital, and went under in two weeks. It took two years to unwind all the positions, while the (VIX) remained $40 for a year.
To learn more detail about this unfortunate chapter in history, please read When Genius Failed by Roger Lowenstein. The instigator of this whole strategy, John Meriwether, once tried to hire me and is now safely ensconced in a massive estate at Pebble Beach, CA.
The second low came in January of 2018, when the (VIX) traded down to the $9 handle. This time around, short exposure was industrywide. By the time the (VIX) peaked on the morning of February 6, some $8 billion in capital was wiped out.
So here we are back with a (VIX) of $20.48. But I can tell you that there is no way we have a (VIX) $20.48 market.
This is because (VIX) is calculated based on a daily closing basis. It in no way measures intraday volatility, which lately has become extreme.
During 11 out of the last 12 trading days, the S&P 500 intraday range exceeded 2%. This is unprecedented in stock markets anywhere any time.
It has driven traders to despair, driven them to tear their hair out, and prompted consideration of early retirements. The price movements imply we are REALLY trading at a (VIX) of $50 minimum, and possibly as high as $100.
Of course, everyone blames high frequency traders, which go home flat every night, and algorithms. But there is a lot more to it than that.
Heightened volatility is normal in the ninth year of a bear market. Natural buyers diminish, and volume shrinks.
At this point the only new money coming into equities is through corporate share buybacks. That makes us hostage to a new cycle, that of company earnings reports.
Firms are now allowed to buy their own stock in the run up to quarterly earnings reports to avoid becoming afoul of insider trading laws. So, the buyers evaporate a few weeks before each report until a few weeks after.
So far in 2018 this has created a cycle of stock market corrections that exactly correlate with quiet periods. This is when the Volatility Index spikes.
And because the entire short volatility industry no longer exists, the (VIX) soars higher than it would otherwise because there are suddenly no sellers.
So, what happens next when companies start reporting Q1, 2018 earnings? They announce large increases in share buybacks, thanks to last year's tax bill. And a few weeks later stocks take off like a scalded chimp, and the (VIX) collapses once again.
That's why the Mad Hedge Fund Trader Alert Service is short the (VIX) through the IPath S&P 500 VIX Short Term Futures ETN (VXX) April, 2018 $60-$65 in-the-money vertical bear put spread.
Just thought you'd like to know.
https://www.madhedgefundtrader.com/wp-content/uploads/2018/04/John-story-1-image-3-e1523400566228.jpg291200MHFTRhttps://madhedgefundtrader.com/wp-content/uploads/2019/05/cropped-mad-hedge-logo-transparent-192x192_f9578834168ba24df3eb53916a12c882.pngMHFTR2018-04-11 01:07:422018-04-11 01:07:42Trading the New Volatility
Featured Trade:
(THE MARKET OUTLOOK FOR THE WEEK AHEAD, or HERE'S THE BIG CALL),
(JPM), (GOOGL), (GLD), (TLT), (VXX),
(HOW TO "SNOWBALL" YOUR FORTUNE WITH BENJAMIN FRANKLIN)
Flamethrowers! Yes, on the list of 125 products that China is imposing new 25% import duties are flamethrowers.
And I was so looking forward to getting a flamethrower of my own with which to singe lazy and errant stock analysts from whom we all are afflicted.
I guess I'll just have to buy American, which I already do with my cars (Teslas).
The real call here is that the NASDAQ has entered a well-defined trading range, from 6,600 to 7,600, where it will remain trapped for six months until the November midterm congressional elections. After that, we will rally 10% in year-end rally.
The deep in-the-money call spread strategy I employ is ideally suited to this kind of go-nowhere market. While other traders are tearing their hair out, you'll be raking in the money every month as if you've just been adopted by a new rich uncle.
The president, absolutely cacophonous about the riches created by a rising stock market, has developed lockjaw in a falling one.
The reason was provided by trade advisor Peter Navarro, who said quite simply that the markets were wrong in their belief that trade wars decimate share prices.
My half century of trading tells that markets are never wrong, only people are.
And while the chief architect of our China trade policy has never been there, I managed to find it in 1974. It's easy. You just head east.
Here are some harsh numbers to show you how quixotic the administration policies are. By imposing $25 billion in import duties to protect dying American industries, investors cut $3 trillion off of US stock market capitalization.
That is a 120:1 risk reward AGAINST us. That's NOT the kind of trade I'm used to strapping on.
I'm sure the Chinese are thinking, "How would you like to lose another $3 trillion?" "How about a recession and bear market?" and "See you $25 billion and raise you $50 billion!"
Here is a number that gets lost in translation of the $1 trillion in two-way trade between the US and China. Some 90% of the profits accrue to the US. It is an issue that officials in Beijing have been complaining to me about for decades, which essentially makes them the low-waged manufacturing colony.
That iPhone X that Foxconn makes for $100 Apple (AAPL) sells for $1,000 in the US.
One then has to ask the cogent question, "If you're winning the game, why change the rules?"
The Chinese are not a nation you want to antagonize. They endured 2 million casualties in Korea just to inflict 50,000 on us. Chosin Reservoir looms large in my family - the best fighting retreat in history carried out by the Marine Corp.
The Chinese can also suffer more pain than Americans, with most only one or two generations out of a $300 annual per capita income.
Will the US November congressional election affect economic fundamentals" I doubt it. The mere fact that the election is out of the way is worth a 10% stock market rally into year-end.
The March Nonfarm Payroll Report was a disappointment for the second month in a row, coming in at a feeble 103,000. The headline unemployment rate remains at a decade low of 4.1%.
The stock market didn't care, with the overwhelming focus now on trade issues.
The really important numbers now, Average Hourly Earnings, were up a slightly inflationary 0.3%, but no one noticed.
The January and February reports we revised downward by a steep 50,000.
Manufacturing gained 22,000 jobs, Health Care was up 22,000, and Professional and Business Services up 33,000. Construction lost 15,000 jobs, thanks to raising interest rates.
The Broader U-6 "Discouraged Worker" unemployment rate dropped 0.2% to 8.0%, a new decade low.
As a stand-alone number, the report is not important. However, look at it in the context of a rising tide of recent, slightly negative economic data reports and one has to start to get concerned. Is it the weather, or the beginning of something larger?
We are only a week off from when the Q1, 2018 earnings season kicks off, which will probably deliver some of the strongest reports in US history.
Until then, the data reports will be relatively benign.
On Monday, April 9, nothing of note is announced.
On Tuesday, April 10, we receive March NFIB Small Business Optimism Index.
On Wednesday, April 11, at 8:30 AM EST, we learn the all-important Consumer Price Index, the most important read on inflation. Bed Bath & Beyond (BBBY) reports.
Thursday, April 12, leads with the Weekly Jobless Claims at 8:30 AM EST, which saw a dramatic rise of 24,000 last week (another bad number). BlackRock (BLK) reports.
On Friday, April 13, at 10:00 AM EST, we get the JOLTS Report on private sector job openings. It is the big day for bank earnings, with Citigroup (C), JP Morgan (JPM), and Wells Fargo (WFC) all reporting.
The week ends as usual with the Baker Hughes Rig Count at 1:00 PM EST. Last week brought a drop of 2.
Followers of the Mad Hedge Trade Alert Service enjoyed one of their best weeks in years. Executing on the views above, I nailed the market bottom, hauling in an eye-popping 5.06% in performance in a single day.
I artfully used the huge sell-off days to pile on long positions in Google (GOOGL) and JP Morgan (JPM), and sell short US Treasury bonds and volatility (VXX). On the up days I bought gold (GLD).
It all worked like a charm, and every position is now profitable.
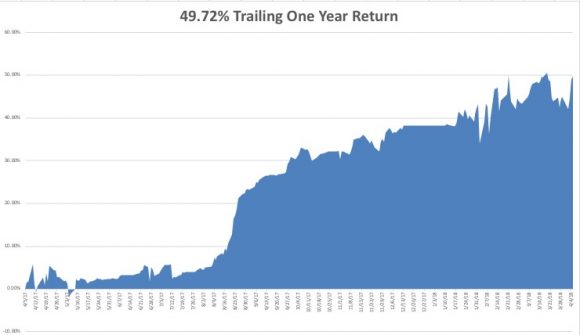
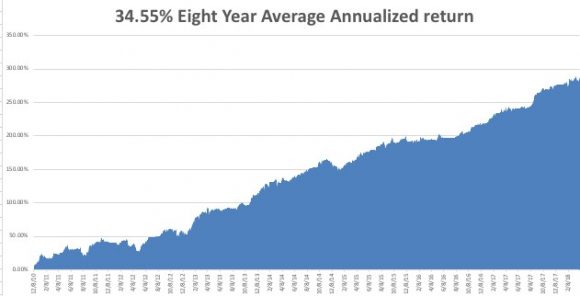
That brings April up to a +4.76% profit, my trailing one-year return to +49.72%, and my eight-year average annualized return up to 34.55%. We are an eyelash short of a new all-time performance high.
As for me, I'll be shutting down my Lake Tahoe estate for a while, not that the snow has turned to rain. The lake level is at a 118-year high, and Reno, NV, is worried about flooding. All the floodgates are open.
What a winter! I barely had time to tear myself away from my screens to visit the slopes.
Good Luck and Good Trading.
https://www.madhedgefundtrader.com/wp-content/uploads/2018/04/china-story-1-image-7-1.jpg225336MHFTRhttps://madhedgefundtrader.com/wp-content/uploads/2019/05/cropped-mad-hedge-logo-transparent-192x192_f9578834168ba24df3eb53916a12c882.pngMHFTR2018-04-09 01:07:052018-04-09 01:07:05The Market Outlook for the Week Ahead, or Here's the Big Call
Featured Trade:
(FRIDAY, JUNE 15, DENVER, CO, GLOBAL STRATEGY LUNCHEON)
(DON'T MISS THE APRIL 11 GLOBAL STRATEGY WEBINAR),
(A NOTE ON OPTIONS CALLED AWAY),
(TLT), (GOOGL), (JPM), (VXX)
With the stock market falling for the next few weeks, or even months, it's time to rehash how to profit from falling markets one more time.
There is nothing worse than closing the barn door after the horses have bolted.
No doubt, you will receive a wealth of short selling and hedging ideas from your other research sources and the media at the next market bottom. That is always how it seems to play out.
So I am going to get you out ahead of the curve, putting you through a refresher course on how to best trade falling markets now.
Market's could be down 10% by the time this is all over.
THAT IS MY LINE IN THE SAND!
There is nothing worse than fumbling around in the dark looking for the matches after a storm has knocked the power out.
I'm not saying that you should sell short the market right here. But there will come a time when you will need to do so. Watch my Trade Alerts for the best market timing. So here are the best ways to profit from declining stock prices, broken down by security type:
Bear ETFs
Of course the granddaddy of them all is the ProShares Short S&P 500 Fund (SH), a non leveraged bear ETF that is supposed to match the fall in the S&P 500 point for point on the downside. Hence, a 10% decline in the (SPY) is supposed to generate a 10% gain the in the (SH).
In actual practice, it doesn't work out like that. The ETF has to pay management operating fees and expenses, which can be substantial. After all, nobody works for free.
There is also the "cost of carry," whereby owners have to pay the price for borrowing and selling short shares. They are also liable for paying the quarterly dividends for the shares they have borrowed, around 2% a year. And then you have to pay the commissions and spread for buying the ETF.
Still individuals can protect themselves from downside exposure in their core portfolios through buying the (SH) against it (click here for the prospectus). Short selling is not cheap. But it's better than watching your gains of the last seven years go up in smoke.
Virtually all equity indexes now have bear ETF's. Some of the favorites include the (PSQ), a short Play on the NASDAQ (click here for the prospectus), and the (DOG), which profits from a plunging Dow Average (click here for the prospectus).
My favorite is the (RWM) a short play on the Russell 2000, which falls 1.5X faster than the big cap indexes in bear markets (click here for the prospectus).
Leveraged Bear ETFs
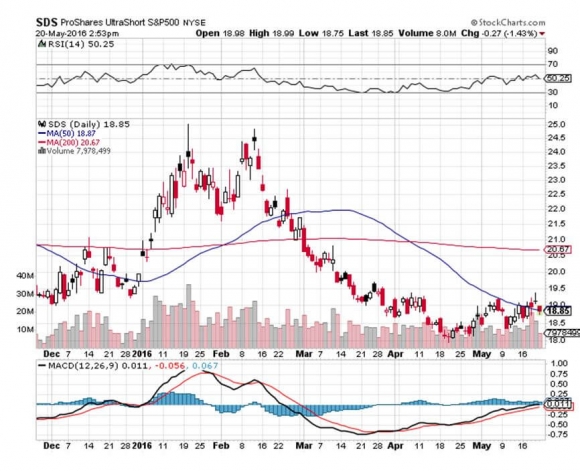
My favorite is the ProShares Ultra Short S&P 500 (SDS), a 2X leveraged ETF (click here for the prospectus). A 10% decline in the (SPY) generates a 20% profit, maybe.
Keep in mind that by shorting double the market, you are liable for double the cost of shorting, which can total 5% a year or more. This shows up over time in the tracking error against the underlying index. Therefore, you should date, not marry, this ETF or you might be disappointed.
3X Leveraged Bear ETFs
The 3X bear ETFs, like the UltraPro Short S&P 500 (SPXU), are to be avoided like the plague (click here for the prospectus).
First, you have to be pretty good to cover the 8% cost of carry embedded in this fund. They also reset the amount of index they are short at the end of each day, creating an enormous tracking error.
Eventually, they all go to zero, and have to be periodically redenominated to keep from doing so. Dealing spreads can be very wide, further added to costs.
Yes, I know the charts can be tempting. Leave these for the professional hedge fund intra day traders they are meant for.
Buying Put Options
For a small amount of capital, you can buy a ton of downside protection. For example, the April (SPY) $182 puts I bought for $4,872 allowed me to sell short $145,600 worth of large cap stocks at $182 (8 X 100 X $6.09).
Go for distant maturities out several months to minimize time decay and damp down daily price volatility. Your market timing better be good with these, because when the market goes against you, put options can go poof, and disappear pretty quickly.
That's why you read this newsletter.
Selling Call Options
One of the lowest risk ways to coin it in a market heading south is to engage in "buy writes." This involves selling short call options against stock you already own, but may not want to sell for tax or other reasons.
If the market goes sideways, or falls, and the options expire worthless, then the average cost of your shares is effectively lowered. If the shares rise substantially they get called away, but at a higher price, so you make more money. Then you just buy them back on the next dip. It is a win-win-win.
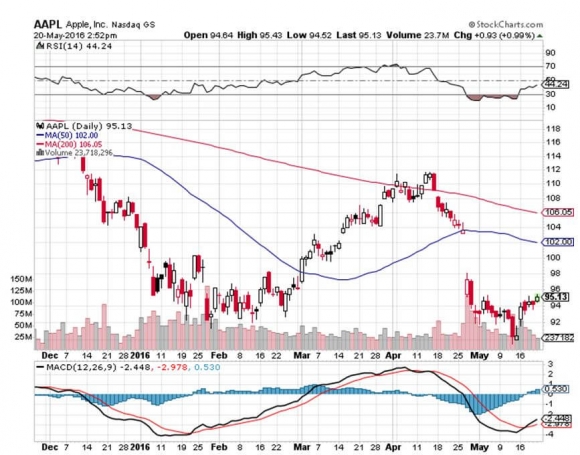
I'll give you a concrete example. Let's say you own 100 shares of Apple (AAPL), which closed on Friday at $95.13, worth $9,513. If you sell short 1 July, 2016 $100 call at $1.30 against them, you take in $130 in premium income ($1.30 X 100 because one call option contract is exercisable into 100 shares).
If Apple closes below $100 on the July 15, 2016 expiration date, the options expire worthless and you keep your stock and the premium. You are then free to repeat the strategy for the following month. If (AAPL) closes anywhere above $100 and your shares get called away, you still make money on the trade.
Selling Futures
This is what the pros do, as futures contracts trade on countless exchanges around the world for every conceivable stock index or commodity. It is easy to hedge out all of the risk for an entire portfolio of shares by simply selling short futures contracts for a stock index.
For example, let's say you have a portfolio of predominantly large cap stocks worth $100,000. If you sell short 1 June, 2016 contract for the S&P 500 against it, you will eliminate most of the potential losses for your portfolio in a falling market.
The margin requirement for one contract is only $5,000. However if you are short the futures and the market rises, then you have a big problem, and the losses can prove ruinous.
But most individuals are not set up to trade futures. The educational, financial, and disclosure requirements are beyond mom and pop investing for their retirement fund.
Most 401ks and IRAs don't permit the inclusion of futures contracts. Only 25% of the readers of this letter trade the futures market. Regulators do whatever they can to keep the uninitiated and untrained away from this instrument.
That said, get the futures markets right, and it is the quickest way to make a fortune, if your market direction is correct.
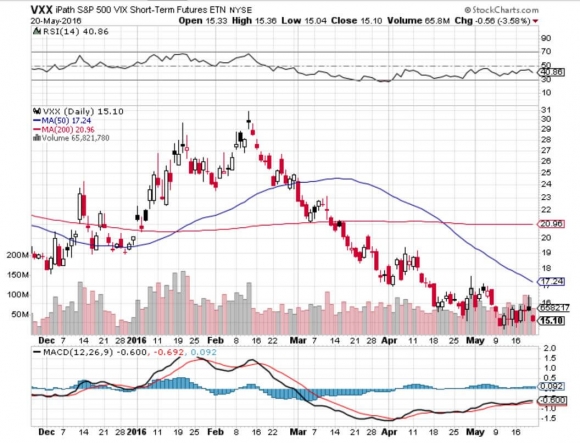
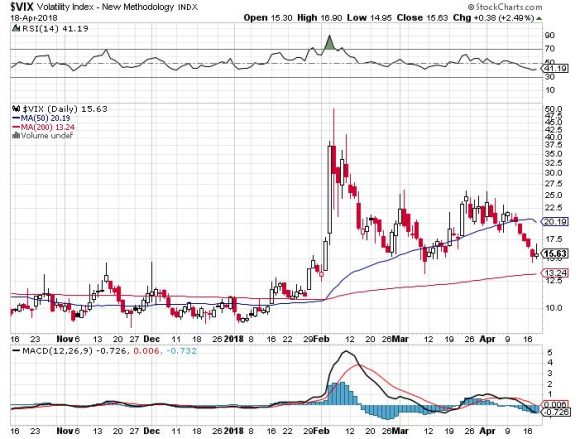
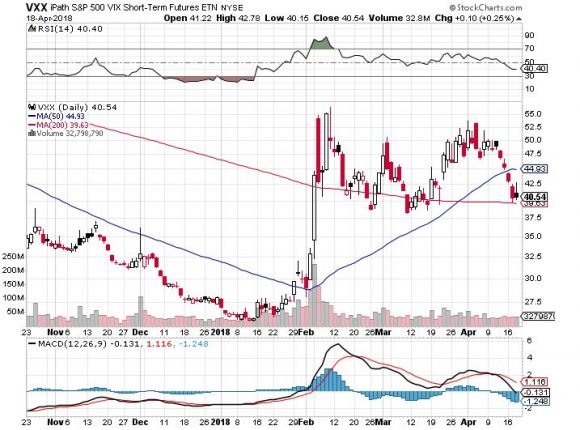
Buying Volatility
Volatility (VIX) is a mathematical construct derived from how much the S&P 500 moves over the next 30 days. You can gain exposure to it through buying the iPath S&P 500 VIX Short Term Futures ETN (VXX), or buying call and put options on the (VIX) itself.
If markets fall, volatility rises, and if markets rise, then volatility falls. You can therefore protect a stock portfolio from losses through buying the (VIX).
I have written endlessly about the (VIX) and its implications over the years. For my latest in-depth piece with all the bells and whistles, please read Buy Flood Insurance With the (VXX)by clicking here.
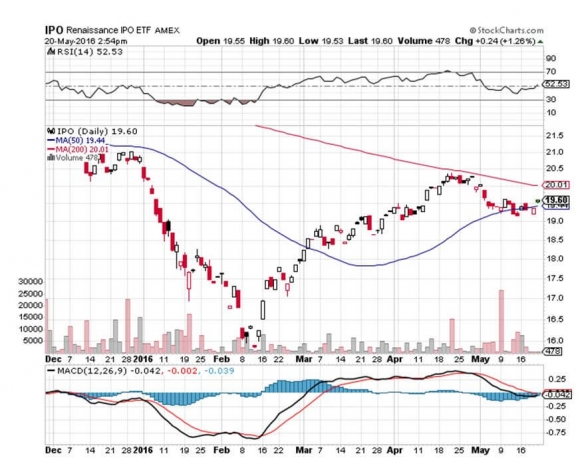
Selling Short IPO's
Another way to make money in a down market is to sell short recent initial public offerings. These tend to go down much faster than the main market. That's because many are held by hot hands, known as "flippers", and don't have a broad institutional shareholder base.
Many of the recent ones don't make money and are based on an, as yet, unproven business model. These are the ones that take the biggest hits.
Individual IPO stocks can be tough to follow to sell short. But one ETF has done the heavy lifting for you. This is the Renaissance IPO ETF (click here for the prospectus).
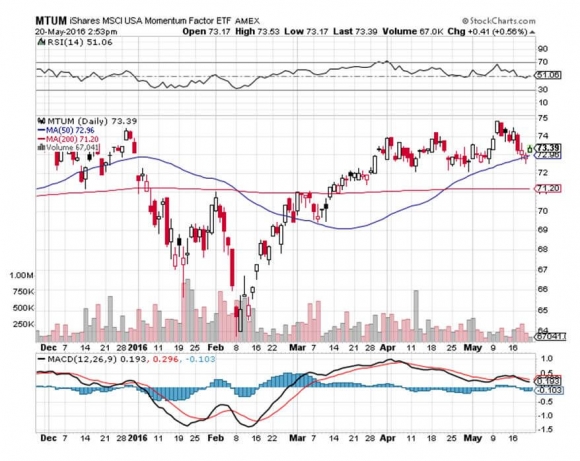
Buying Momentum
This is another mathematical creation based on the number of rising days over falling days. Rising markets bring increasing momentum, while falling markets produce falling momentum.
So selling short momentum produces additional protection during the early stages of a bear market. Blackrock has issued a tailor made ETF to capture just this kind of move through its iShares MSCI Momentum Factor ETF (MTUM). To learn more, please read the prospectus by clicking here.
Buying Beta
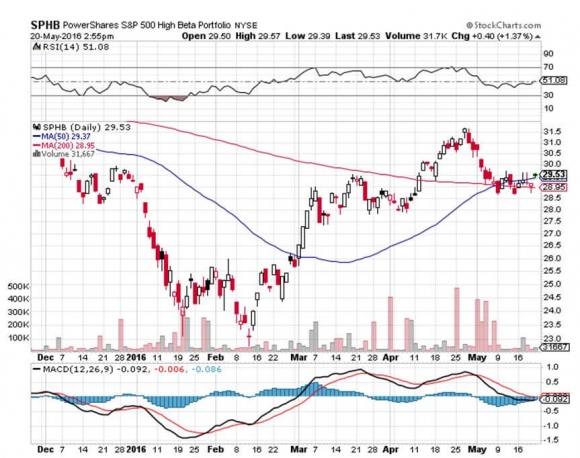
Beta, or the magnitude of share price movements, also declines in down markets. So selling short beta provides yet another form of indirect insurance. The PowerShares S&P 500 High Beta Portfolio ETF (SPHB) is another niche product that captures this relationship.
The Index is compiled, maintained and calculated by Standard & Poor's and consists of the 100 stocks from the (SPX) with the highest sensitivity to market movements, or beta, over the past 12 months.
The Fund and the Index are rebalanced and reconstituted quarterly in February, May, August and November. To learn more, read the prospectus by clicking here.
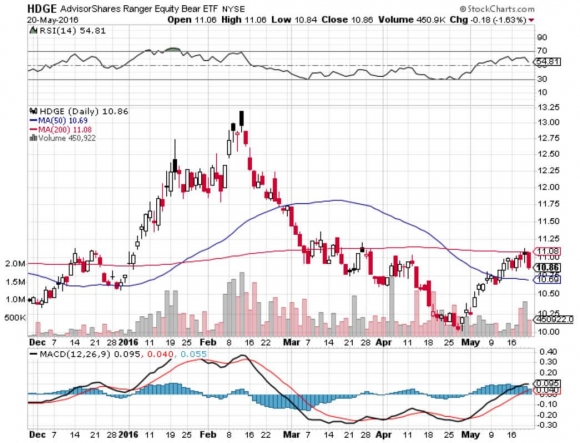
Buying Bearish Hedge Funds
Another subsector that does well in plunging markets are publicly listed bearish hedge funds. There are a couple of these that are publicly listed and have already started to move.
One is the Advisor Shares Active Bear ETF (HDGE) (click here for the prospectus). Keep in mind that this is an actively managed fund, not an index or mathematical relationship, so the volatility could be large.
Oops, Forgot to Hedge
00DougDhttps://madhedgefundtrader.com/wp-content/uploads/2019/05/cropped-mad-hedge-logo-transparent-192x192_f9578834168ba24df3eb53916a12c882.pngDougD2018-02-09 01:06:362018-02-09 01:06:36Short Selling School 101
With the stock market falling for the next few weeks, or even months, it?s time to rehash how to profit from falling markets one more time.
There is nothing worse than closing the barn door after the horses have bolted.
No doubt, you will receive a wealth of short selling and hedging ideas from your other research sources and the media at the next market bottom. That is always how it seems to play out.
So I am going to get you out ahead of the curve, putting you through a refresher course on how to best trade falling markets now, while stock markets are still only 3% short of an all time high, and unchanged on the year.
Market?s could be down 10% by the time this is all over.
THAT IS MY LINE IN THE SAND!
There is nothing worse than fumbling around in the dark looking for the matches after a storm has knocked the power out.
I?m not saying that you should sell short the market right here. But there will come a time when you will need to do so. Watch my Trade Alerts for the best market timing. So here are the best ways to profit from declining stock prices, broken down by security type:
Bear ETFs
Of course the granddaddy of them all is the ProShares Short S&P 500 Fund (SH), a non leveraged bear ETF that is supposed to match the fall in the S&P 500 point for point on the downside. Hence, a 10% decline in the (SPY) is supposed to generate a 10% gain the in the (SH).
In actual practice, it doesn?t work out like that. The ETF has to pay management operating fees and expenses, which can be substantial. After all, nobody works for free.
There is also the ?cost of carry,? whereby owners have to pay the price for borrowing and selling short shares. They are also liable for paying the quarterly dividends for the shares they have borrowed, around 2% a year. And then you have to pay the commissions and spread for buying the ETF.
Still individuals can protect themselves from downside exposure in their core portfolios through buying the (SH) against it (click here for the prospectus: http://www.proshares.com/funds/sh.html). Short selling is not cheap. But it?s better than watching your gains of the last seven years go up in smoke.
My favorite is the (RWM) a short play on the Russell 2000, which falls 1.5X faster than the big cap indexes in bear markets (click here for the prospectus: http://www.proshares.com/funds/rwm.html).
Leveraged Bear ETFs
My favorite is the ProShares Ultra Short S&P 500 (SDS), a 2X leveraged ETF (click here for the? prospectus: http://www.proshares.com/funds/sds.html). A 10% decline in the (SPY) generates a 20% profit, maybe.
Keep in mind that by shorting double the market, you are liable for double the cost of shorting, which can total 5% a year or more. This shows up over time in the tracking error against the underlying index. Therefore, you should date, not marry, this ETF or you might be disappointed.
3X Leveraged Bear ETFs
The 3X bear ETFs, like the UltraPro Short S&P 500 (SPXU), are to be avoided like the plague (click here for the prospectus: http://www.proshares.com/funds/spxu.html).
First, you have to be pretty good to cover the 8% cost of carry embedded in this fund. They also reset the amount of index they are short at the end of each day, creating an enormous tracking error.
Eventually, they all go to zero, and have to be periodically redenominated to keep from doing so. Dealing spreads can be very wide, further added to costs.
Yes, I know the charts can be tempting. Leave these for the professional hedge fund intra day traders they are meant for.
Buying Put Options
For a small amount of capital, you can buy a ton of downside protection. For example, the April (SPY) $182 puts I bought for $4,872 allowed me to sell short $145,600 worth of large cap stocks at $182 (8 X 100 X $6.09).
Go for distant maturities out several months to minimize time decay and damp down daily price volatility. Your market timing better be good with these, because when the market goes against you, put options can go poof, and disappear pretty quickly.
That?s why you read this newsletter.
Selling Call Options
One of the lowest risk ways to coin it in a market heading south is to engage in ?buy writes?. This involves selling short call options against stock you already own, but may not want to sell for tax or other reasons.
If the market goes sideways, or falls, and the options expire worthless, then the average cost of your shares is effectively lowered. If the shares rise substantially they get called away, but at a higher price, so you make more money. Then you just buy them back on the next dip. It is a win-win-win.
I?ll give you a concrete example. Let?s say you own 100 shares of Apple (AAPL), which closed on Friday at $95.13, worth $9,513. If you sell short 1 July, 2016 $100 call at $1.30 against them, you take in $130 in premium income ($1.30 X 100 because one call option contract is exercisable into 100 shares).
If Apple close2 below $100 on the July 15, 2016 expiration date, the options expire worthless and you keep your stock and the premium. You are then free to repeat the strategy for the following month. If (AAPL) closes anywhere above $100 and your shares get called away, you still make money on the trade.
Selling Futures
This is what the pros do, as futures contracts trade on countless exchanges around the world for every conceivable stock index or commodity. It is easy to hedge out all of the risk for an entire portfolio of shares by simply selling short futures contracts for a stock index.
For example, let?s say you have a portfolio of predominantly large cap stocks worth $100,000. If you sell short 1 June, 2016 contract for the S&P 500 against it, you will eliminate most of the potential losses for your portfolio in a falling market.
The margin requirement for one contract is only $5,000. However if you are short the futures and the market rises, then you have a big problem, and the losses can prove ruinous.
But most individuals are not set up to trade futures. The educational, financial, and disclosure requirements are beyond mom and pop investing for their retirement fund.
Most 401ks and IRAs don?t permit the inclusion of futures contracts. Only 25% of the readers of this letter trade the futures market. Regulators do whatever they can to keep the uninitiated and untrained away from this instrument.
That said, get the futures markets right, and it is the quickest way to make a fortune, if your market direc
tion is correct.
Buying Volatility
Volatility (VIX) is a mathematical construct derived from how much the S&P 500 moves over the next 30 days. You can gain exposure to it through buying the iPath S&P 500 VIX Short Term Futures ETN (VXX), or buying call and put options on the (VIX) itself.
If markets fall, volatility rises, and if markets rise, then volatility falls. You can therefore protect a stock portfolio from losses through buying the (VIX).
I have written endlessly about the (VIX) and its implications over the years. For my latest in-depth piece with all the bells and whistles, please read ?Buy Flood Insurance With the (VXX)? by clicking here.
Selling Short IPO?s
Another way to make money in a down market is to sell short recent initial public offerings. These tend to go down much faster than the main market. That?s because many are held by hot hands, known as ?flippers,? and don?t have a broad institutional shareholder base.
Many of the recent ones don?t make money and are based on an, as yet, unproven business model. These are the ones that take the biggest hits.
This is another mathematical creation based on the number of rising days over falling days. Rising markets bring increasing momentum, while falling markets produce falling momentum.
So selling short momentum produces additional protection during the early stages of a bear market. Blackrock has issued a tailor made ETF to capture just this kind of move through its iShares MSCI Momentum Factor ETF (MTUM). To learn more, please read the prospectus by clicking here: https://www.ishares.com/us/products/251614/MTUM.
Buying Beta
Beta, or the magnitude of share price movements, also declines in down markets. So selling short beta provides yet another form of indirect insurance. The PowerShares S&P 500 High Beta Portfolio ETF (SPHB) is another niche product that captures this relationship.
The Index is compiled, maintained and calculated by Standard & Poor's and consists of the 100 stocks from the (SPX) with the highest sensitivity to market movements, or beta, over the past 12 months.
Another subsector that does well in plunging markets are publicly listed bearish hedge funds. There are a couple of these that are publicly listed and have already started to move.
One is the Advisor Shares Active Bear ETF (HDGE) (click here for the prospectus: http://www.advisorshares.com/fund/hdge). Keep in mind that this is an actively managed fund, not an index or mathematical relationship, so the volatility could be large.
Oops, Forgot to Hedge
https://www.madhedgefundtrader.com/wp-content/uploads/2014/04/Wile-E.-Coyote-TNT.jpg365496Mad Hedge Fund Traderhttps://madhedgefundtrader.com/wp-content/uploads/2019/05/cropped-mad-hedge-logo-transparent-192x192_f9578834168ba24df3eb53916a12c882.pngMad Hedge Fund Trader2016-05-23 01:06:362016-05-23 01:06:36Short Selling School 101
Legal Disclaimer
There is a very high degree of risk involved in trading. Past results are not indicative of future returns. MadHedgeFundTrader.com and all individuals affiliated with this site assume no responsibilities for your trading and investment results. The indicators, strategies, columns, articles and all other features are for educational purposes only and should not be construed as investment advice. Information for futures trading observations are obtained from sources believed to be reliable, but we do not warrant its completeness or accuracy, or warrant any results from the use of the information. Your use of the trading observations is entirely at your own risk and it is your sole responsibility to evaluate the accuracy, completeness and usefulness of the information. You must assess the risk of any trade with your broker and make your own independent decisions regarding any securities mentioned herein. Affiliates of MadHedgeFundTrader.com may have a position or effect transactions in the securities described herein (or options thereon) and/or otherwise employ trading strategies that may be consistent or inconsistent with the provided strategies.


 3X Leveraged Bear ETFs