There are a lot of belles at the ball, but you can?t dance with all of them.
While a student at UCLA in the early seventies, I took a World Politics course, which required me to pick a country, analyze its economy, and make recommendations for its economic development. I chose Algeria, a country where I had spent the summer of 1968 caravanning among the Bedouins, crawling out of the desert half starved, lice ridden, and half dead.
I concluded that the North African country should immediately nationalize the oil industry, and raise prices from $3/barrel to $10.? I knew that Los Angeles based Occidental Petroleum (OXY) was interested in exploring for oil there, so I sent my paper to the company for review. They called the next day and invited me to their imposing downtown headquarters, then the tallest building in Los Angeles.
I was ushered into the office of Dr. Armand Hammer, one of the great independent oil moguls of the day, a larger than life figure who owned a spectacular impressionist art collection, and who confidently displayed a priceless Faberg? egg on his desk. He said he was impressed with my paper, and then spent two hours grilling me.
Why should oil prices go up? Who did I know there? What did I see? What was the state of their infrastructure? Roads? Bridges? Rail lines? Did I see any oil derricks? Did I see any Russians? I told him everything I knew, including the two weeks in an Algiers jail for taking pictures in the wrong places. His parting advice was to never take my eye off the oil industry, as it is the driver of everything else. I have followed that advice ever since.
When I went back to UCLA, I told a CIA friend of mine that I had just spent the afternoon with the eminent doctor (Marsha, call me!). She told me that he had been a close advisor of Vladimir Lenin after the Russian Revolution, had been a double agent for the Soviets ever since, that the FBI had known this all along, and was currently funneling illegal campaign donations to President Richard Nixon. Shocked, I kicked myself for going into an interview so ill prepared, and had missed a golden opportunity to ask some great questions. I never made that mistake again.
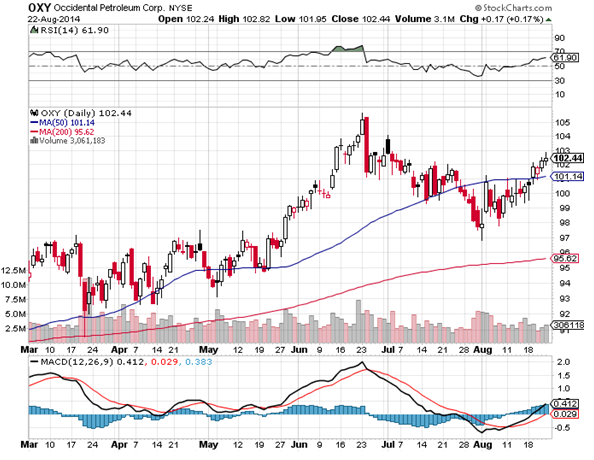
Some 40 years later, while trolling the markets for great buying opportunities set up by the BP oil spill, I stumbled across (OXY) once more (click here for their site). (OXY) has a minimal offshore presence, nothing in deep water, and huge operations in the Middle East and South America. It was the first US oil company to go back into Libya when the sanctions were lifted in 2005. (OXY?s) substantial California production is expected to leap to 45% to 200,000 barrels a day over the next four years. Its horizontal multistage fracturing technology will enable it to dominate California shale. The company has raised its dividend for the tenth year in a row, by 15% to 1.56%. Need I say more?
The clear message that came out of the BP oil spill is that onshore energy resources are now more valuable than offshore ones. I decided to add it to my model portfolio. Energy is one of a tiny handful of industries I am willing to put my money in these days (technology, industrials, and health care are the others).
Oh, and I got an A+ on the paper, and the following year Algeria raised the price of oil to $12.
A Faberge Egg
https://www.madhedgefundtrader.com/wp-content/uploads/2013/01/Faberge-Egg.jpg264257Mad Hedge Fund Traderhttps://madhedgefundtrader.com/wp-content/uploads/2019/05/cropped-mad-hedge-logo-transparent-192x192_f9578834168ba24df3eb53916a12c882.pngMad Hedge Fund Trader2014-08-25 09:32:452014-08-25 09:32:45Take a Look at Occidental Petroleum (OXY)
I can tell you exactly how the crisis in the Ukraine is going to play out. This has major implications for the global economy, financial markets and your personal portfolio, so listen up!
The key to deciphering this puzzle is oil, far and away Russia?s largest export. At 10 million barrels a day, the country is taking in $360 billion a year in revenues from oil shipments.
You can analyze Russia all day long, and come up with bullish arguments for the country, like the emerging middle class, its huge hoard of basic commodities, and substantial wheat exports. But Texas tea (Russian tea?) overwhelms everything else in its impact on the national accounts.
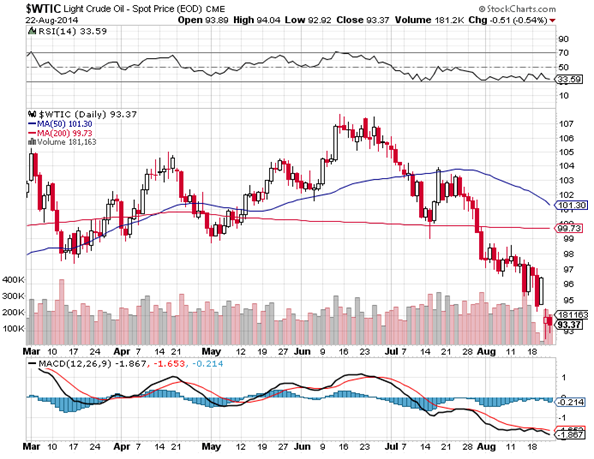
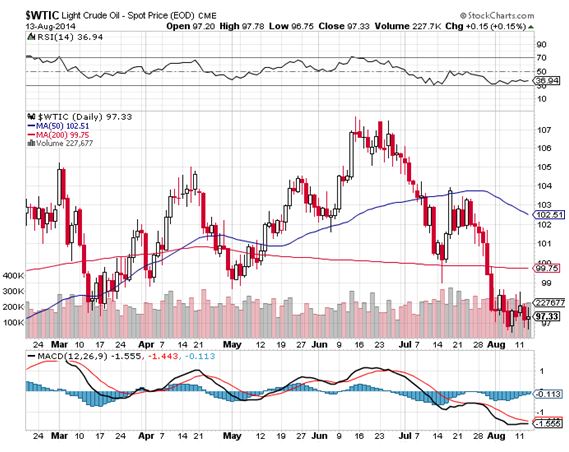
The bottom line is that Russia is basically a call option on oil. This is why I never buy the Market Vectors ETF Trust (RSX). Look at the charts below for oil, and it is clear that it almost trades tick for tick with the (RSX).
If I?m bullish on oil, I go straight to the end commodity, and not the intermediary, where price earnings multiples are permanently low, corruption is rampant and the rule of law is absent.
And therein lies the problem for Vladimir Putin.
Any chink in the global growth picture flows straight into the price of oil. Slower growth brings lower oil prices and therefore smaller incomes for the Russians. And guess who the principal threat to global growth is? Vladimir Putin and his attempt to take over the Ukraine by force.
So far, crude has dropped by 10% from the May peak of $107.60. That may not sound like a lot. But this is not your father?s Russian oil industry.
Back in the old days, when my friend, Occidental Petroleum?s (OXY) Dr. Armand Hammer and Fred Koch were the only Americans running around the Caucasus, oil there was incredibly cheap. There, technology was 50 years old and labor was virtually free. Slave labor is great for profit margins. If you don?t believe me, just ask Wal-Mart (WMT) and Apple (AAPL).
The fall of the Berlin Wall and the end of the Soviet Union brought many far-reaching, unintended consequences. A big one is that Russia?s dependence on international trade grew tremendously. The country was also able to modernize its oil industry with extensive American assistance.
Russian oil production exploded, as did the cost of production. In my lifetime, expenses have soared from $5 to $70 a barrel. So when oil dips by 10% on the international markets, Russian incomes plunge by 25%. The Russian oil industry has become a highly leveraged affair.
This is why such relatively minor price declines brought apparently desperate actions by the Russian authorities to prop up the economy. They have imposed a 3% emergency VAT, or sales tax. While I was in Europe, four Russian tour companies were driven into bankruptcy by the banking sanctions, stranding some 10,000 tourists on Mediterranean beaches.
Now there is a ban on food imports from Europe, stranding thousands of trucks at the Russian borders. Russia doesn?t grow much food, thanks to their horrendous winters and short growing seasons. Essentially, it?s just wheat and potatoes.
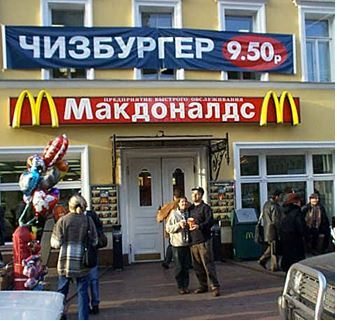
Everything else has to be imported. Some of the lost food can be made up with new imports from emerging, non sanctioning economies, but not much. In the meantime, some 350 McDonald?s franchises in Russia are trying to figure out how to make Big Macs purely from domestic supplies. Good luck to that!
The thing that really struck me speaking to Russians in Europe this summer was Putin?s unbelievably high 85% approval rating (our congress is at 14%!). They trotted out the most incredible conspiracy theories which painted them as the injured party. (The Ukraine was trying to assassinate Putin when it shot down Malaysian Air 17, and then blamed it on Russia).
It almost reminded me of home. The Russians are calling their opponents ?fascists.? This is a people who act like WWII ended last week.
Which leads me to believe that Putin?s popularity is peaking. The sanctions coupled with falling oil revenues are starting to have a severe impact on Russian standards of living. It is a matter of time before this feeds into poor election results for Putin. Nationalism is great, but who wants to live on canned food left over from the Soviet Union (yuck!).
Putin knows this. So to head off the riot, he is going to declare victory in the Ukraine fairly soon, and then take his troops home. This will enable the Ukraine to snuff out the separatists and return to an uneasy peace. We might even luck out and get a written treaty.
If that is a case, you can expect global financial markets to rocket. There would me a massive shift of capital out the risk spectrum, out of bonds and into stocks. This would give the green light for my scenario where S&P 500 adds 10% from last week?s low to end of 2014.
Maybe this is what stocks are trying to tell us by refusing to go down more that 5% this summer and the face of a host of geopolitical disasters.
As for the exact timing for all of this, just watch the price of oil. The lower it goes, the sooner we will get a favorable resolution. The charts are hinting that another $5-$10 break to the downside is imminent.
The last Cold War drove the Soviet Union broke and Putin definitely has no interest in repeating the exercise.
Not Until the Sanctions Are Over
https://www.madhedgefundtrader.com/wp-content/uploads/2014/08/McDonalds-Russia.jpg321337Mad Hedge Fund Traderhttps://madhedgefundtrader.com/wp-content/uploads/2019/05/cropped-mad-hedge-logo-transparent-192x192_f9578834168ba24df3eb53916a12c882.pngMad Hedge Fund Trader2014-08-14 09:32:162014-08-14 09:32:16How the Ukraine Crisis Will Play Out
Now that the stock market appears destined to soon enter correction territory, I have started searching for industries and companies that I want to buy at the bottom. The solar industry is at the top of that list.
Solar has a been a long time in coming. For decades, it was a niche energy source with very narrow following among scientists, the military, and Greenpeace activists. The problem was that it was just too expensive. It made sense only to those with unlimited budgets (the army), pursuing a political agenda (environmentalists), or when there was no other alternative power source (outer space).
Ironically, what really got the solar bandwagon moving was oil, which saw prices soar to $150 a barrel in 2008. That dramatically raised the breakeven cost of solar. Projects that only existed on paper suddenly made economic sense.
Then, Barack Obama was elected president. One of his first moves was to make available over $100 billion in subsidies for alternative energy projects of every description. All of a sudden, it was off to the races for solar.
This led to the first solar stock market boom in 2009. Some highflyers, like First Solar (FSLR) rose tenfold (it was a favorite ?BUY? recommendation of mine at the time). They were aided by states like sun-drenched California that mandated 20% of power consumption comes from alternative sources, to rise to 30% in the 2020?s.
This created an enormous solar and wind infrastructure throughout the west to meet the state?s voracious needs. Some 29 other states have passed similar laws with varying targets.
I inspected the centerpiece of the state?s solar strategy, flying over the gigantic Ivanpah facility in a wheezing, rented Cessna 172 in the barren, baking, but beautiful Mojave Desert. I brought plenty of extra water bottles and a compass in case I crash-landed and had to walk home.
It all looks like a film set from a science fiction movie, with 347,000 concave mirrors placed in enormous circles focusing light on hot water boilers atop three 460-foot towers. The plant opened in February, 2014 and is generating 377 megawatts of electricity, enough to power 140,000 homes in the Los Angeles area.
Planned a decade ago, the technology is now so primitive that it is unlikely to be ever used again. Far more advanced than film, solar is now taking over the world.
Then China came in and spoiled the party. Overproduction by poorly managed and weakly financed Chinese solar firms using inferior technologies quickly glutted the global market, and solar prices crashed by 80% or more. Many companies did not survive, such as the San Francisco Bay Area?s Solyndra, which defaulted on some $536 million in federal government loans (the feds got $143 million back).
This triggered a Darwinian clearing out of the industry, where only the strongest, the most innovative, and the most desperate survived. Technologies and efficiencies improved. The administration extended a helping hand by slapping hefty anti dumping tariffs on Chinese imports. The industry is lobbying for further restrictions. This all set the stage for a solar renaissance.
For the first time in history, solar is now cost competitive with conventional sources of power on a standalone, unsubsidized basis. As a result, the industry is exploding. In 2013, solar accounted for 29% of new power generation capacity in the US, after quasi-green natural gas, at 46%.
The advent of cheap solar roof panels and ?smart? electric meters in 43 states has enabled individuals to get in on the act. Such devices are now a standard feature on most new high-end homes. They genuinely do save money, especially when considering that utilities will bill you up to 50 cents per kilowatt hour for prime time consumption, compared to their average rate of 11 cents. There have been over 200,000 such installations in the past two years, half in the Golden State.
The Department of Energy wants to see solar grow from 1% of total generation today to 27% by 2050. This is creating the basis for a gigantic industry in the future. Hence, my interest as a long-term equity investor.
All of this will require a complete rethinking of the electric utility industry (XLU), which still uses a volume based business model that has remained unchanged for 120 years. The more they sold the more money they made.
The utility industry has mixed feeling about the new solar revolution. They are going to have to evolve from distributors of power for a single, large, capital-intensive source to an intermediary operation that buys and sells power between millions of users and producers. This is easier said than done, as this is the most conservative of American industries. People run to utilities in a bear market for a reason.
Only the other hand, moving towards solar and other alternatives gets them out of the carbon burning business, either through using coal or oil as fuel. There is not a utility in the country that isn?t swamped by lawsuits from well represented consumers claiming that the byproducts from burning these traditional fuels gave them asthma, lung cancer, or worse.
In the end, it won?t be a desire to save the environment, or the expediency to appear politically correct that will convert utilities to solar. It will be hard-nosed business sense.
The buy on the dip list is fairly short. The front-runner in this industry is the aforementioned First Solar (FSLR), which has been an industry leader for two decades. Not only is their US business booming, they have a gigantic project in western China that promises to spin off profits for years to come.
SunPower Corp (SPWR) has the attraction of a $1 billion order backlog. Or you can go generic and buy the Guggenheim Solar ETF (TAN), which tacked on and impressive 270% last year.
I am less enamored with Solar City (SCTY). It is in the business of installing roof panels on homes. It takes advantage of generous government subsidies and the current ultra low cost of financing to keep prices low.
As much as I applaud the long-term vision of founder, Elon Musk, his association with the company has given it a cult like status. That is good for the share prices, but bad for valuations, which are through the roof. A greater dependence on subsidies could hurt them in the future.
Some formidable challenges lie ahead. In 2017 the government?s investment tax credit for solar drops from 30% to 10%. Other state subsidies are expiring as well. If this coincides with a recession that triggers a collapse in the price of oil, we could be in for another great clearing out.
Hopefully, by then, steadily advancing technology will further cut costs by half, making it possible for more firms to survive.
Until then, let the sun shine in!
https://www.madhedgefundtrader.com/wp-content/uploads/2014/04/House-Solar-Panels.jpg303453Mad Hedge Fund Traderhttps://madhedgefundtrader.com/wp-content/uploads/2019/05/cropped-mad-hedge-logo-transparent-192x192_f9578834168ba24df3eb53916a12c882.pngMad Hedge Fund Trader2014-04-16 09:01:012014-04-16 09:01:01Buy Solar Stocks on the Dip
Boy, that was one hell of a recommendation I made back in 2012, getting readers to buy Master Limited Partnerships (MLP?s).
The share price for my favorite, Linn Energy (LINN), is unchanged from when I urged readers to pick it up. However, they have taken home nearly 25% in dividend payoffs during the same period. Not a bad return in this zero interest rate world.
The origins of the special tax breaks that led to the creation of these most complex of securities are lost in the sands of time. As I recall, they date back to a period when the US was chronically short of oil, and industry desperately needed the big ticket infrastructure to produce and deliver it.
They worked like a charm. Never underestimate the desire of the American investor to avoid paying taxes.
An MLP is a ?pass through? instrument that allows profits to move directly to end investors, thus bypassing corporate double taxation. That set up generates enormous yields that are particularly attractive to individual investors. Some 114 MLP?s now exist, and most can be bought on public exchanges as easily as stocks or exchange traded funds (ETF?s).
It is an old Wall Street nostrum to feed the geese while they are quacking, and investment bankers have done so in spades (see chart below). The number of initial public offering for MLP?s has soared in recent years, from just two in 1985 to a prolific 21 last year.
New issue volumes have become so prodigious that they are disrupting the dynamics of the secondary market. Investors are now unloading their existing MLP?s to make room for the new ones, setting back prices on existing issues. The same disease is also afflicting biotech stocks, where an overly ambitious new issue calendar triggered dramatic falls in the sector.
Will Wall Street kill the gold goose yet again?
MLP?s have benefited enormously from the fracking and horizontal drilling boom now unfolding across the United States. As a result, US energy demand is at a 30 year high, and so is the demand for energy infrastructure.
As I often tell my guests at my Global Strategy Luncheons, the smart play in natural gas, where supplies are burgeoning, is a volume play, and not a price play. MLP?s achieve exactly that.
To qualify for MLP status, a partnership must generate at least 90 percent of its income from what the Internal Revenue Service deems ?qualifying? sources. For many MLPs, these include all manner of activities related to the production, processing or transportation of oil, natural gas, and coal.
Energy MLPs are defined as owning energy infrastructure in the U.S., including pipelines, natural gas, gasoline, oil, storage, terminals, and processing plants. These are all special tax subsidies put into place when oil companies suffered from extremely low oil prices. Once on the books, they lived on forever.
In practice, MLPs pay their investors through quarterly distributions. Typically, the higher the quarterly distributions paid to LP unit holders, the higher the management fee paid to the general partner. The idea is that the GP has an incentive to try to boost distributions through pursuing income-accretive acquisitions and organic growth projects.
Because MLPs are partnerships, they avoid the corporate income tax, on both a state and federal basis. Instead of getting a form 1099-DIV and the end of the year, you receive a form K-1, which your accountant should know how to handle.
Additionally, the limited partner (investor) may also record a pro-rated share of the MLP?s depreciation on his or her own tax forms to reduce liability. This is the primary benefit of MLPs and gives MLPs relatively cheap funding costs.
The tax implications of MLPs for individual investors are complex. The distributions are taxed at the marginal rate of the partner, unlike dividends from qualified stock corporations. On the other hand, there is no advantage to claiming the pro-rated share of the MLP?s depreciation (see above) when held in a tax-deferred account, like an IRA or 401k. To encourage tax-deferred investors, many MLP?s set up corporation holding companies of LP claims which can issue common equity.
The popularity of MLP?s has caused a huge inflow of capital, which has caused yields to crash, from 25% during the dark days of 2009, to an average of 6.7% today. Still, yield starved investors threw money at MLP?s with both hands last year, an eye popping $11.9 billion, according to figures from the tracking firm, Morningstar.
As yields have plunged, risks have risen. In February, Houston based Boardwalk Pipeline Partners (BWP), out of the blue, dramatically cut its payout to investors. A panic ensued, chopping 62% off the value of the shares in the following weeks. No doubt, increased competition for pipelines from railroads was a factor.
To protect yourself you must go to the website and read the prospectus before sending a check to an MLP. Unfortunately, these are so complex that even degrees in securities and tax law might not be enough to help you. What do you do instead? Pray, as seems to be the strategy of most individual investors.
At the end of the day, oil has a big influence on MLP prices. So the antics of Vladimir Putin in the Ukraine are probably a welcome development for MLP holders, as it has helped boost the price of Texas tea from $91 to $105 since the beginning of 2014.
However, get a real recession, and one will be overdue in a couple of years, and the price of oil will collapse once again, causing MLP?s to revisit those subterranean 2009 lows. Mothballed drilling rigs and rusting pipelines don?t produce lease payments or pay dividends. These are the risks you are being paid to take with a double-digit yield.
The lesson here is ?be nimble, or die".
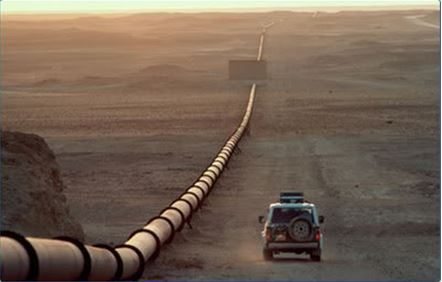
You Want This One
Not This One
How Long Will the MLP Run Continue?
https://www.madhedgefundtrader.com/wp-content/uploads/2014/04/Pipeline.jpg282442Mad Hedge Fund Traderhttps://madhedgefundtrader.com/wp-content/uploads/2019/05/cropped-mad-hedge-logo-transparent-192x192_f9578834168ba24df3eb53916a12c882.pngMad Hedge Fund Trader2014-04-15 01:04:322014-04-15 01:04:32How Long Will the Run in Master Limited Partnerships Continue?
My inbox was clogged with responses to my ?Golden Age? for the 2020?s piece, particularly my forecast that the US was moving towards complete energy independence. This will be the most important change to the global economy for the next 20 years. So I shall go into more depth.
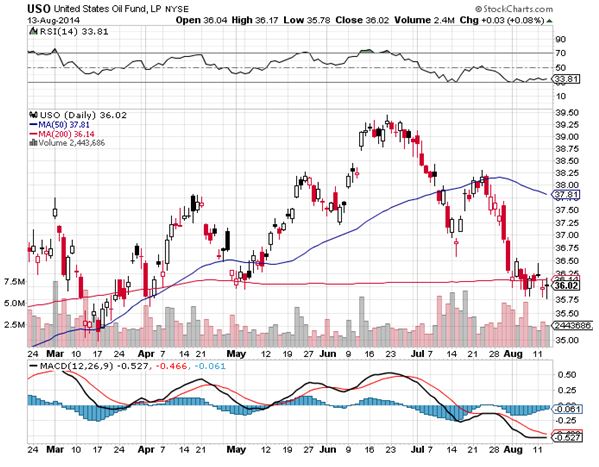
The energy research house, Raymond James, put out an estimate this morning that domestic American oil production (USO) would rise from 5.6 million barrels a day to 9.1 million by 2015. That means its share of total consumption will leap from 28% to 46% of our total 20 million barrels a day habit. These are game changing numbers.
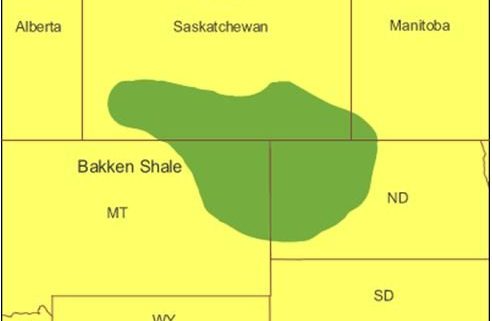
Names like the Eagle Ford, Haynesville, and the Bakken Shale, once obscure references on geological maps, are now a major force in the country?s energy picture. Ten years ago North Dakota was suffering from depopulation. Now, itinerate oil workers must brave -40 degree winter temperatures in their recreational vehicles pursuing their $150,000 a year jobs.
The value of this extra 3.5 million barrels/day works out to $121 billion a year at current prices (3.5 million X 365 X $95). That will drop America?s trade deficit by nearly 25% over the next three years, and almost wipe out our current account deficit. Needless to say, this is a hugely dollar positive development.
This 3.5 million barrels will also offset much of the growth in China?s oil demand for the next three years. Fewer oil exports to the US also vastly expand the standby production capacity of Saudi Arabia.
If you want proof of the impact this will have on the economy, look no further that the coal (KOL), which has been falling in a rising market. Power plant conversion from coal to natural gas (UNG) is accelerating at a dramatic pace. That leaves China as the remaining buyer, and their economy is slowing.
It all makes the current price of oil at $95 look a little rich. As with the last oil spike three years ago, this one is occurring in the face of a supply glut. Cushing, Oklahoma is awash in Texas tea, and the Strategic Petroleum Reserve stashed away in salt domes in Texas and Louisiana is at its maximum capacity of 727 barrels. It is concerns about war with Syria and Iran, fanned by elections in both countries that took prices to $112 in the fall.
My oil industry friends tell me this fear premium has added $30-$40 to the price of crude. This is why I have been advising readers to sell short oil price spikes to $110. The current run up isn?t going to take us to the $150 high that we saw in the last cycle. It is also why I am keeping oil companies with major onshore domestic assets, like Exxon Mobile (XOM) and Occidental Petroleum (OXY), in my long term model portfolio.
https://www.madhedgefundtrader.com/wp-content/uploads/2014/01/US-Canada-Border-Map.jpg371492Mad Hedge Fund Traderhttps://madhedgefundtrader.com/wp-content/uploads/2019/05/cropped-mad-hedge-logo-transparent-192x192_f9578834168ba24df3eb53916a12c882.pngMad Hedge Fund Trader2014-01-08 01:03:502014-01-08 01:03:50US Headed Towards Energy Independence
I was amazed to see the Dow Average open up only 60 points this morning, and oil to fall a mere $1.50, given the enormous long term implications of a real nuclear deal with Iran. Over the decades, I have noticed that Wall Street isn?t very good at analyzing international political matters and the implications for their own markets. This appears to be one of those cases.
The news over the weekend about a freeze on Iran?s nuclear enrichment program in exchange for international inspections and the unfreezing of $4 billion of their assets is unbelievably positive for all asset classes, except energy. It came much sooner than expected. It proves that the administration?s preference for economic sanctions over military action has been wildly successful.
The US is now in a tremendously powerful negotiating position. If Iran dumps their nuclear program to our satisfaction it can get the carrot. It will rejoin the world economy, unfreeze the rest of its assets, and recover $100 billion a year in trade. Its oil exports (USO) can recover from 750,000 barrels a day back to the pre crisis level of 3 million barrels. If it doesn?t then it gets the stick again in six months, resuming their economic freefall.
The geopolitical implications for the U.S. are enormous.? Iran is the last major rogue state hostile to the U.S. in the Middle East, and it is teetering. The final domino of the Arab spring falls squarely at the gates of Tehran. A friendly, or at least a non-hostile Iran, means we really don?t care what happens in Syria.
Remember that the first real revolution in the region was Iran?s Green Revolution in 2009. That revolt was successfully suppressed with an iron fist by fanatical and pitiless Revolutionary Guards. The true death toll will never be known, but is thought to be in the thousands. The antigovernment sentiments that provided the spark never went away and they continue to percolate just under the surface.
At the end of the day, the majority of the Persian population wants to join the tide of globalization. They want to buy iPods and blue jeans, communicate freely through their Facebook pages and Twitter accounts, and have the jobs to pay for it all. Since 1979, when the Shah was deposed, a succession of extremist, ultraconservative governments ruled by a religious minority, have abjectly failed to cater to these desires
If Iran doesn?t do a deal on nukes soon, it?s economy with sink deeper into the morass in which they currently find themselves. The Iranian ?street? will figure out that if they spill enough of their own blood that regime change is possible and the revolution there will reignite. The Obama administration is now pulling out all the stops to accelerate the process.
The oil embargo former Secretary of State, Hillary Clinton, organized is steadily tightening the noose, with heating oil and gasoline becoming hard to obtain. Yes, Russia and China are doing what they can to slow the process, but conducting international trade through the back door is expensive, and prices are rocketing. The unemployment rate is 40%.? The Iranian Rial has collapsed by 50%. Iranian banks were kicked out of the SWIFT international settlements system, a deathblow to their trade.
Let?s see how docile these people remain when the air conditioning quits running this summer because of power shortages. Iran is a rotten piece of fruit ready to fall of its own accord and go splat. The US is doing everything she can to shake the tree. No military action of any kind is required on America?s part. No shot has been fired. That?s a big deal when the shots cost $10,000 apiece.
The geopolitical payoff of such an event for the U.S. would be almost incalculable. A successful revolution will almost certainly produce a secular, pro-Western regime whose first priority will be to rejoin the international community and use its oil wealth to rebuild an economy now in tatters.
Oil will lose its risk premium, now believed by the oil industry to be $30 a barrel. A looming supply could cause prices to drop to as low as $30 a barrel. This would amount to a gigantic $1.66 trillion tax cut for not just the U.S., but the entire global economy as well (87 million barrels a day X 365 days a year X $100 dollars a barrel X 50%). Almost all funding of terrorist organizations will immediately dry up. I might point out here that this has always been the oil industry?s worst nightmare. Hezbollah is a short.
At that point, the US will be without enemies, save for North Korea, and even the Hermit Kingdom could change with a new leader in place. A long Pax Americana will settle over the planet.
The implications for the financial markets will be enormous. The U.S. will reap a peace dividend as large, or larger, than the one we enjoyed after the fall of the Soviet Union in 1992. As you may recall, that black swan caused the Dow Average to soar from 2,000 to 10,000 in less than eight years, also partly fueled by the technology boom.
A collapse in oil imports will cause the U.S. dollar (UUP) to rocket.? An immediate halving of our defense spending to $400 billion or less and burgeoning new tax revenues would cause the budget deficit to collapse. With the U.S. government gone as a major new borrower, interest rates across the yield curve will fall further.
A peace dividend will also cause U.S. GDP growth to reaccelerate from 2% to 4%. Risk assets of every description will soar to multiples of their current levels, including stocks, junk bonds, commodities, precious metals, and food. The Dow will soar to 30,000 and the S&P 500 (SPY) to 3,500, the Euro collapses to parity, gold rockets to $2,300 an ounce, silver flies to $100 an ounce, copper leaps to $6 a pound, and corn recovers $8 a bushel. The 60-year bull market in bonds ends.
Some 1 million of the armed forces will get dumped on the job market as our manpower requirements shrink to peacetime levels. But a strong economy should be able to soak these well-trained and motivated people right up. We will enter a new Golden Age, not just at home, but for civilization as a whole.
Wait, you ask, what if Iran develops an atomic bomb and holds the U.S. at bay? Don?t worry. There is no Iranian nuclear device. There is no real Iranian nuclear program. The entire concept is an invention of Israeli and American intelligence agencies as a means to put pressure on the regime. According to them, Iran has been within a month or producing a tactical nuclear weapon for the last 30 years.
The head of the miniscule effort they have was assassinated by Israeli intelligence two years ago (a magnetic bomb, placed on a moving car, by a team on a motorcycle, nice!).
If Iran had anything substantial in the works, the Israeli planes would have taken off a long time ago. There is no plan to close the Straits of Hormuz, either. The training exercises in small rubber boats we have seen are done for CNN?s benefit, and comprise no credible threat.
I am a firm believer in the wisdom of markets, and that the marketplace becomes aware of major history changing events well before we mere individual mortals do. The Dow began a 25-year bull market the day after American forces defeated the Japanese in the Battle of Midway in May of 1942, even though the true outcome of that confrontation was kept top secret for years.
If the advent of a new, docile Iran were going to lead to a global multi-decade economic boom and the end of history, how would the stock markets behave now? They would rise virtually every day, led by the technology sector (XLK), industrials (XLI), and the banks (XLF) (C), offering no substantial pullbacks for latecomers to get in.
That is exactly what they have been doing since August. The markets are telling us that a treaty of real substance is a done deal.
Aim This One at the Bears
https://www.madhedgefundtrader.com/wp-content/uploads/2013/11/Iran-Nuclear-Missile.jpg310517Mad Hedge Fund Traderhttps://madhedgefundtrader.com/wp-content/uploads/2019/05/cropped-mad-hedge-logo-transparent-192x192_f9578834168ba24df3eb53916a12c882.pngMad Hedge Fund Trader2013-11-26 01:04:162013-11-26 01:04:16Here Comes the Next Peace Dividend
The risk of a major market melt up just took a quantum leap upward with the European Central Bank?s surprise 25 basis points in interest rates a few minutes ago. The move had not been expected from normally sleepy and moribund European monetary authorities for a few more months.
The ECB?s action has major positive implications for the world economy. It gives a shot of adrenalin to a global synchronized economic recovery, which was already in the cards for 2014. The effect on all asset classes will be huge.
Of course, the Euro ETF (FXE) crashed by $1.70, as one would expect, one of the largest moves of the year in the foreign exchange markets. We already took profits on a short position we strapped on in the Euro the last time it ran up to $1.38, which turned out to be the peak of a multi month move. But it has also spilled over into the other currencies, expanding into a much broader move into the US dollar.
The Japanese yen (FXY), (YCS) has just puked up 60 basis points, where we have a major short position and were looking to add. As a result, we have already gained 58% of the potential profit for a position that we added only two days ago. The Australian dollar (FXA), where I am also attempting to go long on a bigger dip, has lost 50 cents. Gold took it on the nose, again.
The other blockbuster event, which transpired this morning, was the release of the early read of US Q3 GDP, coming in at a red hot 2.8%. This was much higher than expected, with many estimates hovering around the 2.0% level. This means that the 0.5% we lost in the Washington shut down will turn out to be just a speed bump. We should make it all back, and much more, in the run up to Q1, 2014.
But wait! There?s more!! The price of oil has plunged by $20 in six weeks, thanks to the massive oversupply coming out of US fracking fields, and the movement of US-Syrian hostilities to a back burner. Even an Israeli attack on a Russian resupply of missiles at a Syrian port failed to generate any interest in Texas tea. Two months ago, this would have been worth a one day, $5 spike.
The US Energy Information Agency calculates that a $20 cut in the price of oil adds 0.4% to US GDP, and cuts unemployment by 0.1%. Newly enriched consumers spend more money and corporations with lower costs earn more profits. In other words, it cancels out the negative effects of the Washington shutdown in one fell swoop.
The University of California argues that ten out of the last 11 recessions were triggered by oil price spikes. The inverse is true as well. Collapsing oil prices create economic booms. Guess which way we are headed?
US Q3 earnings reports are generating extremely favorable comparisons, up about 10% YOY in aggregate. We have an extremely favorable calendar right now, as November and December are traditionally strong months for risk markets. Maybe it?s also that holiday grog. We also have the 2014 ?Great Reallocation? out of stocks and into bonds to look forward to, which has probably already started.
It all adds up to a first class market melt up, which could start at any time. Indeed, given the torrid market performance since the summer, and its Teflon like behavior during the October Washington shutdown, some strategists are claiming that a melt up has already started. The net net of all of this is that the world looks like a much friendlier place, and I am much more inclined to add risk than I was only a few minute ago when I dragged my sorry ass out of bed.
Below, please find the posture you should take in the markets listed by asset class.
*Stocks - ?buy the dips, running to a new yearend highs, especially in technology,? industrials, health care, and consumer cyclical
*Bonds - ?sell rallies, heading to the top of the 2.50%-3% 10 year yield range
*Commodities - start scaling in on dips in copper, iron ore
*Currencies - sell yen on any rallies, buy the Australian dollar on a China recovery
*Precious Metals - stay away, the world wants? paper assets
*Volatility - stand aside, will bounce along bottom
*The Ags - stay away until next year, great weather is killing prices, but too late to sell short
https://www.madhedgefundtrader.com/wp-content/uploads/2013/09/Wall-Street-Bull.jpg439367Mad Hedge Fund Traderhttps://madhedgefundtrader.com/wp-content/uploads/2019/05/cropped-mad-hedge-logo-transparent-192x192_f9578834168ba24df3eb53916a12c882.pngMad Hedge Fund Trader2013-11-08 01:04:312013-11-08 01:04:31The Rising Risk of a Market Melt Up
I?m sure you all spent the better part of last January explaining to your clients that they should be pouring all of their money into alternative energy, social media, and biotech ETF?s. What! You didn?t? You obviously failed to get the memo. Well, neither did I.
Yes, I know this sounds like the makeup of the Sierra Club Pension Fund, if such a thing exists. Take a look at the top performing non leveraged ETF?s in 2013 and you will see a list that is dominated by these peripheral sectors, many of which were close to bankruptcy only a year ago. Who knew? The explanations for success vary with each industry.
Alternative energy is the easy one to understand, which I have long regarded as a cheap call option on the price of oil. The rising price of Texas tea boosts the breakeven cost of alternatives, and it jumped from $86 last December to as high as $112.50 last month. This enabled many companies to move well into profitability for the first time. Costs have imploded, thanks to huge supply of solar cells coming out of China. The rocket fuel came when the administration imposed punitive duties on below cost Chinese exports.
As a result, solar energy is now cheaper than buying electric power from the local grid, especially in the Southwest, where the sun shines, with bills dropping below 8 cents per kWh. I have flown over the Southern California deserts in a small plane to inspect some of these plants and they are truly gargantuan, stretching on for square miles.
They are helped by a Golden State law requiring that 30% of all power be obtained from alternative sources by 2020. Some 30 other states have passed similar legislation, with an additional six providing voluntary guidelines. This is in addition to 67 foreign countries with such mandates.
Biotechnology is an easy sell, and is why the Health Care Sector (XLV) is one of my favorites to play in the wake of any settlement of the Washington shutdown. Obamacare is about to deliver 30 million new paying customers to the industry. Those who already have health insurance coverage are aging and getting sicker at an unprecedented rate. The obesity epidemic helps, the result of our national addiction to cheeseburgers.
The rate of technological development is accelerating far beyond anyone?s imagination, throwing off ever more big ticket, highly profitable products. Much of this is going on in the San Francisco Bay area within sight of my office. Some of these cures cost $100,000 a year, for life. And guess what? Consumers in increasingly wealthy emerging nations like to stay healthy as well.
The social media boom is the riskiest, and most speculative, of this list of great performers. You would think investors would be wary in the wake of the Facebook (FB) IPO debacle. In fact, CEO Mark Zuckerberg, engineered one of the greatest investors relations turnarounds in history, and the shares finally responded, more than doubling. It turns out that the company really does make money after all, lots of it.
Keep in mind that this year?s homeruns often become next year?s strikeouts, so I wouldn?t be chasing these up here.
TOP 10 ETF?S OF 2013
Guggenheim Solar ETF (TAN) +130.8%
Market Vectors Solar Energy ETF (KWT) +93.4%
First Trust NASDAQ Clean Edge Green Energy Index Fund (QCLN) +82.4%
Market Vectors Global Alternative Energy ETF (GEX) +66.8%
The PowerShares Wilderhill Clean Energy Portfolio (PBW) +62.5%
The First Trust ISE Global Wind Energy Index Fund (FAN) +55.7%
The Market Vectors Biotech ETF (BBH) +55.7%
The Global X Social Media Index ETF (SOCL) +57.3%
The PowerShares Dynamic Biotechnology & Genome Portfolio (PBE) +56.9%
The PowerSharesGold Dragon China Portfolio (PGJ) +57.2%
So Goes the Price of Alternative Energy
https://www.madhedgefundtrader.com/wp-content/uploads/2013/10/House-Solar-Panels.jpg357533Mad Hedge Fund Traderhttps://madhedgefundtrader.com/wp-content/uploads/2019/05/cropped-mad-hedge-logo-transparent-192x192_f9578834168ba24df3eb53916a12c882.pngMad Hedge Fund Trader2013-10-10 08:56:582013-10-10 08:56:58The Best ETF?s of 2013
I have kept oil companies in my long term model portfolio for many years now. But there are a lot of belles at the ball, but you can?t dance with all of them.
While a student at UCLA in the early seventies, I took a World Politics class, which required me to pick a country, analyze its economy, and make recommendations for its economic development. I chose Algeria, a country where I had spent the summer of 1968 caravanning among the Bedouins, fighting rebels and bandits, crawling out of the desert starved, lice ridden, and half dead.
I concluded in my paper that the North African country should immediately nationalize the oil industry, and raise prices from $3/barrel to $10 (USO).? I knew that Los Angeles based Occidental Petroleum (OXY) was interested in exploring for oil there, so I sent my paper to the company for review. They called the next day and invited me to their imposing downtown headquarters, then the tallest building in Los Angeles.
I was ushered into the office of Dr. Armand Hammer, one of the great independent oil moguls of the day, a larger than life figure who owned a spectacular impressionist art collection, and who confidently displayed a priceless Faberg? egg on his desk.
He said he was impressed with my paper, and then spent two hours grilling me. Why should oil prices go up? Who did I know there? What did I see? What was the state of their infrastructure? Roads? Bridges? Rail lines? Did I see any oil derricks? Did I see any Russians?
I told him everything I knew, including the two weeks spent in an Algiers jail for taking pictures in the wrong places. His parting words were to never take my eye off the oil industry, as it is the driver of everything else. I have followed that advice ever since.
When I went back to UCLA, I told a CIA friend of mine that I had just spent the afternoon with the eminent doctor (Marsha, call me!). She told me that he had been a close advisor of Vladimir Lenin after the Russian Revolution, had been a double agent for the Soviets ever since, that the FBI had known this all along, and was currently funneling illegal campaign donations to President Richard Nixon. Shocked, I kicked myself for going into an interview so ill prepared, and had missed a golden opportunity to ask some great questions. I never made that mistake again.
Some 40 years later, while trolling the markets for great buying opportunities, I stumbled across (OXY) once more (click here for their). (OXY) has a minimal offshore presence, nothing in deep water, and huge operations in the Middle East and South America. It was the first US oil company to go back into Libya when the sanctions were lifted in 2005.
(OXY?s) substantial California production is expected to leap to 45% to 200,000 barrels a day over the next four years. Its horizontal multistage fracturing technology will enable it to dominate California shale. It has raised its dividend for the eighth year in a row, to 2.90%, more than ten year Treasury bonds Need I say more?
The clear message that has come out of the BP oil spill is that onshore energy resources are now more valuable than offshore ones. A lead in fracking is a huge plus. I think (OXY) will continue to make money, no matter what the price of oil does. That?s why it lives in my long-term model portfolio.
Oh, and I got an A+ on the paper, and the following year Algeria raised the price of oil to $12.
Can You Spot the Double Agent?
A Faberge Egg
https://www.madhedgefundtrader.com/wp-content/uploads/2013/01/Faberge-Egg.jpg264257Mad Hedge Fund Traderhttps://madhedgefundtrader.com/wp-content/uploads/2019/05/cropped-mad-hedge-logo-transparent-192x192_f9578834168ba24df3eb53916a12c882.pngMad Hedge Fund Trader2013-09-23 09:05:142013-09-23 09:05:14Take a Look at Occidental Petroleum (OXY)
We got the dollar drop over the weekend that I was expecting. There was no way that the war was going to start before Obama gave his speech on Tuesday and congress votes yea or nay later on.
So when the missiles failed to show by the Monday morning opening, they took Texas tea down a full buck. The Charlie Rose interview with Bashar al-Assad, where he blamed it all on the rebels, also cast more doubt on the prospect of immediate hostilities.
Don?t kid yourself. There is going to be a war. Over the weekend, I did manage to get a peek at the classified proof of the sarin gas attack, thanks to some senior military sources at the Pentagon.
It includes recordings of radio transmissions from Syrian generals ordering the use of poison gas to teach a lesson, and other recordings of radar tracks showing the missiles flying from a Syrian army base to a Damascus neighborhood. You are not going to get a better smoking gun than that.
The Russians were not given access to this data to keep sources, methods, and the advanced state of our monitoring technology, secret. Besides, relations with the Ruskies have been pretty rocky lately. This is why President Obama said at the St. Petersburg press conference that he was elected to end wars, not start new ones, based on false information, a jab at the originators of the 2002 second Gulf War.
However, it?s time to use this window to cut our losses on our United States Oil Fund September, 2013 $39-$42 in-the-money bear put spread, which is now out-of-the-money, if just a touch. Think of it has folding your hand and losing your ante when the dealer has an ace showing in Texas hold?em.
Everything that can go wrong with a trade happened with this one. My initial assumption that Egypt would go to sleep in the wake of the army massacre of 1,000 protesters proved correct. At first, my oil short made money, as oil fell from $108 a barrel to $105, taking the (USO) down with it.
Then Secretary of State John Kerry made his blockbuster, saber rattling speech, ramping up speculation about a new war in Syria by a quantum leap. Oil soared to $112.50. Since then, it has been all back and fill, based on the totally unpredictable headline?du jour, with most of the movement occurring in an untradeable daily gap opening.
There are only nine trading days left to expiration on this position. We would make money with an expiration at this level with the (USO) a mere 25 cents in-the-money.
But the risk/reward of continuing has gone asymmetric against us, meaning that we are risking a lot of money here to make just a little bit. It is not worth it. If things suddenly go against us, like missiles actually flying, a 1.18% loss could turn into a sickening 10% one very quickly. And with nine days to expiration, there is not enough time for conditions to turn right for us once again.
It easier to take a loss when your overall profit reaches another all time high. As of now, the?Trade Alert?service of the?Mad Hedge Fund Trader?is up a hefty 41.48%, thanks to my major short in the Japanese yen. I would hate to lose a quarter of this on a single rogue trade, thanks to some Middle Eastern warlord.
I already have plans on how to spend this money, like buying a second Tesla, the four wheel drive SUV model X, which will probably set me back another $100,000. I am not going to let oil pee on my parade.
When war does break out, and then escalates, and we get the spike up to $118 that many are predicting, then you?ll see me re emerge as a seller once again. If anything, the underlying supply/demand dynamics are getting worse, with the precipitous size of the Wall Street long position in oil rising, while underlying demand is melting away like an ice cube in the desert. For explanations of the fundamentals here in eloquent and florid detail, please read ?Why I Sold Oil? by?clicking here?and ?Why I?m Keeping My Oil Short? by?clicking here?at.
On to the next trade.
A Tesla Model ?X?
https://www.madhedgefundtrader.com/wp-content/uploads/2013/09/Tesla-Model-X.jpg383508Mad Hedge Fund Traderhttps://madhedgefundtrader.com/wp-content/uploads/2019/05/cropped-mad-hedge-logo-transparent-192x192_f9578834168ba24df3eb53916a12c882.pngMad Hedge Fund Trader2013-09-10 01:05:582013-09-10 01:05:58Bailing on My Oil Short
Legal Disclaimer
There is a very high degree of risk involved in trading. Past results are not indicative of future returns. MadHedgeFundTrader.com and all individuals affiliated with this site assume no responsibilities for your trading and investment results. The indicators, strategies, columns, articles and all other features are for educational purposes only and should not be construed as investment advice. Information for futures trading observations are obtained from sources believed to be reliable, but we do not warrant its completeness or accuracy, or warrant any results from the use of the information. Your use of the trading observations is entirely at your own risk and it is your sole responsibility to evaluate the accuracy, completeness and usefulness of the information. You must assess the risk of any trade with your broker and make your own independent decisions regarding any securities mentioned herein. Affiliates of MadHedgeFundTrader.com may have a position or effect transactions in the securities described herein (or options thereon) and/or otherwise employ trading strategies that may be consistent or inconsistent with the provided strategies.