I did not buy the rally in stocks this week for two seconds.
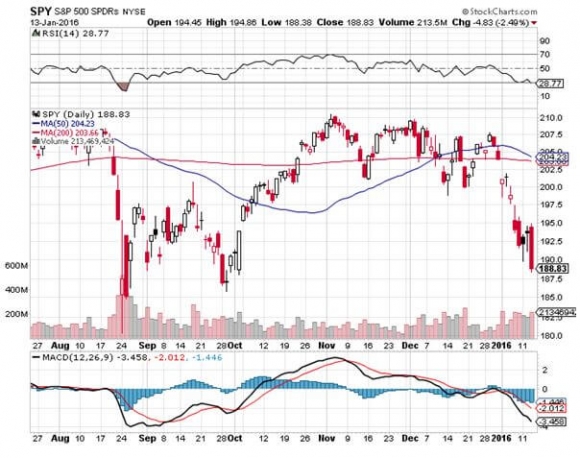
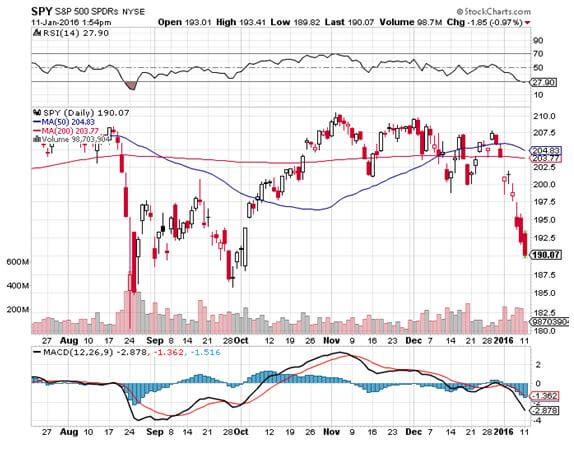
Once the S&P 500 (SPY) bounced off of the $190 level the first time, it was only a question of how soon to sell again. When I said ?Sell every rally in stocks this year,? I wasn?t kidding.
As it turns out, I caught the absolutely top tick in the (SPY) at $195.
That?s where I quickly bought the (SPY) February $202-$207 vertical bear put debit spread. Within hours, the index cratered an awesome $70 handles, and I was already looking at 70% of the maximum potential profit.
The great luxury of the S&P 500 SPDR?s (SPY) February, 2016 $202-$207 in-the-money vertical bear put spread is that it allows you to cash in on continued extremely elevated levels of the Volatility Index (VIX).
This is why the potential return is so high for a front month options spread already 7 handles, and now 12 handles in-the-money.
In the meantime, I continued to run big shorts in the (SPY) with my February 187 and $190 puts.
This was on the heels of cutting by half my (XIV) position at cost, and taking profits on my (SPY) January $182-$187 vertical bull call debit spread during the rally.
Since yesterday, I have cut the net exposure of my sizeable trading book from 40% to 0%. This is how you do it.
My lack of faith in this market can be measured by the bucket load.
I believe that oil (USO) hasn?t bottomed yet.
All we are seeing here is a round of natural short covering you would expect as the price bounces off the big round number of $30, something which computer driven algorithms love to do.
There are many more visits to the $20 handle for oil to come. Brent is already there.
If you have some magical insight into the price of oil, better than the entire industry combined, and are convinced that Texas tea bottomed yesterday, then you shouldn?t touch the S&P 500 SPDR?s (SPY) February, 2016 $202-$207 in-the-money vertical bear put spread. In that unlikely scenario, stocks rocket from here.
Then there?s China (FXI), whose continued turmoil will bring further US stock losses. I assure you, not even the Chinese know what?s going on in China. They are more like the unfortunate deer that is frozen in the headlights.
If the stock markets of the Middle Kingdom were either up or down 10% tomorrow, I wouldn?t be surprised.
I?m quite happy with the performance of the Trade Alert service so far in 2016.
Here we are only 8 trading days into the New Year and many traders have already blown up, including quite a few trade mentoring newsletters. We should be hauling in some big numbers in January and February.
This is how you trade a crash. Watch and learn. The opportunities are legion.
https://www.madhedgefundtrader.com/wp-content/uploads/2013/07/John-Thomas-breakfast.jpg364490Mad Hedge Fund Traderhttps://madhedgefundtrader.com/wp-content/uploads/2019/05/cropped-mad-hedge-logo-transparent-192x192_f9578834168ba24df3eb53916a12c882.pngMad Hedge Fund Trader2016-01-14 01:07:352016-01-14 01:07:35Why I Doubled My Shorts Yesterday
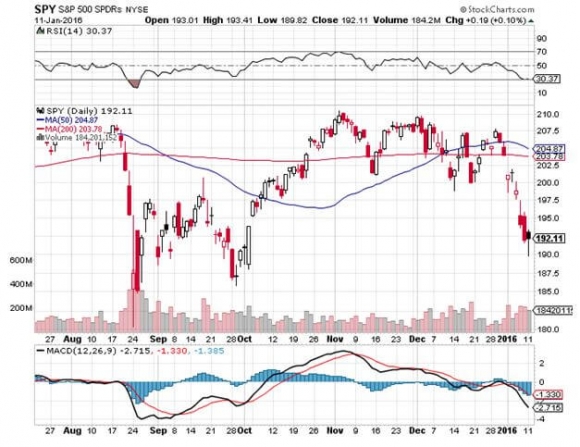
Followers of my Trade Alert service have noticed some unusual activity during the last two days. Instead of recommending put spreads, I have started advising the purchase of outright puts.
Coming on top of big declines in the S&P 500 (SPY), you may have thought that I have lost my mind, if I hadn?t already done so a long time ago.
My kids would agree with you.
However, there is a method to my madness.
The truly brilliant aspect to the option spread strategy that I have been using for the past four years was that the positions had an embedded short volatility aspect to them.
While you were long volatility with your long leg, this was offset by the short volatility in your short leg.
This gave you a net volatility exposure of close to zero, a great thing to have during a time of secular declining volatility, as we have seen since 2012. Think of the first eight months of 2015, when index prices barely budged.
It also meant that you could achieve your maximum profit when the underlying stock remained unchanged, or moved only a few percent against you.
The nice thing about this low volatility was that it gave time to followers to get in and out of positions before large price changes occurred. Moves of only a few cents before you received trade alerts were common.
By focusing on front month options I also took maximum advantage of accelerated time decay going into each expiration. It was like having a rich uncle write you a check every day.
The low volatility delivered only small changes in the value of your portfolio from the day-to-day movements in the market, tiny enough for the novice investor to live with.
This is what enabled me to produce huge, outsized double digit returns while most other managers were sucking wind.
Since August 24, we have been in a completely different world. The long-term trend in volatility isn?t falling anymore. It has been rising.
What this brought to my trading book was a series of stop outs on options spread positions, whether they were call spreads or put spreads, and painful losses.
This is why I lost money in two out of three months in the recent quarter, a rare event. Having an embedded short volatility position was alas costing me money.
So it is time to adjust our strategy to reflect this brave new, and more volatile world.
So instead of running positions into expiration, I am going to start hedging them with options when a breakdown in the market appears imminent.
This is why I picked up the February $190 puts on Friday to hedge my January $185-$190 calls spread. It is also why I bought the February $187 puts to hedge my January $182-$187 call spread.
Why the mismatch in expirations? It ducks the problem of final week super accelerated time decay with my long puts. It also means I can continue with the short positions after the Friday January expiration, if I choose to do so.
There is one complication with this approach. Individual options are vastly more volatility than option spreads. So it won?t be unusual for an option to move 5%-10% by the time you receive the Trade Alerts. To be forewarned is to be forearmed.
Let?s look at out current positions as examples. For further analysis you have to be familiar with the concept of on option delta. Delta is a letter of the Greek alphabet used by traders to refer to the movement of an option relative to its underlying security.
A delta of 10% means that a $1 move in the underlying produces a 10-cent move in the option, which you see in deep out-of-the-money options. A delta of 90% means that a $1 move in the underlying produces a 90-cent move in the option, which is found with deep-in-the-money options.
The January $185-$190 vertical call debit spread had two legs, and the delta can be calculated as following:
A long January 185 call with a delta of +19% A short January 190 call with a delta of -39% (negative since you are short) This gives you a net delta of (39% - 19%) = -20%.
In other words, a $1 move down in the underlying (SPY) index only moves the $185-$190 call spread south by -20 cents.
In the case of the $182-$187 call spread, the net delta is only 14%, giving you a move in the spread of only 14 cents for the $1 (SPY) move.
Let?s say that the market looks like it is going to pieces and I want to hedge my downside exposure. That means I need to buy puts against my long call spread.
Since my net delta is only -20% on the January $185-$190 vertical call debit spread, I only need to buy 20% as many puts to neutralize the position, or 0.2 X 22 = 4.4 options.
To be more aggressive on the downside I increased my put purchase to 13 contracts to also provide extra downside protection of my short volatility (XIV) position. I then repeated this exercise on Monday for the $182-$187 vertical call debit spread.
What we end up with is a portfolio that is profitable at all points with a Friday January 15 (SPY) options expiration between $187-$194. Now you don?t have to touch the position, unless we break out of that range.
This prevents you from attempting to trade every triple digit ratchet in the market between now and then. This is a hopeless exercise. I know because I have tried it many times, to no avail.
Yes, I know this all sounds complicated. But this is how the pros do it. This is how they make money. It?s all about preserving your capital and making incremental profits on top of it. Watch, and learn.
Learn from my errors and prosper.
You Get Used to Them After a While
https://www.madhedgefundtrader.com/wp-content/uploads/2016/01/Shark-e1452551147728.jpg224400Mad Hedge Fund Traderhttps://madhedgefundtrader.com/wp-content/uploads/2019/05/cropped-mad-hedge-logo-transparent-192x192_f9578834168ba24df3eb53916a12c882.pngMad Hedge Fund Trader2016-01-12 01:07:272016-01-12 01:07:27A Mad Hedge Strategy Change
It is often said that the stock market has discounted 12 out of the last four recessions.
While the market is discounting another recession now, I believe it is one of the many previously forecast that will never happen, a lot like to 18% swoon in the futures markets we saw last summer.
If anything, the reported hard data are showing that the economy is strengthening now, not weakening. The December nonfarm payroll hit a one-year high at 292,000. Christmas sales were off the charts for online merchants.
Auto production topped an 18 million rate. And this is an industry that was bankrupt only seven years ago.
But what else would you expect from a global economy that just has a $2 trillion annual tax cut dumped in its lap, thanks to lower energy prices.
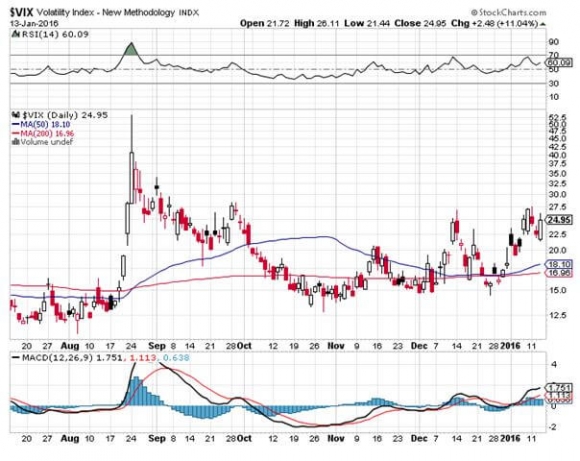
I therefore think we are within days of the final capitulation of this move. That means the Volatility Index (VIX) will peak as well, probably around $30, the top that defined the top of every spike for all of 2015, except for the August 24 flash crash day. That apex is probably only days away.
I am one of those cheapskates who buys Christmas ornaments by the bucket load from Costco in January for ten cents on the dollar, because my eleven month theoretical return on capital comes close to 1,000%.
I also like buying flood insurance in the middle of the summer when the forecast here in California is for endless days of sunshine.
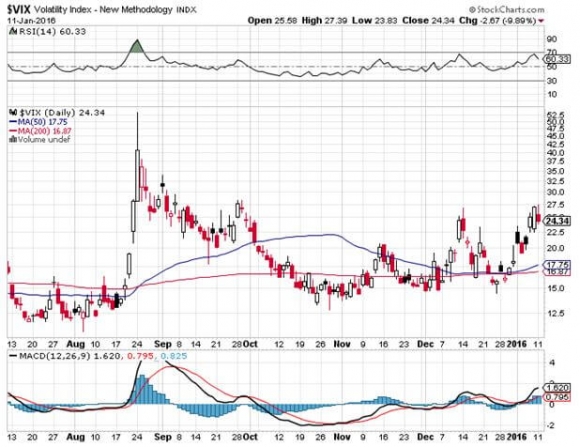
That is what we are facing now with the volatility index (VIX) where premiums have just doubled, from $15 to near $30. Get this one right, and the profits you can realize are spectacular.
Watch carefully for other confirming trends to affirm this trade is unfolding. Those would include a strong dollar, collapsing stocks, and oil in free fall, and a weak Japanese yen, Euro.
I don?t know about you, but I am seeing seven out of seven cross asset confirming price action.
The CBOE Volatility Index (VIX) is a measure of the implied volatility of the S&P 500 stock index, which has been rallying hard since oil began its precipitous slide three weeks ago.
You may know of this from the many clueless talking heads, beginners, and newbies who call this the ?Fear Index?. Long-term followers of my Trade Alert Service profited handsomely after I urged them to sell short this index three years ago with the heady altitude of 47%.
For those of you who have a PhD in higher mathematics from MIT, the (VIX) is simply a weighted blend of prices for a range of options on the S&P 500 index. The formula uses a kernel-smoothed estimator that takes as inputs the current market prices for all out-of-the-money calls and puts for the front month and second month expiration's.
The (VIX) is the square root of the par variance swap rate for a 30 day term initiated today. To get into the pricing of the individual options, please go look up your handy dandy and ever useful Black-Scholes equation. You will recall that this is the equation that derives from the Brownian motion of heat transference in metals. Got all that?
For the rest of you who do not possess a PhD in higher mathematics from MIT, and maybe scored a 450 on your math SAT test, or who don?t know what an SAT test is, this is what you need to know. When the market goes up, the (VIX) goes down. When the market goes down, the (VIX) goes up. End of story. Class dismissed.
The (VIX) is expressed in terms of the annualized movement in the S&P 500, which today is at 1,800. So a (VIX) of $14 means that the market expects the index to move 4.0%, or 72 S&P 500 points, over the next 30 days.
You get this by calculating $14/3.46 = 4.0%, where the square root of 12 months is 3.46. The volatility index doesn?t really care which way the stock index moves. If the S&P 500 moves more than the projected 4.0%, you make a profit on your long (VIX) positions.
Probability statistics suggest that there is a 68% chance (one standard deviation) that the next monthly market move will stay within the 4.0% range. I am going into this detail because I always get a million questions whenever I raise this subject with volatility-deprived investors.
It gets better. Futures contracts began trading on the (VIX) in 2004, and options on the futures since 2006. Since then, these instruments have provided a vital means through which hedge funds control risk in their portfolios, thus providing the ?hedge? in hedge fund.
But wait, there?s more. Now, erase the blackboard and start all over. Why should you care? If you sell short the (VIX) here at $24, you are picking up a derivative at a nice overbought level. Only prolonged, ?buy and hold? bull markets see volatility stay under $14 for any appreciable amount of time. That?s probably what we have now.
If you are a trader you can sell short the (VIX) futures somewhere over $20 and expect an easy profit sometime in the coming weeks. If we get another 5% rally somewhere along that way, that would do it.
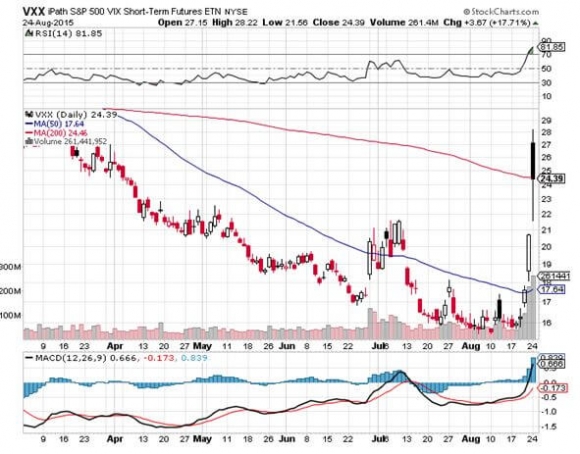
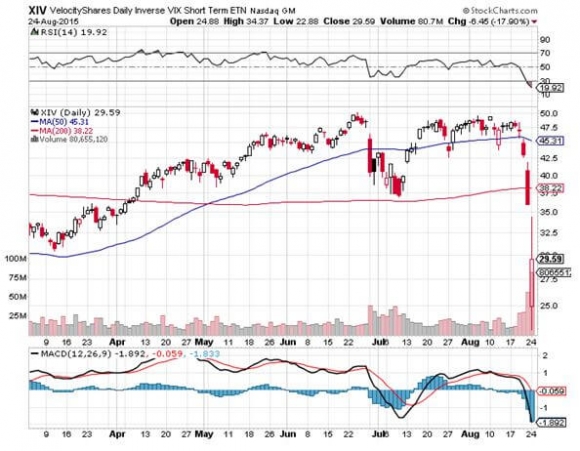
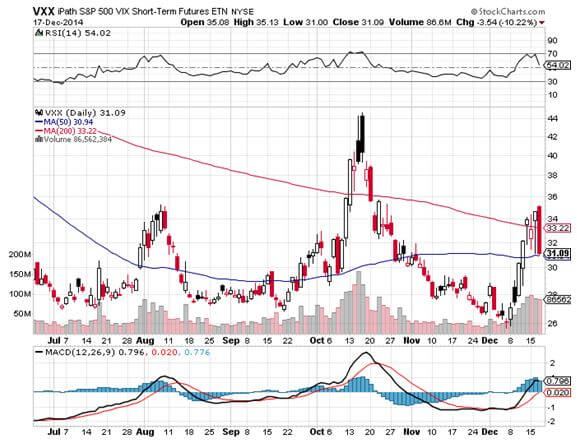
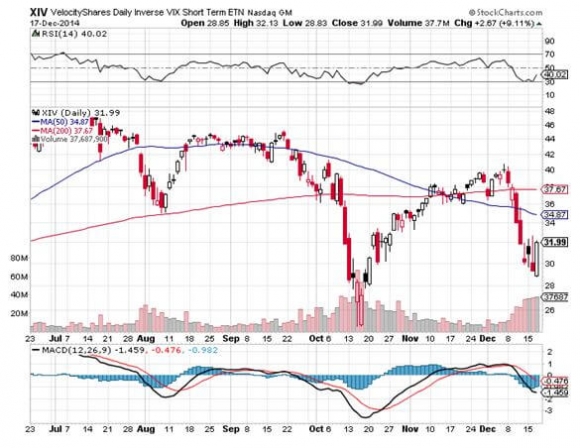
If you don?t want to sell the (VIX) futures or options outright, then you can always sell short the iPath S&P 500 VIX Short Term Futures ETN (VXX). Better yet, you can buy a short (VIX) ETN outright, the Velocity Shares Daily Inverse VIX Short Term ETN (XIV).
If you make money on this trade, it will offset losses on other long positions.
No one who buys fire insurance ever complains when their house doesn?t burn down.
Volatility Can Be Your Friend
https://www.madhedgefundtrader.com/wp-content/uploads/2014/12/Tiger-hugs-Man-e1452549843482.jpg400262Mad Hedge Fund Traderhttps://madhedgefundtrader.com/wp-content/uploads/2019/05/cropped-mad-hedge-logo-transparent-192x192_f9578834168ba24df3eb53916a12c882.pngMad Hedge Fund Trader2016-01-12 01:06:382016-01-12 01:06:38Volatility Here is Peaking
This was truly one of those mornings when you couldn?t believe your screens.
When I went to sell short the Volatility Index (VIX), I discovered that it wasn?t trading. Volatility in fact didn?t trade at all for the first 15 minutes of Monday.
Unbelievable!
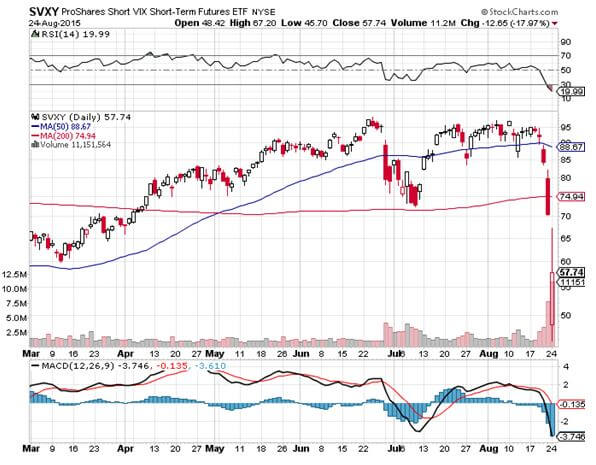
So I rushed to buy the short volatility ETF?s the Velocity Shares Daily Inverse VIX Short Term ETN (XIV) and the ProShares Short VIX Short Term Futures ETN (SVXY). But they had already started running. It was basically a chase all day.
Despite the enormous volume, it was actually quite hard to trade on Monday. Apple (AAPL) at $92?
I am one of those cheapskates who buys Christmas ornaments by the bucket load from Costco in January for ten cents on the dollar, because my eleven month theoretical return on capital comes close to 1,000%.
I also like buying flood insurance in the middle of the summer when the forecast here in California is for endless days of sunshine.
That is what we are facing now with the volatility index (VIX) where premiums finally did trade at opened at the $53 handle, a six-year high. The iPath S&P 500 VIX (VXX) Short Term Futures ETN actually doubled in three days!
Yikes!
Get this one right, and the profits you can realize are spectacular.
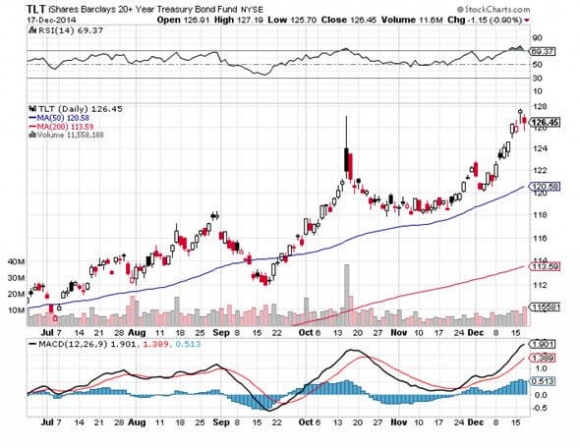
It gets better. If the top in volatility exactly coincides with the bottom in the ten year Treasury bond yields today at 1.92%, volatility could be headed back down to the 12% level where it will remain mired for months.
I double dare you to look at the charts below and tell me this isn?t happening.
Watch carefully for other confirming trends to affirm this trade is unfolding. Those would include a strong dollar, stocks, and oil, and a weak Japanese yen, Euro, and fixed income instruments of any kind.
The CBOE Volatility Index (VIX) is a measure of the implied volatility of the S&P 500 stock index, which has been rallying hard since oil began its precipitous slide three weeks ago.
You may know of this from the many clueless talking heads, beginners, and newbies who call this the ?Fear Index?. Long-term followers of my Trade Alert Service profited handsomely after I urged them to sell short this index three years ago with the heady altitude of 47% several years ago.
For those of you who have a PhD in higher mathematics from MIT, the (VIX) is simply a weighted blend of prices for a range of options on the S&P 500 index. The formula uses a kernel-smoothed estimator that takes as inputs the current market prices for all out-of-the-money calls and puts for the front month and second month expirations.
The (VIX) is the square root of the par variance swap rate for a 30 day term initiated today. To get into the pricing of the individual options, please go look up your handy dandy and ever useful Black-Scholes equation. You will recall that this is the equation that derives from the Brownian motion of heat transference in metals. Got all that?
For the rest of you who do not possess a PhD in higher mathematics from MIT, and maybe scored a 450 on your math SAT test, or who don?t know what an SAT test is, this is what you need to know. When the market goes up, the (VIX) goes down. When the market goes down, the (VIX) goes up. End of story. Class dismissed.
The (VIX) is expressed in terms of the annualized movement in the S&P 500, which today is at 1,800. So a (VIX) of $14 means that the market expects the index to move 4.0%, or 72 S&P 500 points, over the next 30 days.
You get this by calculating $14/3.46 = 4.0%, where the square root of 12 months is 3.46. The volatility index doesn?t really care which way the stock index moves. If the S&P 500 moves more than the projected 4.0%, you make a profit on your long (VIX) positions.
Probability statistics suggest that there is a 68% chance (one standard deviation) that the next monthly market move will stay within the 4.0% range. I am going into this detail because I always get a million questions whenever I raise this subject with volatility-deprived investors.
It gets better. Futures contracts began trading on the (VIX) in 2004, and options on the futures since 2006. Since then, these instruments have provided a vital means through which hedge funds control risk in their portfolios, thus providing the ?hedge? in hedge fund.
But wait, there?s more. Now, erase the blackboard and start all over. Why should you care? If you sell short the (VIX) here at $24, you are picking up a derivative at a nice overbought level. Only prolonged, ?buy and hold? bull markets see volatility stay under $14 for any appreciable amount of time. That?s probably what we have now.
If you are a trader you can sell short the (VIX) futures somewhere over $20 and expect an easy profit sometime in the coming weeks. If we get another 5% rally somewhere along that way, that would do it.
If you don?t want to sell the (VIX) futures or options outright, then you can always sell short the iPath S&P 500 VIX Short Term Futures ETN (VXX). Better yet, you can buy a short (VIX) ETN outright, the Velocity Shares Daily Inverse VIX Short Term ETN (XIV).
If you make money on this trade, it will offset losses on other long positions.
No one who buys fire insurance ever complains when their house doesn?t burn down.
Make Volatility Your Friend, Not Your Enemy
https://www.madhedgefundtrader.com/wp-content/uploads/2012/03/tiger-swimming-2-e1440506453468.jpg258400Mad Hedge Fund Traderhttps://madhedgefundtrader.com/wp-content/uploads/2019/05/cropped-mad-hedge-logo-transparent-192x192_f9578834168ba24df3eb53916a12c882.pngMad Hedge Fund Trader2015-08-25 01:07:172015-08-25 01:07:17The Volatility Peak is In
Legal Disclaimer
There is a very high degree of risk involved in trading. Past results are not indicative of future returns. MadHedgeFundTrader.com and all individuals affiliated with this site assume no responsibilities for your trading and investment results. The indicators, strategies, columns, articles and all other features are for educational purposes only and should not be construed as investment advice. Information for futures trading observations are obtained from sources believed to be reliable, but we do not warrant its completeness or accuracy, or warrant any results from the use of the information. Your use of the trading observations is entirely at your own risk and it is your sole responsibility to evaluate the accuracy, completeness and usefulness of the information. You must assess the risk of any trade with your broker and make your own independent decisions regarding any securities mentioned herein. Affiliates of MadHedgeFundTrader.com may have a position or effect transactions in the securities described herein (or options thereon) and/or otherwise employ trading strategies that may be consistent or inconsistent with the provided strategies.