After one of the wildest rides in recent memory, the stock market has ground to a complete halt. So have virtually all other asset classes as well.
You can see this in the activity of my Trade Alert service as well. After sending out Alerts as fast as I could write them for the past three months, some three or four a day, the action has slowed to a snails pace. What gives?
I think that the sudden, universal optimism we saw break out all over in November and December ended up pulling performance out of 2014 back into 2013. Traders were picking up positions not only for the yearend rally, but the January one as well.
As a result, there is nothing for us to do in January. Our New Year asset reallocation rally happened last month. The net result has been one of the most boring starts to a new year in history, with trading confined to tortuous, frustrating low volume ranges.
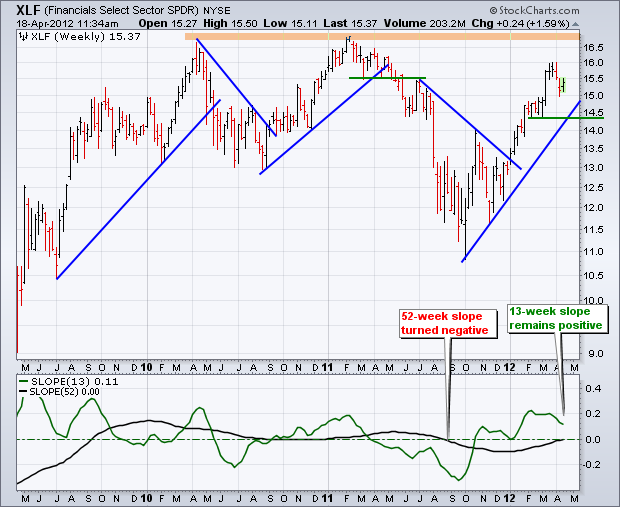
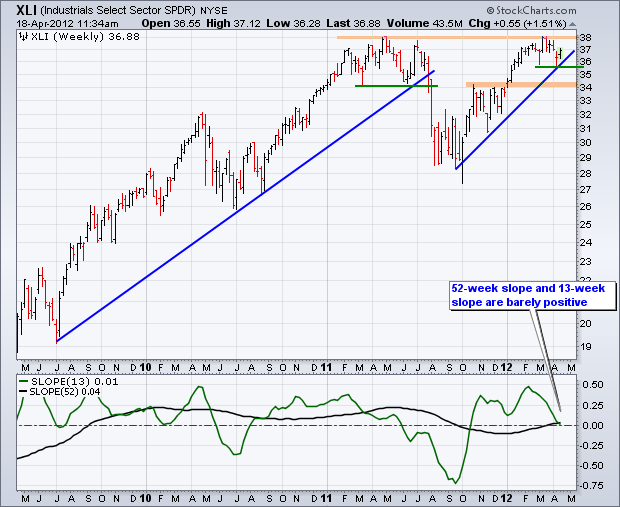
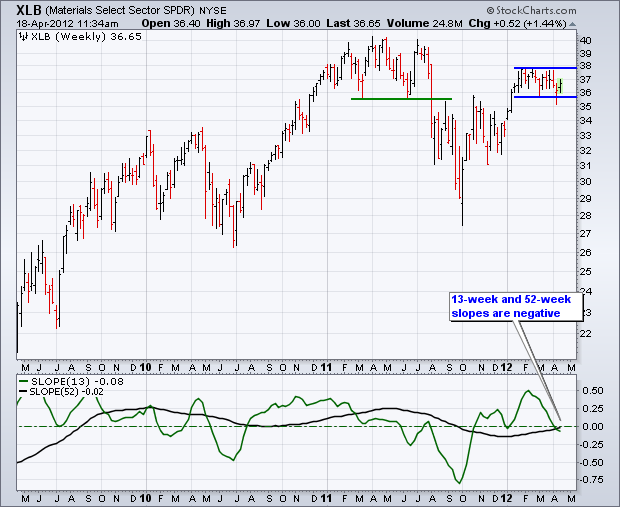
What have been the best performing assets so far in 2014? Gold (GLD), gold miners (GDX), (ABX), and bonds (TLT), (TBT), the worst performing ones of 2013. Don?t get your hopes up. These are only dead cat bounces prompted by short covering with broader, longer term bear markets.
In the meantime, the stars of last year have become the dogs of this year, like consumer cyclicals and banks. Suddenly, it has become an upside-down world, with the good becoming bad, and the bad good. Don?t expect this to last. It never does.
It gets worse. What if we didn?t pull forward only in January and the end of last year, but February and March as well? We could be sitting back on our haunches for quite a long time. Sounds like a good time to catch up on those old back issues of Diary of a Mad Hedge Fund Trader that we didn?t have time to read because trading was too frenetic.
As for me, I am getting an early start on my tax returns this year so I can figure out how much my Obamacare is going to cost me. Thanks to my spectacular, once in a lifetime performance in 2013, Uncle Sam and I have quite a lot to talk about. What? You mean a $2,000 bottle of wine purchased in Portofino on the Italian Riviera (the seaside resort featured in The Wolf of Wall Street) is not deductible? If it is for Morgan Stanley, why not me?
Another reason for the sudden silence is that investors have suddenly become very cautious. We have just had a run for the ages. From my June 14 low I made a staggering 41.15% profit for my followers. My last 14 consecutive Trade Alerts have been profitable, as has every one so far in 2014. Those are serious numbers. While almost no one else matched these numbers, quite a few traders did well too.
Suddenly protecting performance has become far more important than catching that next marginal trade. When everyone else is in the same boat, markets go very quiet, until the boat tips over.
Things aren?t going to remain this dead forever. It reminds me of a witticism voiced by President Nixon?s chairman of the Council of Economic Advisors, Herbert Stein: ?If something cannot go on forever, it will stop.?
When the Trade Alert traffic dies down, I get barraged by daily complaints from readers that I?ve gotten lazy, I?ve gotten too rich to focus on this anymore, and that I ought to be doing more. Can you blame them? With an 85% success rate with my Alerts, who wouldn?t want more?
One of the reasons that my success rate is one of the highest in the industry is that I know when to quit trading. Some 45 years trading the markets has taught me one thing. If you chase a trade that?s not there it?s a perfect formula for losing money. There is no law stating that you always must have a position. That?s what brokers want you to do, a mug?s game at best.
My advice to you? Go out and spend some of the hard earned money you made last year from my Trade Alert Service. I understand there are great deals to be had on large screen HD TV?s at Best Buy. Unfortunately, my hometown San Francisco 49ers blew a playoff game in the last 22 seconds, depriving me from a trip to New York for Super Bowl XLVIII. But if you?re from Seattle or Denver, you definitely have something better to do for the week leading up to February 2.
Out With the Old?


And In With The New...