For those who wisely ignored my advice to sell the SPDR Gold Trust Shares ETF (GLD) June $160 Puts on May 3, good for you. The options are now trading at $10.50 and you have a profit of 147%, adding 14.7% to your annual return. This will no doubt be your home run trade of the year.
If you still have these, it is time to give thanks for your good fortune and head for the sidelines. You don?t get to do trades like this very often. Selling out here allows you to avoid the time decay hit as we run into expiration on June 15.
Gold has now fallen $100 since my last ill-timed sell recommendation. Tough luck if the rumor that the International Monetary Fund was going to sell its gold reserves to bail out Europe hit the wires two days later. I had heard about this from my European central banker friends a month earlier, which is why I put on such a big short position in the first place. Alas, timing is everything in this business.
The yellow metal is now approaching both a severely oversold condition and major support at $1,510, and it would be unwise to continue to run the position. The same is true for every other risk asset in the universe, including the S&P 500 (SPX), the Russell 2000 (IWM), the NASADQ (QQQQ), oil (USO), silver (SLV), copper (CU), the Euro (FXE), and the Australian dollar (FXA).
Use whatever metaphor you want; the rubber band has been stretched to the breaking point, the paddlers have all bunched up at one end of the canoe. The dollar index is up 13 consecutive days, and the Dow is down 9 out of 10. How long do you want to keep flipping a coin and relying on heads coming up every time?
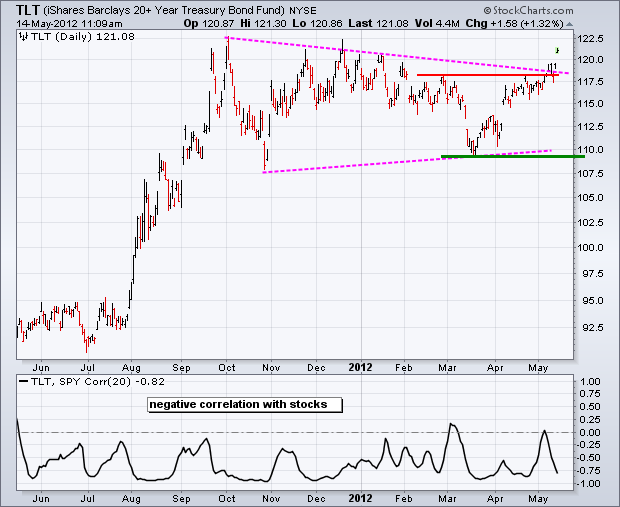
In the meantime, the big ?RISK OFF? assets of Treasury bonds (TLT) and the Japanese yen (FXY) are starting to make rather shrill topping noises, giving additional signals that it is time to shrink your book.
Finally, I have my own performance to look at, with May thankfully the most profitable in the 18 month life of my Trade Alert Service. As of this morning?s marks, I am up an eye popping 22% so far this month. If the past is any guide, big numbers like these are a great ?sell? indicator. Mean reversion can be a cruel and unfeeling bitch, worse than an Internet date, so watch out.
Take profits here and you will have plenty of dry powder to resell the barbarous relic and other risk assets in any dead cat, short covering rally that may unfold into the May month end book closing and into June. Then we can position for the final low in the summer, which should be downright scary.
Sell these ETF Alternatives:
the DB Gold Short ETN (DGZ) 1X short gold
the DB Double Short Gold ETN (DZZ) 2X short gold
or buy to cover the SPDR Gold Trust Shares ETF (GLD) sold short on Margin outright
I managed to catch my longtime friend, technical analyst, Charles Nenner, on the fly between London appointments yesterday. The must go to guy for big hedge funds, family offices, sovereign wealth funds, and high net worth individuals, says that the global markets are on the verge of completing round one of a major risk off trade, and there is much more to come.
A ferocious short covering rally could ensue as early as next week and run well into June. This is a rally you want to slam big time. A failure to reach new highs will lead to substantial new lows by August. To me, this means that the short selling opportunity of the year is in the process of setting up.
Intrigued, I asked Charles to go into as much detail on a ticker by ticker basis as London?s spotty cell phone coverage and bumpy roads would permit. I break out his answers below by asset class.
Equities
The S&P 500 will start one more run at a new high for the year next week, or the following week at the latest. A failure heralds a much more serious correction that could last into August. Use a downside break of 1,325 as a sell signal. The Russell 2000 looks much more dubious. Pierce $77.20, spitting distance from here, and we will soon be visiting $71.
NASDAQ (QQQ) has recently been underperforming recently and could lead any new charge to the downside. Emerging markets (EEM) fighting a monkey on their back with plunging commodity prices look even worse, and may not even bother to rally at all in this bounce. They look weak straight into July.
I covered a few individual high profile equities with Charles. He doesn?t like Apple (AAPL), which he sees touching $540, down $100 from the post earnings top. Ditto for IBM (IBM) which has probably squeezed out as much performance as it can for the time being. He says my short in Pulte Homes (PHM) will blow up in my face, remaining strong into July. Disney (DIS) looks pretty good and should maintain strength for a few more months. On the other hand, Boeing (BA) looks like it is rolling over and will track the indexes on any move south.
Bonds
Charles was ultra-bearish on the Treasury bond market, believing that the 30 year bull market peaked last September. The current run to those highs will fail, setting up one of the biggest short side trades in the coming decade. His favorite instrument here is the (TBT), which he recommends selling puts on four months out. The expected disorder and thin markets this summer could take ten year? Treasury yields as low as 1.57% from today?s 1.78%, but won?t be able to sustain beyond that. His downside target for the 30 year is a gob smacking 2.6% yield.
Foreign Exchange
The Euro (FXE) has already breached his first downside target of $1.2850. If we can?t recover that level soon, next on the menu is $1.2420. His longer term charts are showing a final goal of $1.00, but he refrains from mentioning this to the media because it is so extreme.
The Japanese yen (FXY) has just completed a nice one month consolidation and will resume a major long term downtrend imminently. If the cash market clears ?80.60, pennies from here, a much bigger move down is in store for the ETF, from the current $122.40 to $119.70, then $114. The Australian dollar (FXA) is looking equally sick and could be printing $89.5 in the months ahead. Further interest rate cuts by the Reserve Bank of Australia to combat a fading economy in China will add fat to the fire.
?Energy
The wily Dutchman has been negative on oil (USO) since it peaked at $110 a barrel in early March. It has already hit his initial goal of $93. If the markets move into a broader ?RISK OFF? mode, we could see $68 by November, no doubt sending chills down the spines of oil men everywhere.
Natural Gas (UNG), the worst performing asset of 2012, is enjoying a brief rally that may continue until the end of May. After that, the ETF for this unloved molecule should crater from $18.90 to below $14 this summer, around when the gas storage Armageddon hits. Longer term, he wants to scale into the long side, but not through (UNG), which has a huge contango and the worst tracking error of any ETF alive. He prefers to participate in any gas recovery through Canadian gas producer, EnCana (ECA), which derives almost 100% of its revenues from CH4.
Commodities
Nenner was early in jumping all over the copper (CU) trade, which was the first asset class to peak this year, in early February, unloading the red metal under $3.80. He thinks copper could trade as low as $2.80 in this cycle, down 28% from here. He also has been negative on the grain complex for some time, and thinks corn (CORN) has another 10% of downside to go. There he wants to load the boat for a potential double in coming years.
Precious Metals
Charles argues that the precious metals will be anything but a safe haven. We could get a bounce in gold off of $1,510 in the near future. But if that make or break level doesn?t hold, the barbarous relic could be paying a visit to $1,369, delivering the gold bugs a fatal dose of insecticide. Silver may challenge $23 soon, and substantially lower if no one steps up there.
Charles hails from Holland, and has a long career that includes stints at medical school, Merrill Lynch, Rabobank, and ten years at the Vampire Squid, Goldman Sachs. He has spent three decades developing his proprietary Cycle Analysis System, which generates calls of tops and bottoms for every major market in the world.
Charles developed a huge following after 2007, when he accurately nailed the top in the Dow at 14,500 and urged his clients to put on short positions when everyone else was predicting that the market would keep grinding higher. Today, Charles Nenner counts major hedge funds, banks, brokerage houses, and high net worth individuals among his clients. To learn more about Charles Nenner?s cutting edge research organization, please visit his website by clicking here at http://charlesnenner.com/ .
I have been following Charles? daily research reports myself for many years, and found them to be uncannily accurate. Whenever I feel like playing a three dimensional mental chess game, I call him to argue about the connections between human behavior and mathematics, a key market driver.
I thanked him for his time, and offered to share a bottle of the fiery Dutch spirit, Bols, on his coming trip to San Francisco. I also told him that the next time Holland?s canals freeze over, an event that happens only once a decade, I would race him mano a mano in the "Elfstedentocht," a 125 mile race around the country?s canals on ice skates.
My Go To Source for Charts
The "Elfstedentocht"
https://www.madhedgefundtrader.com/wp-content/uploads/2012/05/image-313704-galleryV9-cvzp.jpg266399DougDhttps://madhedgefundtrader.com/wp-content/uploads/2019/05/cropped-mad-hedge-logo-transparent-192x192_f9578834168ba24df3eb53916a12c882.pngDougD2012-05-16 23:02:262012-05-16 23:02:26A Conversation With Charles Nenner
?For every one book written about deflation there are 25 written about inflation. We are starting to look more like Japan every day,? said Scott Shellady at Bradford Capital Management.
https://www.madhedgefundtrader.com/wp-content/uploads/2012/05/writing-a-book.jpg179400DougDhttps://madhedgefundtrader.com/wp-content/uploads/2019/05/cropped-mad-hedge-logo-transparent-192x192_f9578834168ba24df3eb53916a12c882.pngDougD2012-05-16 23:01:552012-05-16 23:01:55May 17, 2012 - Quote of the Day
As a potentially profitable opportunity presents itself, John will send you an alert with specific trade information as to what should be bought, when to buy it, and at what price. Read more
https://www.madhedgefundtrader.com/wp-content/uploads/2011/10/slider-05-trader-alert.jpg316600Mad Hedge Fund Traderhttps://madhedgefundtrader.com/wp-content/uploads/2019/05/cropped-mad-hedge-logo-transparent-192x192_f9578834168ba24df3eb53916a12c882.pngMad Hedge Fund Trader2012-05-16 13:34:072012-05-16 13:34:07Trade Alert - (GLD) May 16, 2012
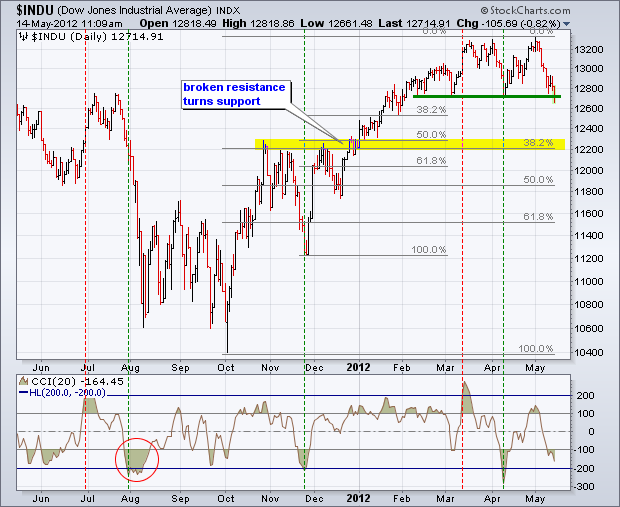
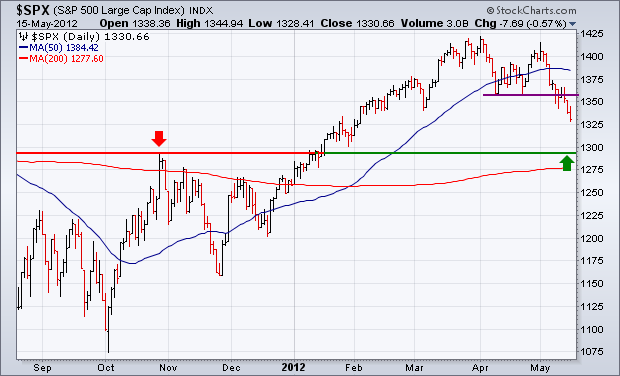
They say a picture is worth a 1,000 words, so here are 4,000 words worth. My friends at www.stockcharts.com put together this series of charts establishing beyond any reasonable doubt that the ?RISK ON? trade is breaking down across all asset classes.
Everything is breaking down, simultaneously and in unison, including the S&P 500 (SPX), Gold (GLD), Silver (SLV), Oil (USO), Copper (CU), the Euro (FXE), the Australian dollar (FXA), and the Canadian dollar (FXC). In the meantime, Treasury bonds (TLT), (TBT) are moving from strength to strength.
The news from Europe can only get worse. An American recession, considered impossible by strategists only a month ago, is now looming large as our own economic data continues to deteriorate. The flight safety has exploded into a stamped, driving the US dollar index up 12 consecutive days, a new record.
I have included a cartoon below from my old employer, The Economist, that neatly sums up the implications of the Socialist win in the French presidential elections. German chancellor, Angela Merkel, is meeting French president, Fran?ois Hollande, for dinner at Das Austerity Euro-Caf?. Austerity preaching Merkel is having a miniscule single sausage for dinner, while Hollande is enjoying a sumptuous repast and obviously ordering the most expensive wine from the list.
The cartoon would be funnier if it weren?t so true. Austerity is now suffering a retreat on the order of Napoleon?s retreat from Russia in the winter of 1815. Her Christian Democratic Union party suffered its worst post WWII defeat in last weekend?s North Rhine-Westphalia elections. It is now looking like Germany will have to accept a higher inflation rate as the price for bailing out Europe, something it is loath to do. Needless to say, this is terrible news for the Euro.
If these charts continue to break down, as the news flow dictates they should, here are my immediate downside targets.
https://madhedgefundtrader.com/wp-content/uploads/2019/05/cropped-mad-hedge-logo-transparent-192x192_f9578834168ba24df3eb53916a12c882.png00DougDhttps://madhedgefundtrader.com/wp-content/uploads/2019/05/cropped-mad-hedge-logo-transparent-192x192_f9578834168ba24df3eb53916a12c882.pngDougD2012-05-15 23:03:122012-05-15 23:03:12Charts Are Breaking Down All Over
A major plank in my golden age scenario for the 2020?s is the collapse of the cost of energy. This won?t occur because of a single big discovery, but from a 1,000 small ones that aggregate together to create a leveraged effect. The upshot is that we may be free of OPEC in 3-5 years, and completely energy independent not long after that. The impact on financial markets and global standards of living will be huge.
To flesh out my arguments, I called Dr. Amory B. Lovins, chief scientist of the Rocky Mountain Institute, who spends a lot of time thinking about these things. He says that our current energy addiction makes us dig up about four cubic miles of primordial swamp goo to burn each year. That costs the US about $2 billion a day, and another $4 billion a day when the cost of defending unstable supplies in the Middle East is thrown in.
Some 75% of the electricity generated powers buildings, three fourths of the oil fuels transportation, and the rest goes to industry. Demand for Texas tea is already falling dramatically. Since 1975, the amount of oil needed to produce a dollar of GDP has plunged a stunning 60%. Coal production peaked in 2005 and has since lost 25% of the market for power utilities, mostly to natural gas. ?Peak oil? is becoming a reality, not in supply terms, but in demand.
This is only the beginning of a major long term trend that still has decades to run. Obama?s move to raise mileage on US made cars from 25 to 55 miles per gallon by 2025 will have a crucial impact. While in the past Detroit lawyered up and fought such policies tooth and nail, now it is reengineering to achieve this ambitious goal. GM says it will offer a hydrogen fuel cell powered subcompact in five years for $35,000. Some two thirds of fuel consumption is caused by weight, so the adoption of cheap ultra-strong carbon fiber composite technology from the aircraft industry, which offers five times the strength of steel at a tenth of the weight, will give them a major advantage. BMW, Volkswagen, and Audi all plan to bring such vehicles to the market in 2013.
Alternatives will also make a growing contribution. While they account for only 3% of the total US energy supply, 50% of the new capacity added since 2010 were powered by alternatives. Solar clearly is cost competitive in the Southwest, as is wind in Texas. All that is lacking are the transmission lines to bring power to the energy hungry, populous coasts.
The cost of solar has recently dropped as much as 80%, as highlighted by the Solyndra bankruptcy. Prices have fallen so fast that it may wipe out all the current equity investors before a new industry rises up to replace them. Radical change can?t happen without casualties along the way.
Don?t expect any action from a gridlocked congress to make this easy. But the marketplace is moving ahead without them. Companies are turning into world class conservationists, desperate to find new ways to reduce costs, now that labor has been cut to the bone. The big surprise here will be in building design, which can bring immediate and large savings in heating and air conditioning costs that fall straight to the bottom line.
No great sacrifices will be required to achieve this energy revolution. If existing energy savings technology were applied to lights, air conditioners, refrigerators, and TV?s, the combined energy savings would be about $1 trillion a year, enough to take 300 coal fired power plants offline.
The implications of this shift away from oil will be global. Much of the world?s developing country debt is driven by high energy bills. So the boost to global economic growth enabled by cheap oil will be enormous. Consuming countries like China, Japan, and Europe will benefit greatly at the expense of producing countries in the Middle East. With oil under $50, that volatile region of the world will shrink to irrelevance, certainly not worth defending.
This is all highly beneficial for risk assets everywhere and is the basis for my own forecast of a Dow average of 50,000 by 2030. It is also massively dollar possible as the disappearance of oil import will shrink our trade deficit dramatically and push our current account deficit into a surplus. Perhaps this is what the recent extraordinary strength of the dollar is trying to tell us. The very long term charts are suggesting that this could become a multiyear affair.
Going Out of Style?
https://madhedgefundtrader.com/wp-content/uploads/2019/05/cropped-mad-hedge-logo-transparent-192x192_f9578834168ba24df3eb53916a12c882.png00DougDhttps://madhedgefundtrader.com/wp-content/uploads/2019/05/cropped-mad-hedge-logo-transparent-192x192_f9578834168ba24df3eb53916a12c882.pngDougD2012-05-15 23:02:562012-05-15 23:02:56The Energy Revolution on Our Doorstep
?The reasonable man adapts himself to the world. The unreasonable one persists in trying to adapt the world to himself. Therefore, all progress depends on the unreasonable man? said George Bernard Shaw, an early 20th century writer and philosopher.
https://www.madhedgefundtrader.com/wp-content/uploads/2012/05/The_Thinker_Auguste_Rodin.jpg400268DougDhttps://madhedgefundtrader.com/wp-content/uploads/2019/05/cropped-mad-hedge-logo-transparent-192x192_f9578834168ba24df3eb53916a12c882.pngDougD2012-05-15 23:01:482012-05-15 23:01:48May 16, 2012 - Quote of the Day
As a potentially profitable opportunity presents itself, John will send you an alert with specific trade information as to what should be bought, when to buy it, and at what price. Read more
00Mad Hedge Fund Traderhttps://madhedgefundtrader.com/wp-content/uploads/2019/05/cropped-mad-hedge-logo-transparent-192x192_f9578834168ba24df3eb53916a12c882.pngMad Hedge Fund Trader2012-05-15 13:15:482012-05-15 13:15:48Trade Alert - (IWM) May 15, 2012
Panic is on deck, to use the baseball terminology that my foreign readers are often attempting to decipher. That is the only conclusion one can reach after getting gob smacked by the price action this morning. Copper got spanked for eight cents, oil burned $2, gold shed another $26, and silver puked 70 cents.
The tantrum like stock behavior in producing and equipment companies, like Freeport McMoRan (FCX) and Caterpillar (CAT) has been atrocious. How many of you out there know that JP Morgan (JPM) is the largest holder of futures contracts in the silver market and just got hit with a massive margin call? Why is all this happening on the 100 year anniversary of the sinking of the HMS Titanic?
Blame it all on Uncle Buck, whose recent steroid treatments has enabled him to unload the pounds, shed the fat, and adopt a new, more virile attitude towards life. Every other currency now looks like a 98 pound weakling. We now awake each morning to be greeted by the latest disastrous headline from Europe that accelerates the capital flight from the continental currency.
The Euro (FXE), (EUO), is deteriorating from bad to worse, with the foreign exchange community now clearly gunning for the next short term support at $1.26. Look at a ?10 note these days and it has recently printed upon it ?Abandon hope all ye who enter here.?
Traditional diversification currencies, like the Australian (FXA) and Canadian dollars (FXC) are now biting the hands that fed them, dragged down by their export commodities? pitiful performance. Hard as it is to imagine, the Ausie has been the world?s worst performing major currency this year, even underperforming the dreadful euro. Australian readers who followed my advice to pay for their summer vacations in advance at the $1.10 that prevailed at the beginning of the year are smiling. Those they didn?t are now looking for a discount caravan at a remote, dingo plagued campsite somewhere in the Outback.
The Japanese yen, the currency that everyone loves to hate, has perked up to a flight to safety bid while the rest of the world goes to hell in a hand basket. We are currently in between Bank of Japan quantitative easings there, so don?t expect this to last much longer. The tipping point into hyper debt driven, economic Armageddon there creeps ever forwards with each passing day on the calendar.
Take a look at the charts below for the US Dollar Index and it is obvious that things may soon get a whole lot worse. For starters, the dollar has only rallied back to the midpoint of a multiyear range. To get back up to the top of that range it needs to appreciate another 10%. To understand why this is a problem, look at the second chart that proves a tremendous inverse correlation between the dollar and commodities. A strong dollar always leads to falling demand for the hard stuff.
The third chart suggests that the other grotesquely overvalued asset class, US stocks, is also cruising for a bruising. Commodities led equities in this downturn by three months, as they usually do. If they break support here, then they will easily drag the (SPX) down to my medium term target of 1,275, off a heart thumping 10.3% from the recent top. If the economic data continues to worsen on a daily basis, as I have been chronicling on a daily basis for the last two months ad naseum and ad absurdum, then we have a clear shot at the fall, 2011 low at 1,060.
Oops, There Goes My Equity Portfolio
https://www.madhedgefundtrader.com/wp-content/uploads/2012/05/titanic_sinking1.jpg260400DougDhttps://madhedgefundtrader.com/wp-content/uploads/2019/05/cropped-mad-hedge-logo-transparent-192x192_f9578834168ba24df3eb53916a12c882.pngDougD2012-05-14 23:04:352012-05-14 23:04:35Strong Dollar Spells Death for Commodities
When I heard that the managers of exchange traded funds were raking in huge fees from lending out shares in their index portfolios I thought ?That?s great, the managers are really working hard to maximize returns for their shareholders.? These shares are borrowed by hedge funds which then then sell short. Then I found out the ugly truth.
I was horrified to learn recently that the fund operators are keeping a substantial portion of the fees to be paid out in profits and bonuses for themselves. According to an investigation by the Financial Times, the largest ETF operator, Blackrock, kept, $57 million of $164 million in lending fees earned, while State Street kept 15% of the total. Others are thought to keep as much as 50%.
The problem is that the investors take all the risk in this securities lending, but reap only a portion of the benefit. Sure, the lending is fully collateralized and marked to market on a daily basis. But has anyone figured out what happens if your borrower goes bust, as hedge funds are frequently prone to do? Involvement in litigation can cost millions, and I?m pretty sure that the managers aren?t assuming their share of that liability.
By engaging in this activity, fund managers are making it easy for speculators to drive down the value of the lending fund, wiping out shareholder equity. Am I the only one who sees a conflict of interest here? It is the classic sort of ?Heads, I win, tails, you lose? type of management philosophy which has sickened me over the years and seems to be getting worse, but which has become institutionalized.
ETF operators insist that this activity is disclosed in the prospectus. But the exact share of the profit split they keep isn?t. You can always vote with your feet, and flee the funds that are withholding the most in fees. Good luck figuring out who they are. This is the kind of regulation that the industry is spending hundreds of millions of dollars in Washington to defeat. And you wonder why people are so pissed off at Wall Street.
I?ll Keep the Change
https://www.madhedgefundtrader.com/wp-content/uploads/2012/05/HedgeFund-Copy2.jpg294320DougDhttps://madhedgefundtrader.com/wp-content/uploads/2019/05/cropped-mad-hedge-logo-transparent-192x192_f9578834168ba24df3eb53916a12c882.pngDougD2012-05-14 23:03:552012-05-14 23:03:55ETF Scam of the Week
Legal Disclaimer
There is a very high degree of risk involved in trading. Past results are not indicative of future returns. MadHedgeFundTrader.com and all individuals affiliated with this site assume no responsibilities for your trading and investment results. The indicators, strategies, columns, articles and all other features are for educational purposes only and should not be construed as investment advice. Information for futures trading observations are obtained from sources believed to be reliable, but we do not warrant its completeness or accuracy, or warrant any results from the use of the information. Your use of the trading observations is entirely at your own risk and it is your sole responsibility to evaluate the accuracy, completeness and usefulness of the information. You must assess the risk of any trade with your broker and make your own independent decisions regarding any securities mentioned herein. Affiliates of MadHedgeFundTrader.com may have a position or effect transactions in the securities described herein (or options thereon) and/or otherwise employ trading strategies that may be consistent or inconsistent with the provided strategies.