• support@madhedgefundtrader.com
  • Member Login
Mad Hedge Fund Trader
  • Home
  • About
  • Store
  • Luncheons
  • Testimonials
  • Contact Us
  • Click to open the search input field Click to open the search input field Search
  • Menu Menu
MHFTR

Trading the New Volatility

Diary, Newsletter, Research

I have been trading the Volatility Index (VIX) since it was first created in 1993.

Let me tell you, the Volatility Index we have today is not your father's Volatility Index.

The (VIX) was originally a weighted measure of the implied volatility of just eight S&P 100 at-the-money put and call options.

Ten years later, in 2004, it expanded to use options based on a broader index, the S&P 500, which allows for a more accurate view of investors' expectations on future market volatility. That formula continues until today.

There were two generational lows in the (VIX) that have taken place since inception.

The first was in 1998 during the heyday of the mammoth hedge fund Long-Term Capital Management. The firm sold short volatility down to the $8 level and used the proceeds to buy every bullish instrument in the universe, from Japanese equities to Danish mortgage bonds and Russian government debt.

Then the Russian debt default took place and the (VIX) rocketed to $40. LTCM suffered losses in excess of 125% of its capital, and went under in two weeks. It took two years to unwind all the positions, while the (VIX) remained $40 for a year.

To learn more detail about this unfortunate chapter in history, please read When Genius Failed by Roger Lowenstein. The instigator of this whole strategy, John Meriwether, once tried to hire me and is now safely ensconced in a massive estate at Pebble Beach, CA.

The second low came in January of 2018, when the (VIX) traded down to the $9 handle. This time around, short exposure was industrywide. By the time the (VIX) peaked on the morning of February 6, some $8 billion in capital was wiped out.

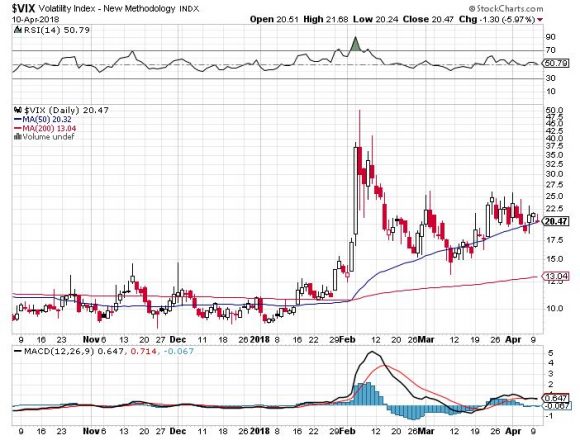
So here we are back with a (VIX) of $20.48. But I can tell you that there is no way we have a (VIX) $20.48 market.

This is because (VIX) is calculated based on a daily closing basis. It in no way measures intraday volatility, which lately has become extreme.

During 11 out of the last 12 trading days, the S&P 500 intraday range exceeded 2%. This is unprecedented in stock markets anywhere any time.

It has driven traders to despair, driven them to tear their hair out, and prompted consideration of early retirements. The price movements imply we are REALLY trading at a (VIX) of $50 minimum, and possibly as high as $100.

Of course, everyone blames high frequency traders, which go home flat every night, and algorithms. But there is a lot more to it than that.

Heightened volatility is normal in the ninth year of a bear market. Natural buyers diminish, and volume shrinks.

At this point the only new money coming into equities is through corporate share buybacks. That makes us hostage to a new cycle, that of company earnings reports.

Firms are now allowed to buy their own stock in the run up to quarterly earnings reports to avoid becoming afoul of insider trading laws. So, the buyers evaporate a few weeks before each report until a few weeks after.

So far in 2018 this has created a cycle of stock market corrections that exactly correlate with quiet periods. This is when the Volatility Index spikes.

And because the entire short volatility industry no longer exists, the (VIX) soars higher than it would otherwise because there are suddenly no sellers.

So, what happens next when companies start reporting Q1, 2018 earnings? They announce large increases in share buybacks, thanks to last year's tax bill. And a few weeks later stocks take off like a scalded chimp, and the (VIX) collapses once again.

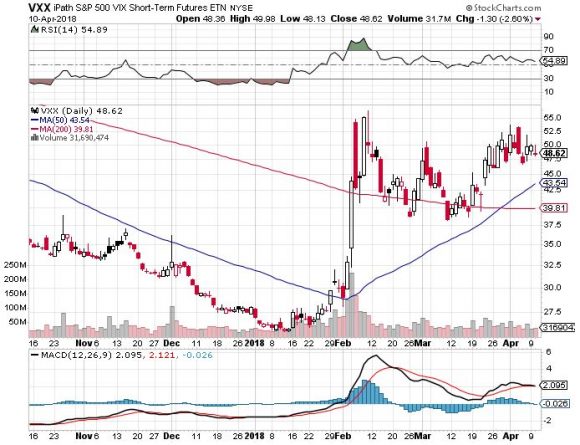
That's why the Mad Hedge Fund Trader Alert Service is short the (VIX) through the IPath S&P 500 VIX Short Term Futures ETN (VXX) April, 2018 $60-$65 in-the-money vertical bear put spread.

Just thought you'd like to know.


https://www.madhedgefundtrader.com/wp-content/uploads/2018/04/John-story-1-image-3-e1523400566228.jpg 291 200 MHFTR https://madhedgefundtrader.com/wp-content/uploads/2019/05/cropped-mad-hedge-logo-transparent-192x192_f9578834168ba24df3eb53916a12c882.png MHFTR2018-04-11 01:07:422018-04-11 01:07:42Trading the New Volatility
MHFTR

April 11, 2018

Tech Letter

Mad Hedge Technology Letter
April 11, 2018
Fiat Lux

Featured Trade:
(WHY YOU SHOULD BE BETTING THE RANCH ON TECHNOLOGY),

(AMZN), (NFLX), (FB), (Samsung), (Tencent)

https://madhedgefundtrader.com/wp-content/uploads/2019/05/cropped-mad-hedge-logo-transparent-192x192_f9578834168ba24df3eb53916a12c882.png 0 0 MHFTR https://madhedgefundtrader.com/wp-content/uploads/2019/05/cropped-mad-hedge-logo-transparent-192x192_f9578834168ba24df3eb53916a12c882.png MHFTR2018-04-11 01:06:372018-04-11 01:06:37April 11, 2018
MHFTR

Why You Should Be Betting the Ranch on Technology

Tech Letter

Global IT spending is forecasted to surpass $3.7 trillion in 2018, a boost of 6.2% YOY, according to a report released by leading technology research firm Gartner, Inc. (IT).

This year is the best growth rate forecasted since 2007, and is a precursor to a period of flourishing IT growth.

IT budgetary resilience is oddly occurring in the face of a tech backlash engulfing Mark Zuckerberg as collateral damage during higher than normal volatility due to an unstable geo-political environment and nonstop chaos in the White House.

Zuckerberg's reputation has been torn to shreds by the media and politicians alike.

Tech has had better weeks and months, for instance as this past January when tech stocks went up every day. Facebook (FB) still had a great business model in January as well.

The biggest takeaway from the report was the outsized capital investments going into enterprise software, which spurs on exponential business formation.

Enterprise software will successfully record its highest spend rate increasing by 11.1% YOY to $391 billion. This is far and away an abnormally fast pace of increase, but is completely justified based on every brick and mortar migrating toward data harnessing.

The software industry will benefit immensely by the universal digitization of all facets of life as software acts as the tool that businessmen use to propel companies to stardom.

Application software spending will healthily rise into 2019, and infrastructure software also will continue to grow, boosted by the revamping of laggard architecture.

Data center systems are predicted to grow 3.7% in 2018, down from 6.3 percent growth in 2017. The longer-term outlook continues to have challenges, particularly for the storage segment.

The lower relative rate of spend is exacerbated by the chip shortage for memory components, and prices have shot up faster than previously expected.

The new Samsung Galaxy 9 cost an additional $45 in semiconductor chip costs because of the importunate costs that sabotage cost structures.

Exorbitant pricing was set to subside in the early part of 2018, but the dire shortage of chips is here to stay until the end of 2018.

Even though the supply side has ramped up 30%, demand is far outpacing supply, spoiling any chance for tech devices to be made on the cheap.

Global spend for digital devices will grow in 2018, reaching $706 billion, an increase of 6.6 percent from 2017. Not only will we see the standard characters such as phones and tablets, but new creative ways to produce devices in the micro-variety will soon populate our shores.

Amazon Alexa and Apple's HomePod are just the beginning and will spawn micro-devices that would fit nicely into a flashy James Bond film.

The demand for ultra-mobile premium smartphones will slow in 2018 as more consumers delay their upgrade and feel comfortable using older devices -- kind of like a smashed-up Volvo station wagon handed down from sibling to sibling.

In times of uncertainty, corporations hold back spending until the near-term variables can be flushed out, and unforeseen costs causing operational turbulence can be anticipated.

However, the industry has brushed aside the turmoil that has attempted to infiltrate the core growth story.

Investors cannot overlook that total tech spending growth for 2018 is the highest in the past 15 years.

Next quarter's earnings are now on tap, and investors will turn to fundamentals as a cheat sheet for what's in store.

It's undeniable that currently tech stocks aren't cheap anymore. They are also more expensive than they were at the beginning of the year barring Facebook and a few other stragglers.

The momentum has intensified with the five biggest tech firms accounting for more than 14% of the S&P 500 index's weighting.

Tech's relative performance has fended off the bears with PE multiples down a paltry 4.9% this year compared to the cratering of 11.4% in the general market.

And tech is still trading at a tiny fraction of the crisis of the dot-com era.

The outsized reinvestments back into business models don't tell the tale of an industry brought down to its knees begging for salvation.

Look no further than across the Pacific Ocean. Samsung Electronics Co. represents almost 25% in South Korea's Kospi index. At the same time, Asia's most valuable company, Tencent Holdings, makes up almost a 10% weighting in Hong Kong's Hang Seng Index.

Back stateside, about 90% of US tech firms beat revenue estimates in the last quarter of 2017, marking the best success rate for any industry.

The positive sentiment has continued into this year with wildly bullish expectations led by the FANG stocks.

The broader volatility is a gift to investors who hesitated and missed the monster rally that has graced tech the past few years.

Tech is vital to emerging markets. And this is the first year since 2004 that tech constitutes the biggest sector in the MSCI Emerging Markets Index blowing past financials.

Tech had a 28% weighting at the end of 2017, the weighting more than doubling from six years ago.

As it stands today, tech enjoys light regulation and by a long mile. Tech is actually the least regulated industry in America and has used this period of light regulation to stack up profits to the sky.

Banks are nine times more regulated than tech companies, and manufacturing companies are five times more regulated.

Legislation such as Dodd-Frank has done a lot to taper the excesses of the sub-prime frenzy that almost took down Wall Street.

The lean regulation has helped tech companies such as Facebook and Google build a gilt-edged competitive advantage that has been exploited to full effect.

After the Fed closed the curtains on its QE program, tech and its earnings are the sturdiest pillar of the nine-year bull market.

The Street is reliant on the big players to earn its crust of bread and show investors that tech isn't just a flash in the pan.

The two numbers acting as the de-facto indicators of the health of the overall economy are Netflix's subscriber growth numbers and Amazon's AWS Cloud revenue.

These two companies do not focus on profits and are the prototypical tech growth companies.

If they beat on these metrics, the rest of tech should follow suit.

The market is entirely dependent on big tech to drag investors through the time of transition. My bet is that tech will over-deliver booking stellar earnings.


__________________________________________________________________________________________________

Quote of the Day

"By giving the people the power to share, we're making the world more transparent." - said Facebook CEO Mark Zuckerberg

https://www.madhedgefundtrader.com/wp-content/uploads/2018/04/Quote-of-the-Day-Zuckerberg-e1523389996413.jpg 275 200 MHFTR https://madhedgefundtrader.com/wp-content/uploads/2019/05/cropped-mad-hedge-logo-transparent-192x192_f9578834168ba24df3eb53916a12c882.png MHFTR2018-04-11 01:05:292018-04-11 01:05:29Why You Should Be Betting the Ranch on Technology
Douglas Davenport

MOT Follow-Up to Text Alerts (XOM) Trade April 10, 2018

MOT Trades

While the Global Trading Dispatch focuses on investment over a one week to six-month time frame, Mad Options Trader, provided by Matt Buckley, will focus primarily on the weekly US equity options expirations, with the goal of making profits at all times. Read more

https://madhedgefundtrader.com/wp-content/uploads/2019/05/cropped-mad-hedge-logo-transparent-192x192_f9578834168ba24df3eb53916a12c882.png 0 0 Douglas Davenport https://madhedgefundtrader.com/wp-content/uploads/2019/05/cropped-mad-hedge-logo-transparent-192x192_f9578834168ba24df3eb53916a12c882.png Douglas Davenport2018-04-10 15:11:372018-04-10 15:11:37MOT Follow-Up to Text Alerts (XOM) Trade April 10, 2018
Arthur Henry

Tech Trade Alert - (CRM) April 10, 2018 BUY

Tech Alert

When John identifies a strategic exit point, he will send you an alert with specific trade information as to what security to sell, when to sell it, and at what price. Most often, it will be to TAKE PROFITS, but, on rare occasions, it will be to exercise a STOP LOSS at a predetermined price to adhere to strict risk management discipline. Read more

https://madhedgefundtrader.com/wp-content/uploads/2019/05/cropped-mad-hedge-logo-transparent-192x192_f9578834168ba24df3eb53916a12c882.png 0 0 Arthur Henry https://madhedgefundtrader.com/wp-content/uploads/2019/05/cropped-mad-hedge-logo-transparent-192x192_f9578834168ba24df3eb53916a12c882.png Arthur Henry2018-04-10 13:56:292018-04-10 13:56:29Tech Trade Alert - (CRM) April 10, 2018 BUY
Arthur Henry

Trade Alert - (C) April 10, 2018 BUY

Trade Alert

When John identifies a strategic exit point, he will send you an alert with specific trade information as to what security to sell, when to sell it, and at what price. Most often, it will be to TAKE PROFITS, but, on rare occasions, it will be to exercise a STOP LOSS at a predetermined price to adhere to strict risk management discipline. Read more

https://madhedgefundtrader.com/wp-content/uploads/2019/05/cropped-mad-hedge-logo-transparent-192x192_f9578834168ba24df3eb53916a12c882.png 0 0 Arthur Henry https://madhedgefundtrader.com/wp-content/uploads/2019/05/cropped-mad-hedge-logo-transparent-192x192_f9578834168ba24df3eb53916a12c882.png Arthur Henry2018-04-10 12:46:202018-04-10 12:46:20Trade Alert - (C) April 10, 2018 BUY
Douglas Davenport

April 10, 2018 - MDT Alert (AMC)

MDT Alert

While the Diary of a Mad Hedge Fund Trader focuses on investment over a one week to six-month time frame, Mad Day Trader, provided by Bill Davis, will exploit money-making opportunities over a brief ten minute to three day window. It is ideally suited for day traders, but can also be used by long-term investors to improve market timing for entry and exit points. Read more

https://madhedgefundtrader.com/wp-content/uploads/2019/05/cropped-mad-hedge-logo-transparent-192x192_f9578834168ba24df3eb53916a12c882.png 0 0 Douglas Davenport https://madhedgefundtrader.com/wp-content/uploads/2019/05/cropped-mad-hedge-logo-transparent-192x192_f9578834168ba24df3eb53916a12c882.png Douglas Davenport2018-04-10 12:40:022018-04-10 12:40:02April 10, 2018 - MDT Alert (AMC)
Douglas Davenport

April 10, 2018 - MDT Alert (VRX)

MDT Alert

While the Diary of a Mad Hedge Fund Trader focuses on investment over a one week to six-month time frame, Mad Day Trader, provided by Bill Davis, will exploit money-making opportunities over a brief ten minute to three day window. It is ideally suited for day traders, but can also be used by long-term investors to improve market timing for entry and exit points. Read more

https://madhedgefundtrader.com/wp-content/uploads/2019/05/cropped-mad-hedge-logo-transparent-192x192_f9578834168ba24df3eb53916a12c882.png 0 0 Douglas Davenport https://madhedgefundtrader.com/wp-content/uploads/2019/05/cropped-mad-hedge-logo-transparent-192x192_f9578834168ba24df3eb53916a12c882.png Douglas Davenport2018-04-10 12:39:572018-04-10 12:39:57April 10, 2018 - MDT Alert (VRX)
Douglas Davenport

April 10, 2018 - MDT Pro Tips A.M.

MDT Alert

While the Diary of a Mad Hedge Fund Trader focuses on investment over a one week to six-month time frame, Mad Day Trader, provided by Bill Davis, will exploit money-making opportunities over a brief ten minute to three day window. It is ideally suited for day traders, but can also be used by long-term investors to improve market timing for entry and exit points. Read more

https://madhedgefundtrader.com/wp-content/uploads/2019/05/cropped-mad-hedge-logo-transparent-192x192_f9578834168ba24df3eb53916a12c882.png 0 0 Douglas Davenport https://madhedgefundtrader.com/wp-content/uploads/2019/05/cropped-mad-hedge-logo-transparent-192x192_f9578834168ba24df3eb53916a12c882.png Douglas Davenport2018-04-10 08:55:412018-04-10 08:55:41April 10, 2018 - MDT Pro Tips A.M.
MHFTR

April 10, 2018

Diary, Newsletter

Global Market Comments
April 10, 2018
Fiat Lux

Featured Trade:
(DON'T MISS THE APRIL 11 GLOBAL STRATEGY WEBINAR),
(IT'S ALL ABOUT WHAT HAPPENS NEXT),
($INDU), (GOOGL),
(HOW AMERICA'S PLUNGING EDUCATION SURPLUS WILL DAMAGE YOUR PORTFOLIO), (UUP)

https://madhedgefundtrader.com/wp-content/uploads/2019/05/cropped-mad-hedge-logo-transparent-192x192_f9578834168ba24df3eb53916a12c882.png 0 0 MHFTR https://madhedgefundtrader.com/wp-content/uploads/2019/05/cropped-mad-hedge-logo-transparent-192x192_f9578834168ba24df3eb53916a12c882.png MHFTR2018-04-10 01:09:212018-04-10 01:09:21April 10, 2018
Page 130 of 175«‹128129130131132›»

tastytrade, Inc. (“tastytrade”) has entered into a Marketing Agreement with Mad Hedge Fund Trader (“Marketing Agent”) whereby tastytrade pays compensation to Marketing Agent to recommend tastytrade’s brokerage services. The existence of this Marketing Agreement should not be deemed as an endorsement or recommendation of Marketing Agent by tastytrade and/or any of its affiliated companies. Neither tastytrade nor any of its affiliated companies is responsible for the privacy practices of Marketing Agent or this website. tastytrade does not warrant the accuracy or content of the products or services offered by Marketing Agent or this website. Marketing Agent is independent and is not an affiliate of tastytrade. 

Legal Disclaimer

There is a very high degree of risk involved in trading. Past results are not indicative of future returns. MadHedgeFundTrader.com and all individuals affiliated with this site assume no responsibilities for your trading and investment results. The indicators, strategies, columns, articles and all other features are for educational purposes only and should not be construed as investment advice. Information for futures trading observations are obtained from sources believed to be reliable, but we do not warrant its completeness or accuracy, or warrant any results from the use of the information. Your use of the trading observations is entirely at your own risk and it is your sole responsibility to evaluate the accuracy, completeness and usefulness of the information. You must assess the risk of any trade with your broker and make your own independent decisions regarding any securities mentioned herein. Affiliates of MadHedgeFundTrader.com may have a position or effect transactions in the securities described herein (or options thereon) and/or otherwise employ trading strategies that may be consistent or inconsistent with the provided strategies.

Copyright © 2025. Mad Hedge Fund Trader. All Rights Reserved. support@madhedgefundtrader.com
Scroll to top