Global Market Comments
September 3, 2020
Fiat Lux
Featured Trade:
(A HIGH-YIELD PLAY IN A LOW-YIELD WORLD),
(JMBS), (SGVAX)
(JMBS), (SGVAX)

Global Market Comments
September 3, 2020
Fiat Lux
Featured Trade:

I already know what you’re thinking about.
Energy Master Limited Partnerships (MLPs), junk bonds, airlines on the verge of bankruptcy?
Nope.
There are in fact tremendous opportunities in mortgage-backed securities.
Mortgage-backed what, you may ask?
A Mortgage-Backed Security (MBS) is a type of instrument which is secured by a basket of mortgages. These mortgages are aggregated and sold to banks which then securitize, or package, them together into single securities that investors can buy.
MBSs in effect turn banks into middlemen between the individual homeowner and a fixed income end investor. The housing market can’t work without it. The majority of home mortgages in the United States end up in MBS’s one way or the other.
MBS’s are further subdivided into residential or commercial ones, depending on whether the underlying assets are home mortgages taken out by borrowers or assets for commercial purposes ranging from office space to multi-dwelling buildings.
And here’s the part you want to hear. Some MBSs yield as much as 11%, and high single digits are common.
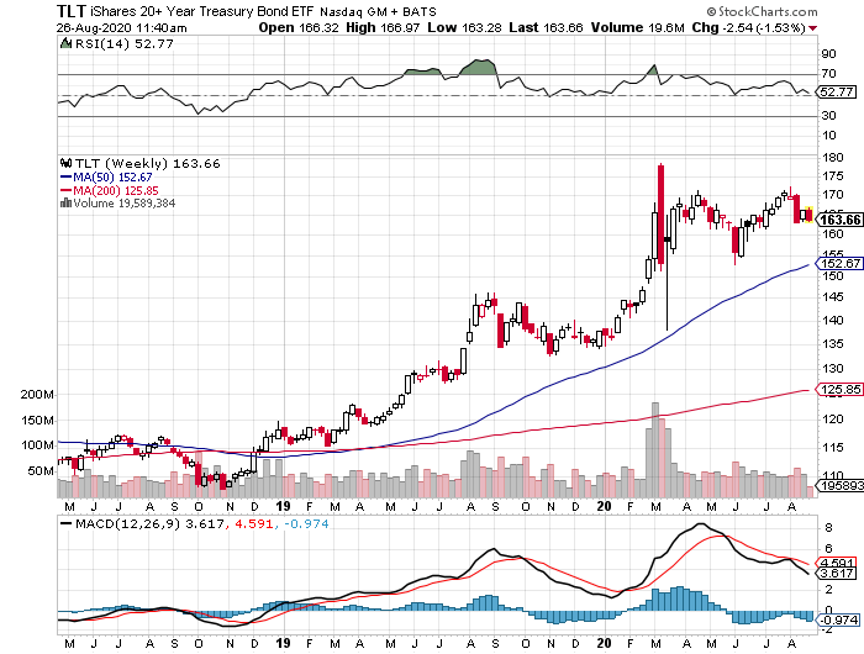
MBSs basically are bonds with a few bells and whistles. They are supposed to trade in line with ten-year US Treasury bonds (TLT). The problem now is that right now they are not. In fact, MBSs are currently trading at the great spread over Treasuries since the 2008-2009 Great Recession.
Part of the problem is that MBSs have a terrible history, leading the charge to the downside when the housing market collapsed, some collateral properties dropping as much as 80%. That took the value of most leveraged MBSs to zero.
Trillions of dollars were lost. Indeed, vast fortunes were made by hedge funds selling short these securities.
Today, these are not your father’s MBSs. In the wake of the 2008-2009 crash, the heavy hand of regulation came down hard.
Today, an MBS must be issued by a government-sponsored enterprise (GSE) or a heavily capitalized private financial company. The mortgages must have originated from a regulated and authorized financial institution. And the MBS must have received one of the top two ratings issued by an accredited credit rating agency.
As a result, much of the risk has been taken out of these securities.
So if these things are so safe now, why are they presenting such astronomical returns? A lot depends on your long term view of these US housing market.
There are currently 4 million homes in mortgage “forbearance” meaning that they have a temporary holiday on making their monthly mortgage payments. This government program runs out at the end of 2020. This has crushed the MBS market.
If you believe that the majority of these homes are going the default on their loans, you probably should steer clear of MBSs as the market has it right.
However, if you think that the majority of these bowers obtained forbearances without actually needing them and will return to regular timely payment once the program ends, plus back payments, then MBSs now offer incredible value and you want to be loading the boat with them.
I believe in the latter.
There happen to be dozens of publicly listed MBSs which you can buy. I focus on a couple of the highest quality ones.
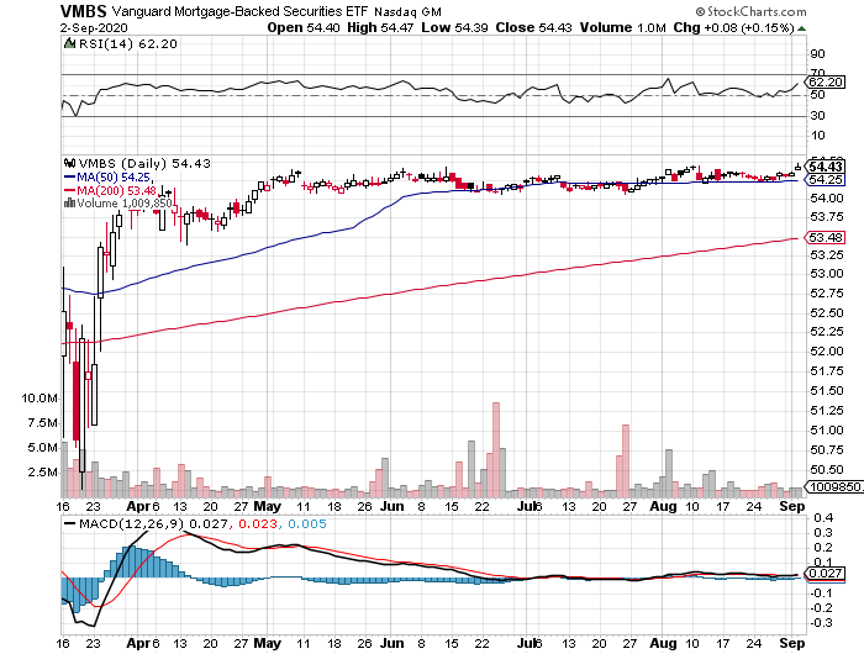
The Janus Henderson Mortgage-Backed Securities ETF (JMBS) is offering a 4.34% yield invests primarily in ten and 30 conventional home mortgages. Click here for more details.
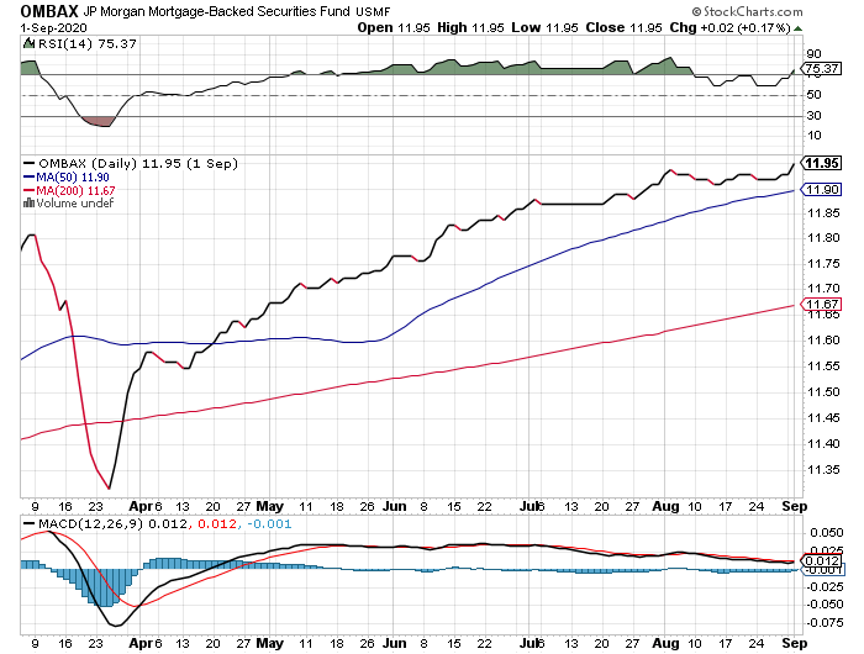
The Franklin Templeton Western Asset Mortgage Back Securities Fund (SGVAX) pays a 3.75% yield and invests in a broader range of asset-backed securities. For more details on this fund please click here.
While these yields are attractive, you really need institutional access to get the Holy Grail, the true double-digit return. That will let you soak up the mortgages directly, as hedge funds do. That will let you bypass the hefty management fees and expenses charged by the exchange-traded funds and other middlemen.
You may also have to go out on the risk spectrum to get the big numbers, which means investing in more commercial backed securities. It’s no great revelation that people will default on their office or their small business before they do so on the residence.

Global Market Comments
September 2, 2020
Fiat Lux
Featured Trade:
Global Market Comments
September 1, 2020
Fiat Lux
Featured Trade:
Global Market Comments
August 31, 2020
Fiat Lux
Featured Trade:
Listening to 27 presentations during the Mad Hedge Traders & Investors Summit last week (click here for the replays), I couldn’t help but notice something very interesting, if not alarming.
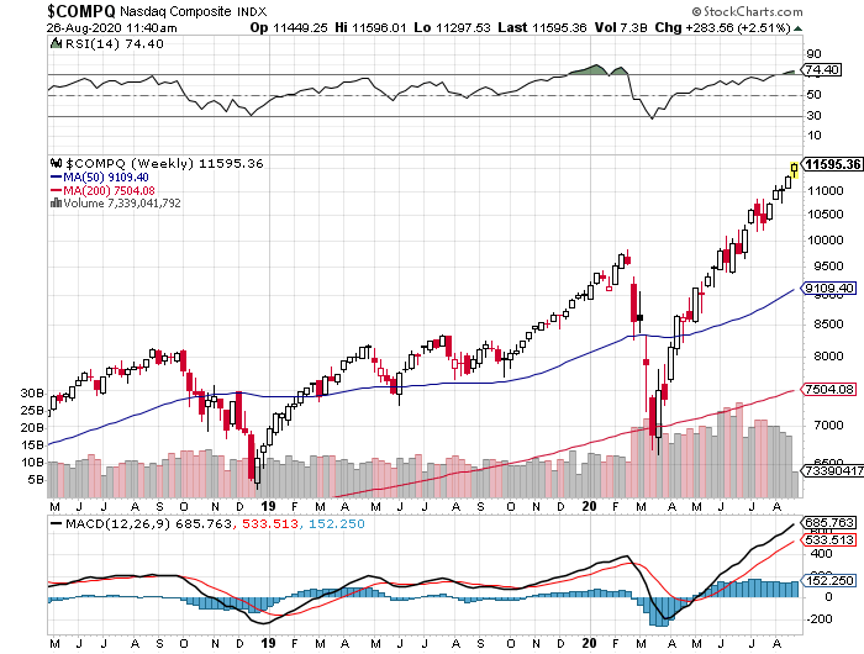
All the charts are starting to look the same.
You would expect all the technology charts to be similar on top of the historic run we have seen since the March 23 bottom.
But I wasn’t only looking at technology stocks.
Analyzing the long-term charts for stock indexes, bonds, real estate, and gold, it is clear that they ALL entered identical parabolic moves that began during the notorious Christmas bottom in December 2018.
With the exception of the pandemic induced February-March hiccup this year, it has been straight up ever since.
The best strategy of all for the past three years has been to simply close your eyes and buy EVERYTHING and then forget about it. It really has been the perfect idiot’s market.
This isn’t supposed to happen.
Stocks, bonds, real estate, and gold are NEVER supposed to be going all in the same direction at the same time. The only time you see this is when the government is flooding the financial system with liquidity to artificially boost asset prices.
This latest liquidity wave started when the 2017 Trump tax bill initiated enormous government budget deficits from the get-go. It accelerated when the Federal Reserve backed off of quantitative tightening in mid-2019.
Then it really blew up to tidal wave proportions with the Fed liquidity explosion simultaneously on all fronts with the onset of the US Corona epidemic.
Asset classes have been going ballistic ever since.
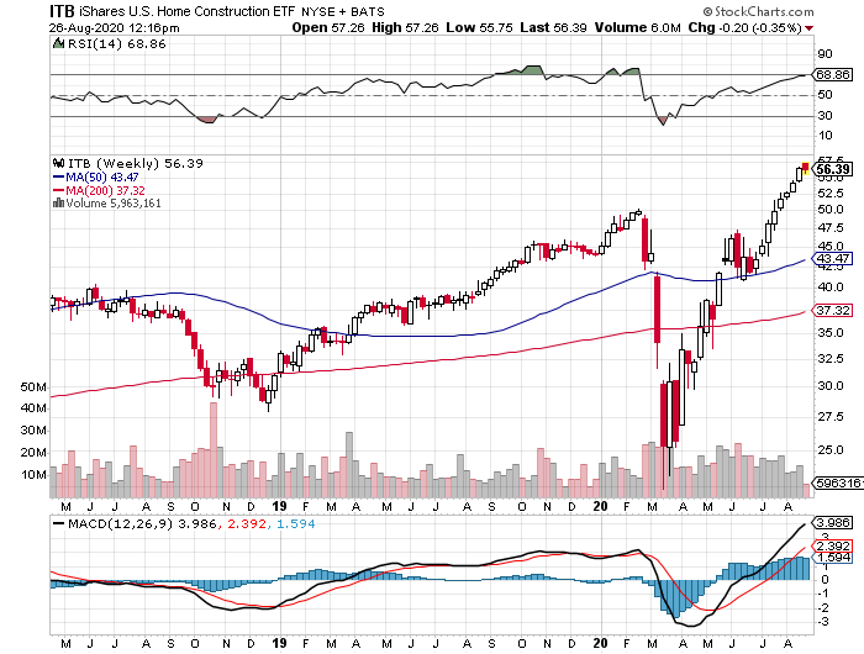
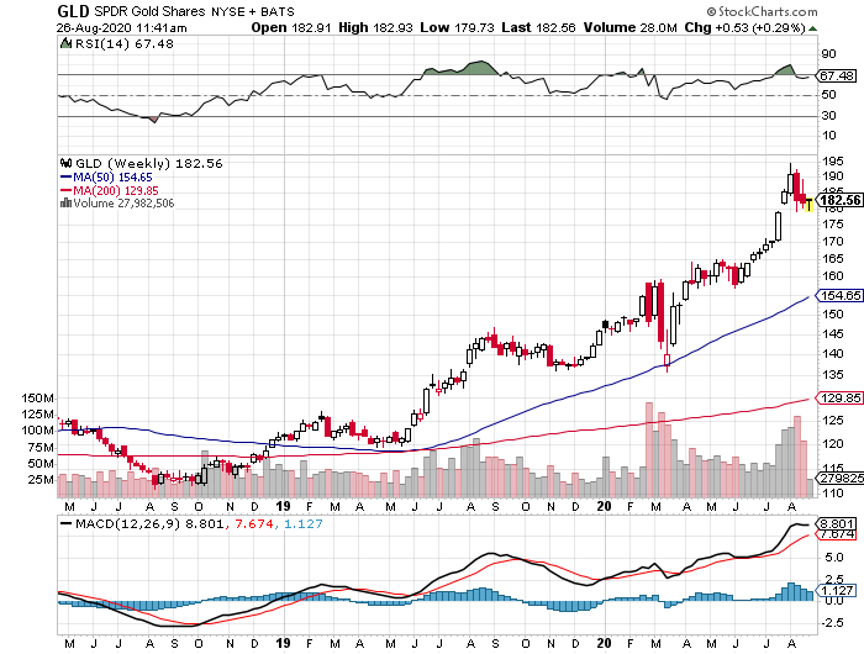
From the March 23 bottom, NASDAQ is up an astounding 78%, bonds have gained an unprecedented 30%, the US Homebuilders ETF has rocketed a stagging 187%, and gold has picked up an eye-popping 26%.
That’s all well and good if you happen to be long these asset classes, as we have been advising clients for the past several months.
So, what happens next? After all, we are in the “What happens next?” business.
What if one of the charts starts to go the other way? Is gold a good hedge? Do bonds offer downside protection? Is there safety in home ownership?
Nope.
They all go down in unison, probably much faster than they went up. If fact, such a reversal may be only weeks or months away. If you live by the sword you die, by the sword.
Assets are now so dependent on excess liquidity that any threat to that liquidity could trigger a selloff of Biblical proportion, possibly worse than what we saw during February-March this year.
And you wouldn’t need simply a sudden tightening of liquidity to prompt such a debacle. A mere slowdown in the addition of new liquidity could bring Armageddon. The Fed in effect has turned all financial markets into a giant Ponzi scheme. The second they quit buying, they all crash.
The Fed and the US Treasury have already started executing this retreat surreptitiously through the back door. Some Treasury emergency loan programs were announced with a lot of fanfare but have yet to be drawn down in size because the standards are too tight.
The Fed has similarly shouted from the rooftops that they would be buying equity convertible bonds and ETFs but have yet to do so in any meaningful way.
If there is one saving grace for this bull market, it's that it may get a second lease on life with a new Biden administration. Now that the precedent for unlimited deficit spending has been set by Trump, it isn’t going to slow down anytime soon under the Democrats. It will simply get redirected.
One of the amazing things about the current administration is that they never launched a massive CCC type jobs program to employ millions in public works as Roosevelt did during the 1930s to end that Great Depression. Instead, they simply mailed out checks. Even my kids got checks, as they file their own tax returns to get a lower tax rate than mine.
I think you can count on Biden to move ahead with these kinds of bold, expansionist ideas to the benefit of the nation. We are still enjoying enormously the last round of such spending 85 years ago, the High Sierra trails I hiked weeks ago among them.
Stocks soared on plasma hopes. Trumps cited “political” reasons at the FDA for the extended delay. Scientists were holding back approval for fears plasma was either completely useless and would waste huge amounts of money or would kill off thousands of people. At best, plasma marginally reduces death rates for those already infected, but you’re that one it’s worth it. Anything that kills Covid-19 is great for stocks.
Existing Home Sales were up the most in history in July, gaining a staggering 24.7% to 5.86 million units. Bidding wars are rampant in the suburbs. Investors are back in too, accounting for 15% of sales. Inventories drop 21% to only 3.1 months. These are bubble type statistics. Can’t hold those Millennials back! This will be a lead sector in the market for the next decade. Buy homebuilders on dips.
Goldman said a quarter of job losses are permanent, as the economy is evolving so fast. Many of these jobs were on their way out before the pandemic. That could be good news for investors as those cost cuts are permanent, boosting profits. At least, that’s what stocks believe.
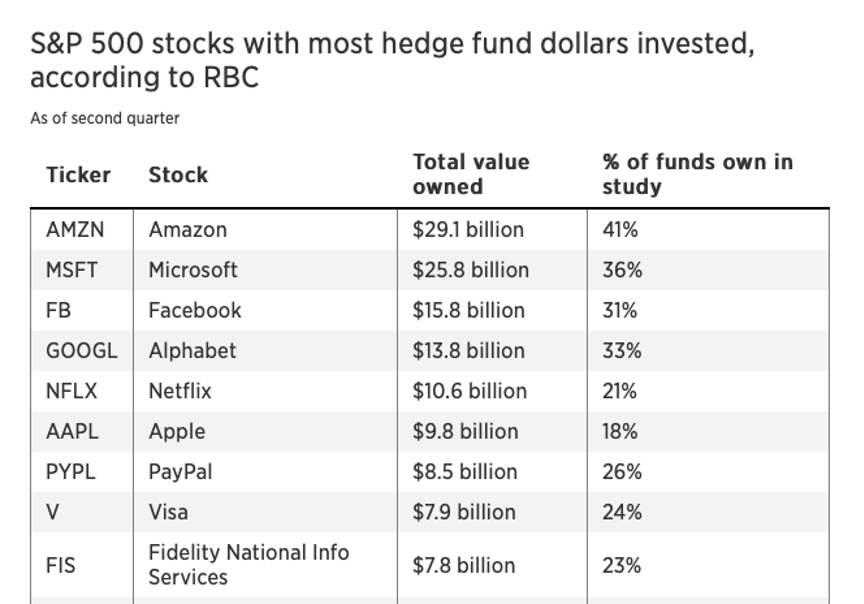
Hedge funds still love big tech, even though they are now at the 99th percentile of historic valuation ranges. Online financials, banks, and credit card processors also rank highly. Live by the sword, die by the sword.
Massive Zoom crash brought the world to a halt for two hours on Monday morning. It looked like a Chinese hack attack intended to delay online school opening of the new academic year. Unfortunately, it also delayed the start of the Mad Hedge Traders & Investors Summit.
The Dow Rebalancing is huge. Dow Jones rarely rejiggers the makeup of its famed but outdated index. But changing three names at once is unprecedented. One, Amgen (AMGN) I helped found, working on the team the discovered its original DNA sequencing. All of the founding investors departed yonks ago. The departure of Exxon (XOM) is a recognition that oil is a dying business and that the future is with Salesforce (CRM), whose management I know well. One big victim is Apple (AAPL) whose weighting in the index has shrunk.
The end of the airline industry has begun, with American (AAL) announcing 19,000 layoffs in October. That will bring to 40,000 job losses since the pandemic began. The industry will eventually shrink to a handful of government subsidized firms and some niche players. Avoid like a plat in a spiral dive.
30 million to be evicted in the coming months, as an additional stimulus bill stalls in Congress. It will no doubt be rolling evictions that stretch out over the next year. This will be the true cost of failing to deal with the virus.
When we come out the other side of this, we will be perfectly poised to launch into my new American Golden Age, or the next Roaring Twenties. With interest rates still at zero, oil cheap, there will be no reason not to. The Dow Average will rise by 400% or more in the coming decade. The American coming out the other side of the pandemic will be far more efficient and profitable than the old.
My Global Trading Dispatch suffered one of the worst weeks of the year, giving up most of its substantial August performance. If you trade for 50 years, occasionally you get a week like this. The good news is that it only takes us back to unchanged on the month.
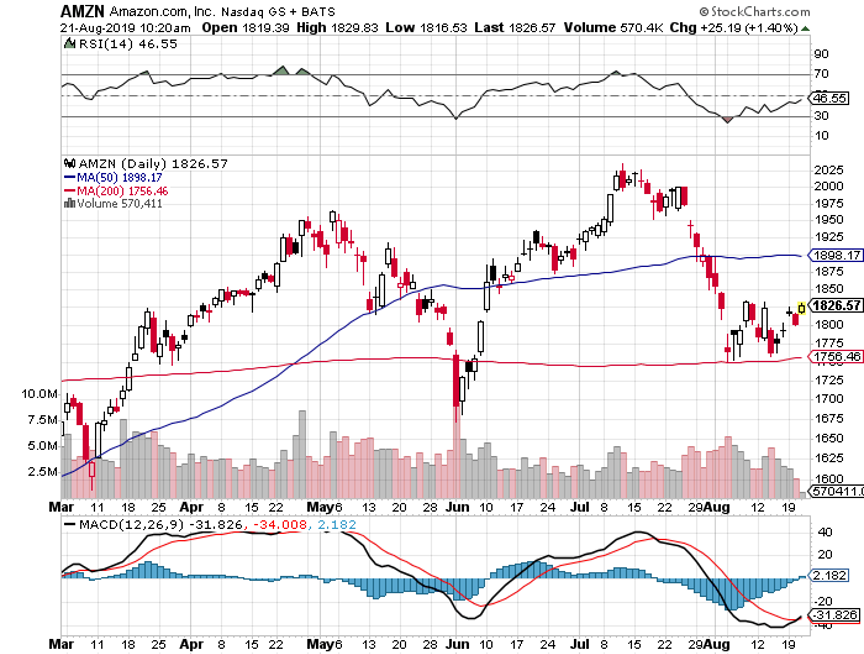
Longs in banks (JPM) and gold (GLD) and shorts in Facebook (FB) and bonds (TLT) held up fine, but we paid through the nose with shorts in Apple (AAPL), Amazon (AMZN), and Tesla (TSLA).
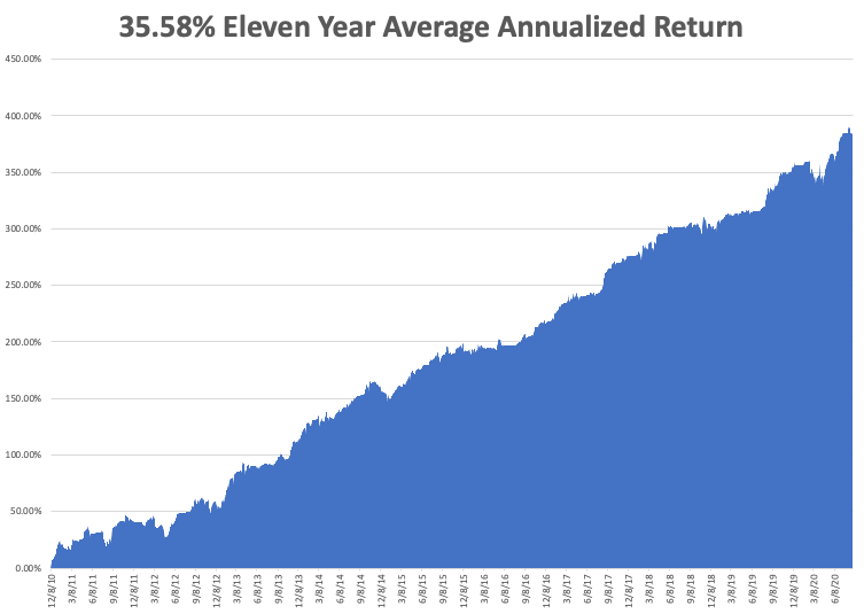
That takes our 2020 year to date down to 26.56%, versus +0.05% for the Dow Average. That takes my eleven-year average annualized performance back to 35.58%. My 11-year total return retreated to 382.47%.
It is jobs week so we can expect a lot of fireworks on the data front. The only numbers that really count for the market are the number of US Coronavirus cases and deaths, which you can find here.
On Monday, August 31 at 10:30 AM EST, the Dallas Fed Manufacturing Index for August is released.
On Tuesday, September 1 at 9:45 AM EST, the Markit Manufacturing Index for August is published.
On Wednesday, September 2, at 8:13 AM EST, the August ADP Employment Change Index for private-sector job is printed.
At 10:30 AM EST, the EIA Cushing Crude Oil Stocks are out.
On Thursday, September 3 at 8:30 AM EST, the Weekly Jobless Claims are announced.
On Friday, September 4, at 8:30 AM EST, The August Nonfarm Payroll Report is released.
At 2:00 PM The Bakers Hughes Rig Count is released.
As for me, I’ll be catching up on my sleep after hosting 27 speakers from seven countries and entertaining a global audience of 10,000 from over 50 countries and all 50 US states. We managed to max out Zoom’s global conferencing software, and I am now one of their largest clients.
It was great catching up with old trading buddies from decades past to connect with the up-and-coming stars.
Questions were coming in hot and heavy from South Africa, Singapore, all five Australian states, the Persian Gulf States, Saudi Arabia, East Africa, and every corner of the United Kingdom. And I was handling it all from my simple $2,000 Apple laptop from nearby Silicon Valley.
It is so amazing to have lived to see the future!
To selectively listen to videos of any of the many talented speakers, you can click here.
See you there.
John Thomas
CEO & Publisher
The Diary of a Mad Hedge Fund Trader

Global Market Comments
August 28, 2020
Fiat Lux
Featured Trade:
(BACK FROM MY 50-MILE HIKE)
Global Market Comments
August 27, 2020
Fiat Lux
Featured Trade:
(WHY YOU MISSED THE TECHNOLOGY BOOM AND WHAT TO DO ABOUT IT NOW),
(AAPL), (AMZN), (MSFT), (NVDA), (TSLA), (WFC), (FB)

I often review the portfolios of new subscribers looking for fundamental flaws in their investment approach and it is not unusual for me to find some real disasters.
The Armageddon scenario was quite popular a decade ago. You know, the philosophy that said that the Dow ($INDU) was plunging to 3,000, the US government would default on its debt (TLT), and gold (GLD) was rocketing to $50,000 an ounce?
Those who stuck with the deeply flawed analysis that justified those conclusions saw their retirement funds turn to ashes.
Traditional value investors also fell into a trap. By focusing only on stocks with bargain-basement earnings multiples, low price to book values, and high visible cash flows, they shut themselves out of technology stocks, far and away the fastest growing sector of the economy.
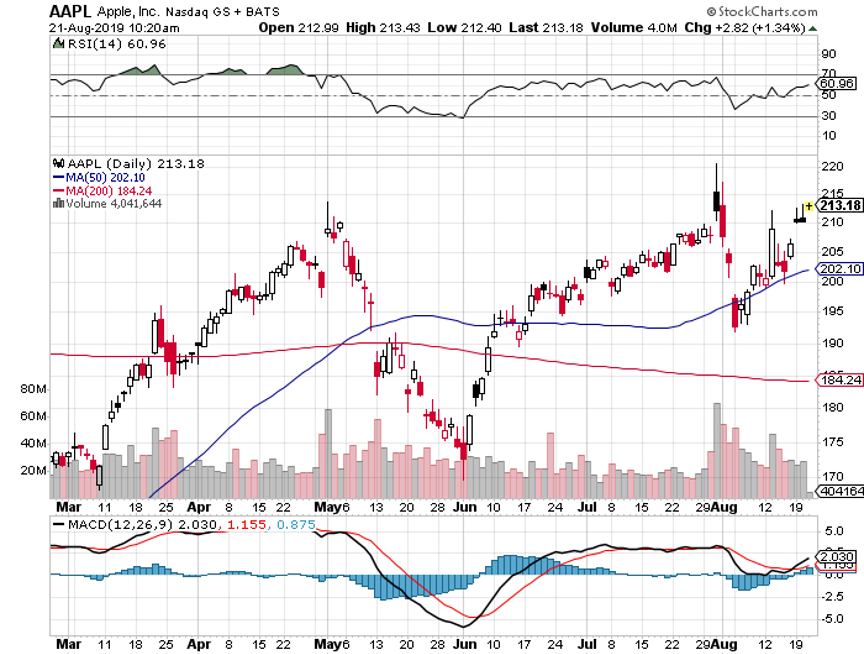
If they are lucky, they picked up shares in Apple a few years ago when the earnings multiple was still down at ten. But even the Giant of Cupertino hasn’t been that cheap for years.
And here is the problem. Tech stocks defy analysis because traditional valuation measures don’t apply to them.
Let’s start with the easiest metric of all, that of sales. How do you measure the value of sales when a company gives away most of its services for free?
Take Google (GOOG) for example. I bet you all use it. How many of you have actually paid money to Google to use their search function? I would venture none.
What would you pay Google for search if you had to? What is it worth to you to have an instant global search function? Probably at least $100 a year. With 70% of the global search market comprising 2 billion users that means $140 billion a year of potential Google revenues are invisible.
Yes, the company makes a chunk of this back by charging advertisers access to these search users, generating some $38.94 Billion in revenues and $9.95 billion in net income in the most recent quarter. It would have been an $8.2 billion profit without the outrageous $5 billion fine from the European Community.
But much of the increased value of this company is passed on to shareholders not through rising profits or dividend payments but through an ever-rising share price. If you’re looking for dividends, Google doesn’t exist. It is also very convenient that unrealized capital gains are tax-free until the shares are sold.
I’ll tell you another valuation measure that investors have completely missed, that of community. The most successful companies don’t have just customers who buy stuff, they have a community of members who actively participate in a common vision, which is then monetized. There are countless communities out there now making fortunes, you just have to know how to spot them.
Facebook (FB) has created the largest community of people who are willing to share personal information. This permits the creation of affinity groups centered around specific interests, from your local kids’ school activities to municipality emergency alerts, to your preferred political party.
This creates a gigantic network effect that increases the value of Facebook. Each person who joins (FB) makes it worth more, raising the value of the shares, even though they haven’t paid it a penny. Again, it’s advertisers who are footing your tab.
Tesla (TSLA) has 400,000 customers willing to lend it $400 billion for free in the form of deposits on future car purchases because they also share in the vision of a carbon-free economy. When you add together the costs of initial purchase, fuel, and maintenance savings, a new Tesla Model 3 is now cheaper than a conventional gasoline-powered car over its entire life.
REI, a privately held company, actively cultivates buyers of outdoor equipment, teaches them how to use it, then organizes trips. It will then pursue you to the ends of the earth with seasonal discount sales. Whole Foods (WFC), now owned by Amazon (AMZN), does the same in the healthy eating field.
If you spend a lot of your free time in these two stores, as I do, The United States is composed entirely of healthy, athletic, good looking, and long-lived people.
There is another company you know well that has grown mightily thanks to the community effect. That would be the Diary of a Mad Hedge Fund Trader, one of the fastest growing online financial services firms of the past decade.
We have succeeded not because we are good at selling newsletters, but because we have built a global community of like-minded investors with a common shared vision around the world, that of making money through astute trading and investment.
We produce daily research services covering global financial markets, like Global Trading Dispatch and the Mad Hedge Technology Letter. We teach you how to monetize this information with our books like Stocks to Buy for the Coming Roaring Twenties and the Mad Hedge Options Training Course.
We then urge you to action with our Trade Alerts. If you want more hands-on support, you can upgrade to the Concierge Service. You can also meet me in person to discuss your personal portfolios at my Global Strategy Luncheons.
The luncheons are great because long term Mad Hedge veterans trade notes on how best to use the service and inform me on where to make improvements. It’s a blast.
The letter is self-correcting. When we make a mistake, readers let us know in 60 seconds and we can shoot out a correction immediately. The services evolve on a daily basis.
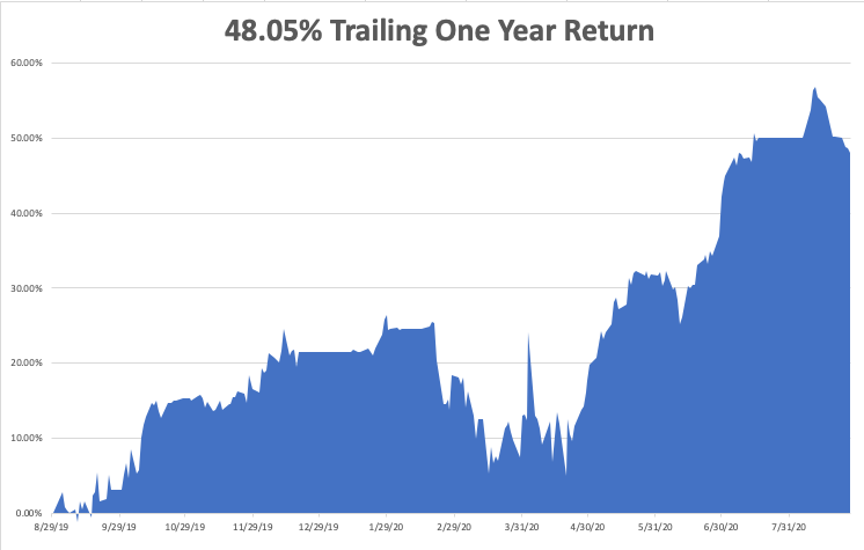
It all comes together to enable customers to make up to 50% to 60% a year on their retirement funds. And guess what? The more money they make, the more products and services they buy from me. This is why I have so many followers who have been with me for a decade or more. And some of my best ideas come from my own subscribers.
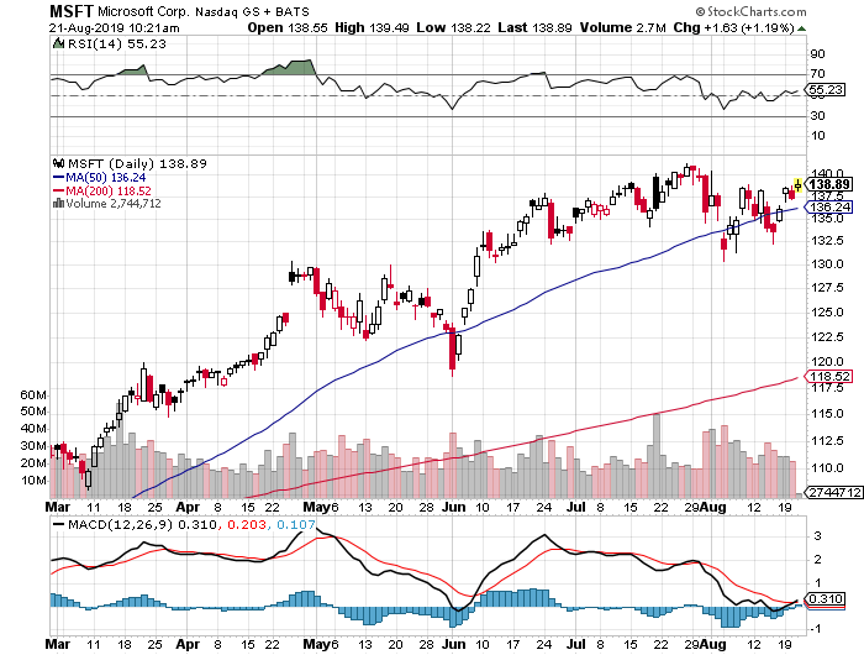
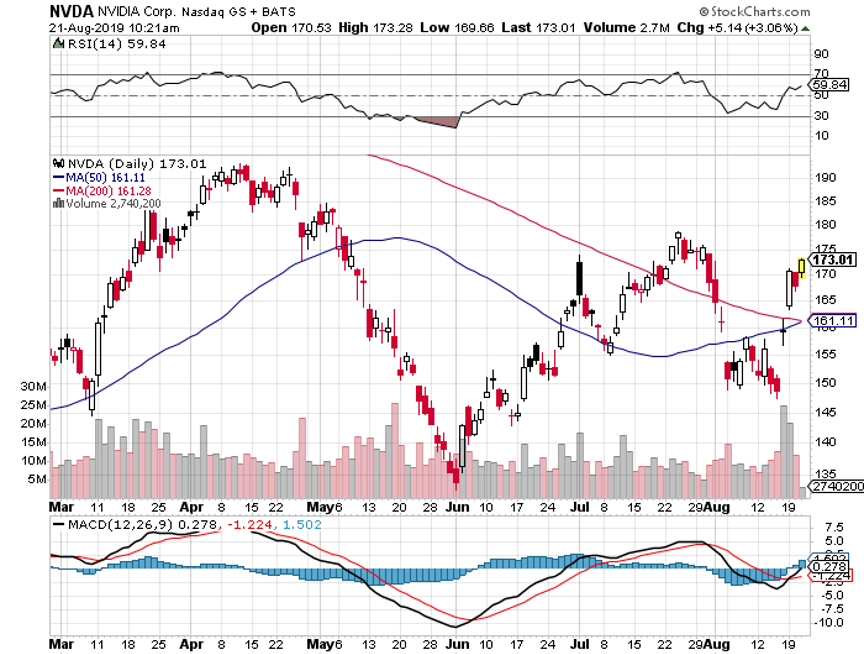
So, if you missed technology now, what should you do about it? Recognize what the new game is and get involved. Microsoft (MSFT) with the fastest-growing cloud business offers good value here. Amazon looks like it will eventually hit my $3,000 target. You want to be buying graphics card and AI company NVIDIA (NVDA) on every 10% dip.
You can buy the breakouts now to get involved, or patiently wait until the 10% selloff that usually follows blowout quarterly earnings.
My guess is that tech stocks still have to double in value before their market capitalization of 26% matches their 50% share of US profits. And the technologies are ever hyper-accelerating. That leaves a lot of upside even for the new entrants.

Global Market Comments
August 26, 2020
Fiat Lux
Featured Trade:
(THE TRADE OF THE CENTURY IS SETTING UP),
(TLT), (TBT), ($TNX)
(HOW TO BUY A SOLAR SYSTEM),
(SPWR), (TSLA)