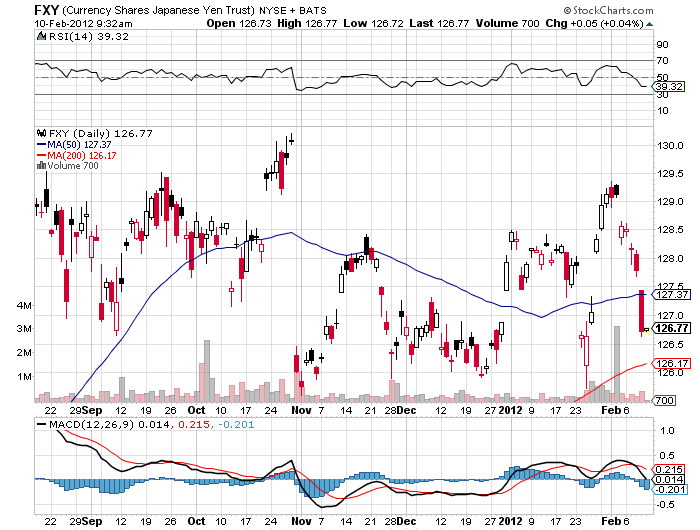
When I covered my short position on the Japanese yen on Friday, it was not because I suddenly fell in love with the Land of the Rising Sun, began each day with a Zen meditation, started eating sushi three times a day, or initiated writing this letter from a hot tub. It is because followers of my Trade Alert Service suddenly had an 11 day, 64% gain on their hands. We now live in a world where a bird in the hand is worth ten in the bush, so I took the money and ran.
There were a few other reasons for my lightning fast, cat like move. A sudden and unexpected extension of the global ?RISK ON? trade spilled into the foreign exchange markets, causing the Japanese currency to depreciate from ?76 to ?78.8. That took my March, 2012 puts from $1.65 to $3.00, before they settled at $2.70.
Taking profits before a three day weekend allowed me to duck the accelerated time decay in these short dated options. An instant return to the ?RISK OFF? trade, which was squarely placed on the table by the stock market?s gap down opening on Friday, could send the yen right back to poking at all-time highs. And while the recent move in the yen has been dramatic, all we have really done is move back to the bottom of a nine month trading range. And there is nothing like adding 3.18% to the value of your portfolio in a month that has otherwise been difficult for hedge funds.
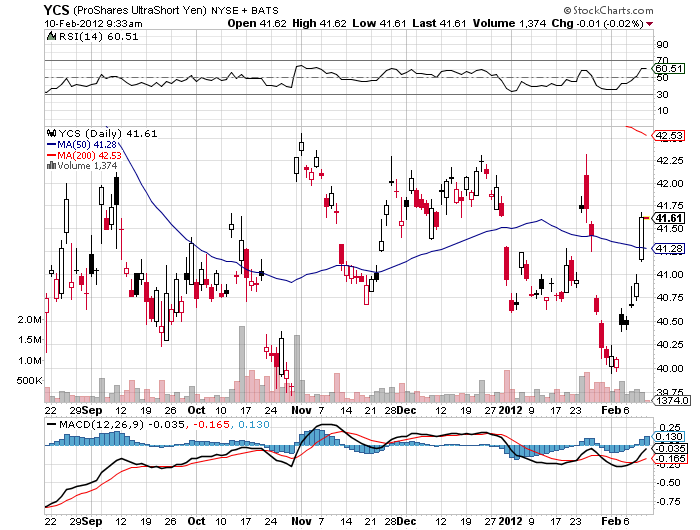
I think that we are getting close to the tipping point for the complete collapse of the Japanese economy. This will lead to eye popping declines in the value of the Japanese stock and bond markets and the yen. For US based investors, the easiest way to play this is with short positions in the ETF (FXY), and through the leveraged short yen ETF (YCS). So I will be revisiting this trade soon, and frequently, I hope.
Global Trading Dispatch, my highly innovative and successful trade mentoring program, earned a net return for readers of 40.17% in 2011. Those who wish to participate should email John Thomas directly at madhedgefundtrader@yahoo.com. Please put ?Global Trading Dispatch? in the subject line, as we are getting buried in emails.
To see the data, charts, and graphs that support this research piece, as well as more iconoclastic and out-of-consensus analysis, please visit me at www.madhedgefundtrader.com . There, you will find the conventional wisdom mercilessly flailed and tortured daily, and my last four years of research reports available for free. You might have a good laugh too.
https://madhedgefundtrader.com/wp-content/uploads/2019/05/cropped-mad-hedge-logo-transparent-192x192_f9578834168ba24df3eb53916a12c882.png00DougDhttps://madhedgefundtrader.com/wp-content/uploads/2019/05/cropped-mad-hedge-logo-transparent-192x192_f9578834168ba24df3eb53916a12c882.pngDougD2012-02-13 23:03:432012-02-13 23:03:43Global Trading Dispatch Hits 64%, 11 Day Home Run On Yen Short
When communications between intelligence agencies suddenly spike, as has recently been the case, I sit up and take note. Hey, do you think I talk to all of those generals because I like their snappy uniforms, do you?
The word is that the despotic, authoritarian regime in Syria is on the verge of collapse, and is unlikely to survive more than a few more months. The body count is mounting, and the only question now is whether Bashar al-Assad will flee to an undisclosed African country or get dragged out of a storm drain to take a bullet in his head. It couldn?t happen to a nicer guy.
The geopolitical implications for the US are enormous.? With Syria gone, Iran will be the last rogue state hostile to the US in the Middle East, and it is teetering. The next and final domino of the Arab spring falls squarely at the gates of Tehran.
Remember that the first real revolution in the region was the street uprising there in 2009. That revolt was successfully suppressed with an iron fist by fanatical and pitiless Revolutionary Guards. The true death toll will never be known, but is thought to be in the thousands. The antigovernment sentiments that provided the spark never went away and they continue to percolate just under the surface.
At the end of the day, the majority of the Persian population wants to join the tide of globalization. They want to buy IPods and blue jeans, communicate freely through their Facebook pages and Twitter accounts, and have the jobs to pay for it all. Since 1979, when the Shah was deposed, a succession of extremist, ultraconservative governments ruled by a religious minority, have failed to cater to these desires
When Syria collapses, the Iranian ?street? will figure out that if they spill enough of their own blood that? regime change is possible and the revolution there will reignite. The Obama administration is now pulling out all the stops to accelerate the process. Secretary of State Hillary Clinton has stiffened her rhetoric and worked tirelessly behind the scenes to bring about the collapse of the Iranian economy.
The oil embargo she organized is steadily tightening the noose, with heating oil and gasoline becoming hard to obtain. Yes, Russia and China are doing what they can to slow the process, but conducting international trade through the back door is expensive, and prices are rocketing. The unemployment rate is 25%.? Iranian banks are about to get kicked out of the SWIFT international settlements system, which would be a death blow to their trade.
Let?s see how docile these people remain when the air conditioning quits running this summer because of power shortages. Iran is a rotten piece of fruit ready to fall of its own accord and go splat. Hillary is doing everything she can to shake the tree. No military action of any kind is required on America?s part.
The geopolitical payoff of such an event for the US would be almost incalculable. A successful revolution will almost certainly produce a secular, pro-Western regime whose first priority will be to rejoin the international community and use its oil wealth to rebuild an economy now in tatters.
Oil will lose its risk premium, now believed by the oil industry to be $30 a barrel. A looming supply could cause prices to drop to as low as $30 a barrel. This would amount to a gigantic tax $1.66 trillion tax cut for not just the US, but the entire global economy as well (87 million barrels a day X 365 days a year X $100 dollars a barrel X 50%). Almost all funding of terrorist organizations will immediately dry up. I might point out here that this has always been the oil industry?s worst nightmare.
At that point, the US will be without enemies, save for North Korea, and even the Hermit Kingdom could change with a new leader in place. A long Pax Americana will settle over the planet.
The implications for the financial markets will be enormous. The US will reap a peace dividend as large or larger than the one we enjoyed after the fall of the Soviet Union in 1992. As you may recall, that black swan caused the Dow Average to soar from 2,000 to 10,000 in less than eight years, also partly fueled by the technology boom. A collapse in oil imports will cause the US dollar to rocket.? An immediate halving of our defense spending to $400 billion or less and burgeoning new tax revenues would cause the budget deficit to collapse. With the US government gone as a major new borrower, interest rates across the yield curve will fall further.
A peace dividend will also cause US GDP growth to reaccelerate from 2% to 4%. Risk assets of every description will soar to multiples of their current levels, including stocks, bonds, commodities, precious metals, and food. The Dow will soar to 20,000, the Euro collapses to parity, gold rockets to $2,300 and ounce, silver flies to $100 an ounce, copper leaps to $6 a pound, and corn recovers $8 a bushel. The 60 bull market in bonds ends.
Some 1.5 million of the armed forces will get dumped on the job market as our manpower requirements shrink to peacetime levels. But a strong economy should be able to soak these well trained and motivated people right up. We will enter a new Golden Age, not just at home, but for civilization as a whole.
Wait, you ask, what if Iran develops an atomic bomb and holds the US at bay? Don?t worry. There is no Iranian nuclear device. There is no Iranian nuclear program. The entire concept is an invention of American intelligence agencies as a means to put pressure on the regime. The head of the miniscule effort they have was assassinated by Israeli intelligence two weeks ago (a magnetic bomb, placed on a moving car, by a team on a motorcycle, nice!).
If Iran had anything substantial in the works, the Israeli planes would have taken off a long time ago. There is no plan to close the Straits of Hormuz, either. The training exercises we have seen are done for CNN?s benefit, and comprise no credible threat.
I am a firm believer in the wisdom of markets, and that the marketplace becomes aware of major history changing events well before we mere individual mortals do. The Dow began a 25 year bull market the day after American forces defeated the Japanese in the Battle of Midway in May of 1942, even though the true outcome of that confrontation was kept top secret for years.
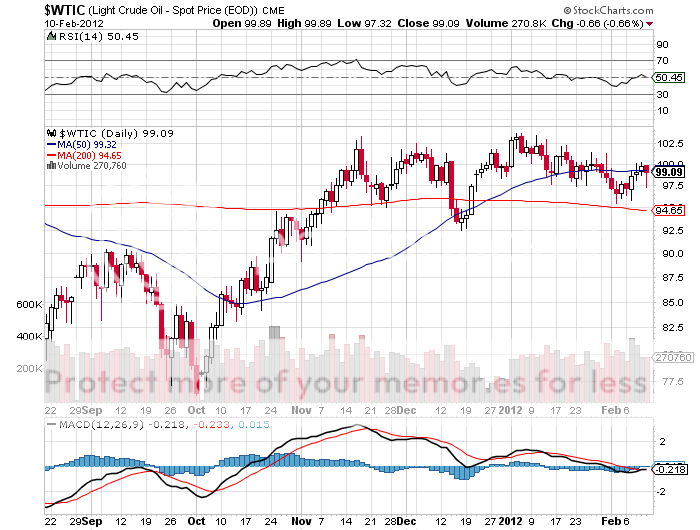
If the collapse of Iran was going to lead to a global multi decade economic boom and the end of history, how would the stock markets behave now? They would rise virtually every day, led by the technology sector and banks, offering no pullbacks for latecomers to get in. That is exactly what they have been doing since mid-December. If you think I?m ?Mad?, just check out Apple?s chart below, and the big relative underperformance of oil.
Here?s The Next Big Short
https://madhedgefundtrader.com/wp-content/uploads/2019/05/cropped-mad-hedge-logo-transparent-192x192_f9578834168ba24df3eb53916a12c882.png00DougDhttps://madhedgefundtrader.com/wp-content/uploads/2019/05/cropped-mad-hedge-logo-transparent-192x192_f9578834168ba24df3eb53916a12c882.pngDougD2012-02-13 23:02:362012-02-13 23:02:36Here Comes the Next Peace Dividend
A number of analysts, and even some of those in the real estate industry, are finally coming around to the depressing conclusion that there will never be a recovery in residential real estate. Long time readers of this letter know too well that I have been hugely negative on the sector since late 2005, when I unloaded all of my holdings. However, I believe that 'forever' may be on the extreme side. Personally, I believe there will be great opportunities in real estate starting in 2030.
Let's back up for a second and review where the great bull market of 1950-2007 came from. That's when a mere 50 million members of the 'greatest generation', those born from 1920 to 1945, were chased by 80 million baby boomers born from 1946-1962. There was a chronic shortage of housing, with the extra 30 million never hesitating to borrow more to pay higher prices. When my parents got married in 1949, they were only able to land a dingy apartment in a crummy Los Angeles neighborhood because he was an ex-Marine. This is where our suburbs came from.
Since 2005, the tables have turned. There are now 80 million baby boomers attempting to unload dwellings on 65 million generation Xer's who earn less than their parents, marking down prices as fast as they can. As a result, the Federal Reserve thinks that 35% of American homeowners either have negative equity, or less than 10% equity, which amounts to nearly zero after you take out sales commissions and closing costs. That comes to 42 million homes. Don't count on selling your house to your kids, especially if they are still living rent free in the basement.
The good news is that the next bull market in housing starts in 20 years. That's when 85 million Millennials, those born from 1988 to yesterday, start competing to buy homes from only 65 million gen Xer's. By then, house prices will be a lot cheaper than they are today in real terms. The next interest rate spike will probably knock another 25% off real estate prices. Think 1982 again.
Fannie Mae and Freddie Mac will be long gone, meaning that the 30 year conventional mortgage will cease to exist. All future home purchases will be financed with adjustable rate mortgages, forcing homebuyers to assume interest rate risk, as they already do in most of the developed world. With the US budget deficit problems persisting beyond the horizon, the home mortgage interest deduction is an endangered species, and its demise will chop another 10% off home values.
For you millennials just graduating from college now, this is a best case scenario. It gives you 15 years to save up the substantial down payment banks will require by then. You can then swoop in to cherry pick the best neighborhoods at the bottom of a 25 year bear market. People will no doubt tell you that you are crazy, that renting is the only safe thing to do, and that home ownership is for suckers. That's what people told me when I bought my first New York coop in 1982 at one tenth its current market price.
Just remember to sell by 2060, because that's when the next intergenerational residential real estate collapse is expected to ensue. That will leave the next, yet to be named generation, holding the bag, as your grandparents are now.
https://www.madhedgefundtrader.com/wp-content/uploads/2012/02/Vzc9AloruPmQjHRDTcUJS7oWP38FeZ5AVf1Y4xDHmKsVcbRyUqrjUGRVOdQ41adMq4sm6RMltBM3zTsB5J-qzflivEr5Qg2YecGRk9ftL_ykQ7ulna4.jpg282425DougDhttps://madhedgefundtrader.com/wp-content/uploads/2019/05/cropped-mad-hedge-logo-transparent-192x192_f9578834168ba24df3eb53916a12c882.pngDougD2012-02-12 20:04:562012-02-12 20:04:56The Real Estate Market in 2030
According to my old friend, Rick Sopher, chairman of LCH Investments in London, the top ten hedge funds have earned $153 billion for their investors since inception.
Rick, who runs his business from an elegant flat on posh Eaton Square, compiled the list after a comprehensive survey of the still operating 7,000 hedge funds worldwide. It is dominated by marquee names like Steve Cohen's SAC Capital, Bruce Kovner's Caxton, and Louise Bacon's Moore Capital. Of the 100 largest funds, 95% have returned much of their investors' original capital, and are using the remaining profits to trade on.
Of course, the numbers show a huge survivor bias. They don't include the hundreds of billions of dollars lost by now shuttered 'wanabee' managers during the financial crash, largely with highly leveraged fixed income, spread oriented, 'low risk' strategies. Many of these are still in liquidation, peddling illiquid assets for pennies on the dollar through online auctions and elsewhere.
The numbers highlight the increasing barbell nature of the hedge fund industry. The biggest funds continue to attract the big bucks, and a steady wave of defections from Wall Street, are funding hundreds of new startups. But many mid-tier firms are getting nothing and are struggling to stay in business.
I spent the evening speaking to Gao Jie, a Beijing civil judge who left the bench to join China's growing environmental movement when her kids came home from school one day coughing and wheezing. You only have to inhale in the capitol city these days to understand that they have a huge problem there.
One of the dirty little secrets of international trade for the last three decades has been the offshoring of high polluting industries from the US and Europe to China, which then vociferously complain about the emerging country's toxic environment. Much of the Middle Kingdom's record carbon emissions these days have been imported from the West. 'Cancer villages' are now proliferating throughout the landscape.
China gets 80% of its power from coal, compared to only 50% in the US. As a result, scientists figure that China became the world's largest emitter of CO2 in 2006. The central government is now asking the provinces to achieve both GDP and energy conservation goals at the same time, a difficult task at best. Government policy dictates that air conditioners only kick in at 79 degrees. If you think that went down well, try spending a summer in Beijing sometime.
It is also pushing headlong into alternative energy, is already the technological leader in key areas like wind, and has an eye to exporting low cost platforms to the US. It is no accident that two of the most competitive solar companies in the world, Suntech (STP) and Yingli Green Energy Holding (YGE), are Chinese. China is also having Phoenix based First Solar (FSLR) build the world's largest thin film solar power plant in Western China, which, it turns out, looks a lot like Arizona. The mammoth, 25 square mile facility will supply power to three million homes.
China's problems give one an inkling of how we might have ended up if we hadn't passed the Environmental Protection Act. I first visited China during the Cultural Revolution, when they doused piles of bodies of those who died in the famine with kerosene and burned them, and anyone educated had to endure being paraded down a street in a dunce cap. I had to pinch myself after seeing a sophisticated and well-educated woman like Gao Jie openly pursue her liberal goals, unfettered by a totalitarian regime.
https://www.madhedgefundtrader.com/wp-content/uploads/2012/02/TpwY3P-FM6lKHHMLqOqCNug3jp_t4NT5mtiKVZewDHIjrNWVj3Iqwf_ulL2sXqoonK0JlWdCYid_qblHBr04wgPMtjrJrCZn8wRAdxs1HUJ55yttuew.jpg180320DougDhttps://madhedgefundtrader.com/wp-content/uploads/2019/05/cropped-mad-hedge-logo-transparent-192x192_f9578834168ba24df3eb53916a12c882.pngDougD2012-02-12 20:02:562012-02-12 20:02:56China's Long and Winding Road
As a potentially profitable opportunity presents itself, John will send you an alert with specific trade information as to what should be bought, when to buy it, and at what price. Read more
00Mad Hedge Fund Traderhttps://madhedgefundtrader.com/wp-content/uploads/2019/05/cropped-mad-hedge-logo-transparent-192x192_f9578834168ba24df3eb53916a12c882.pngMad Hedge Fund Trader2012-02-10 10:40:362012-02-10 10:40:36Trade Alert - (SPY) February 10, 2012
As a potentially profitable opportunity presents itself, John will send you an alert with specific trade information as to what should be bought, when to buy it, and at what price. Read more
00Mad Hedge Fund Traderhttps://madhedgefundtrader.com/wp-content/uploads/2019/05/cropped-mad-hedge-logo-transparent-192x192_f9578834168ba24df3eb53916a12c882.pngMad Hedge Fund Trader2012-02-10 10:12:322012-02-10 10:12:32Trade Alert - (FXY) February 10, 2012
I just contracted to buy all the gasoline I want at 14 cents a gallon. No, I have not struck oil in my backyard, or come into an inheritance from a long lost Kuwaiti relative. That is the de facto price that PG&E is billing me for a full charge on my all-electric Nissan Leaf.
That works out to $1.20 to recharge a vehicle that will transport me 80 miles, at the price of five cents a kilowatt hour. This is a tiny fraction of? the 40 cents/hour I pay to run the rest of my appliances, and a pittance compared to the 50 cent/hour peak rate I pay to run the air conditioner in the summer.
PG&E has exactly one engineer to talk to its 10 million customers about this ground breaking new technology, and after much effort, I managed to get him on the phone. I asked who was paying the subsidy? Were those profligate spendthrifts in Washington involved? He answered that there was no subsidy, that power sold at night was cheap because there was no other market.
So I inquired as to who was paying for all of the equipment upgrades, like the new transformers and power lines that were needed? Do I sense the heavy hand of Sacramento? He replied that there was no capital cost because the same infrastructure that delivered power to me during the day would be used to power my car at night. Only a couple of bucks would be spent on the installation of a new 'time of use smart meter'.
The car cars with a $7,500 clean energy tax credit. I know we're supposed to be cutting the deficit by eliminating handouts like this. But you'll only take my subsidies away by prying my cold dead hands away off of them. Take someone else's subsidies, not mine! It is the American thing to do these days.
He did mention that one unanticipated problem had arisen. My ears perked up. Many wealthy Tesla Roadster owners in Los Altos Hills were impressing so many girlfriends with rides that they were requiring multiple daytime recharges, even though they promised to recharge only at night. Not only did this send their electricity bills through the roof, it was causing problems with the grid as well. I guess it?s all part of the teething process, a cost of making the great leap forward to the next generation. Who knew that Match.com would be involved?
I never thought I'd get something for nothing, but it looks like this time I will. That is, as long as the car works, and my kids don't run the battery down playing rap music all night.
https://www.madhedgefundtrader.com/wp-content/uploads/2012/02/i4AdfvY7S4_VTthaJW5mDxMvDKAINPU_K38Nj52w81uEXld3AQ1U8DyXPWHOZSwH1iVTPzz7TDs5RlD2vcsNqmpC5LQOTpI37XiHewohKXngAtXHDsM.jpg213320DougDhttps://madhedgefundtrader.com/wp-content/uploads/2019/05/cropped-mad-hedge-logo-transparent-192x192_f9578834168ba24df3eb53916a12c882.pngDougD2012-02-09 23:04:432012-02-09 23:04:43Getting Something for Nothing
I am in Orlando, Florida today to appear as the Keynote speaker at the 2012 Money Show. A search for a nearby bank took me to the surreal suburb of Celebration, a city developed by the Disney people during the mid-1990's. Created to evoke small town USA circa 1940, the berg tastefully replicates an America from the bucolic past, with wide parks, period street lights, white picket fences, fluttering American flags, and some of the strictest design review and zoning restrictions in the country.
Today, Celebration suffers from a foreclosure rate that is double that found in the rest of Florida. Disney was able to realize fantasy prices for its pixie dust sprinkled homes, about 30% more than equivalent property in the surrounding area. It wisely unloaded its ownership of the downtown commercial property to a California based investor group, which is no doubt regretting its move. The downward spiral began shortly after that. Prices are now thought to be 60% off their 2006 peak.
When the sheriff went to evict one unfortunate homeowner, they were held off at gunpoint for 14 hours before he took his own life. Another unfortunate resident was recently found bludgeoned to death. There is a sad irony that investors who drank the most Kool-Aid during the real estate bubble chose to live along the Southern edge of Disney World. Today, Mickey Mouse seems to be saying 'Rent, don't Buy.'
But That's Not What the Broker Told Me
https://www.madhedgefundtrader.com/wp-content/uploads/2012/02/Mt0bOowgMOkH_A930brwNZUER6DPtg3NMBbfieCrd08qDi9OpIU5HyEnczj-7_rZDd4GS6CgvP-5sNxByEk27tdHY8FoHPpH1fqvHWuk745xyvNCLXM.jpg255320DougDhttps://madhedgefundtrader.com/wp-content/uploads/2019/05/cropped-mad-hedge-logo-transparent-192x192_f9578834168ba24df3eb53916a12c882.pngDougD2012-02-09 23:03:502012-02-09 23:03:50They're Not Celebrating in Celebration
After my weekly dump on residential real estate, I feel obliged to reveal one corner of this beleaguered market that might actually make sense.
By 2050 the population of California will soar from 37 million to 50 million, and that of the US from 300 million to 400 million, according to data released by the US Census Bureau and the CIA fact Book (check out the population pyramid below).
That means enormous demand for the low end of the housing market, apartments in multi-family dwellings. Many of our new citizens will be cash short immigrants. They will be joined by generational demand for limited rental housing by 65 million Gen Xer's and 85 million Millennials enduring a lower standard of living than their parents and grandparents. These people aren't going to be living in cardboard boxes under freeway overpasses.
The trend towards apartments also fits neatly with the downsizing needs of 80 million retiring Baby Boomers. As they age, boomers are moving from an average home size of 2,500 sq. ft. down to 1,000 sq ft condos and eventually 100 sq. ft. rooms in assisted living facilities. The cumulative shrinkage in demand for housing amounts to about 4 billion sq. ft. a year, the equivalent of a city the size of San Francisco.
In the aftermath of the economic collapse, rents are now rising and vacancies rates are shrinking. Fannie Mae and Freddie Mac financing is still abundantly available at the lowest interest rates on record. Institutions combing the landscape for low volatility cash flows and limited risk are starting to pour money in.
https://www.madhedgefundtrader.com/wp-content/uploads/2012/02/pop.png188376DougDhttps://madhedgefundtrader.com/wp-content/uploads/2019/05/cropped-mad-hedge-logo-transparent-192x192_f9578834168ba24df3eb53916a12c882.pngDougD2012-02-07 23:05:042012-02-07 23:05:04The One Bright Spot in Real Estate
Legal Disclaimer
There is a very high degree of risk involved in trading. Past results are not indicative of future returns. MadHedgeFundTrader.com and all individuals affiliated with this site assume no responsibilities for your trading and investment results. The indicators, strategies, columns, articles and all other features are for educational purposes only and should not be construed as investment advice. Information for futures trading observations are obtained from sources believed to be reliable, but we do not warrant its completeness or accuracy, or warrant any results from the use of the information. Your use of the trading observations is entirely at your own risk and it is your sole responsibility to evaluate the accuracy, completeness and usefulness of the information. You must assess the risk of any trade with your broker and make your own independent decisions regarding any securities mentioned herein. Affiliates of MadHedgeFundTrader.com may have a position or effect transactions in the securities described herein (or options thereon) and/or otherwise employ trading strategies that may be consistent or inconsistent with the provided strategies.