• support@madhedgefundtrader.com
  • Biotech Model Portfolio
  • Daily Hot Tips
  • Hot Tips Archive
  • Member Login
  • Logout
Mad Hedge Fund Trader
  • Home
  • About
  • Store
  • Luncheons
  • Testimonials
  • My Account
    • Global Trading Dispatch
    • Mad Hedge Technology Letter
    • Biotech Newsletter
    • Newsletter
    • Mad Options Trader
    • Mad Hedge AI
    • Jacquie’s Post
    • Free Newsletter / Hot Tips
    • My Profile
      • Update Password
  • Contact Us
  • Click to open the search input field Click to open the search input field Search
  • Menu Menu
april@madhedgefundtrader.com

Learning the Art of Risk Control

Diary, Homepage Posts, Newsletter

Now that you know how to make money in the market, I’m going to teach you how to hang on to it. There is no point in booking winning trades only to lose the money by making careless mistakes. So today, I am going to talk about risk control.

The first goal of risk control is to conserve whatever capital you have. I tell people that I am too old to start over again as a junior trade if I lose all my money. So, I’m pretty careful when it comes to risk control.

The art of risk control is the make sure your portfolio is profitable, no matter what happens to the market. You want to be a winner, whether the market goes up, down, or sideways.

Remember, we are not trying to beat an index here. Our goal is to make actual dollars at all times, to keep the P&L chart always moving from the lower left to the upper right. You can’t eat relative performance, nor can you use it to pay your bills.

The second goal of a portfolio manager is to make your portfolio bomb proof. You never know when a flock of black swans is about to alight on the market, or a geopolitical shock comes out of the blue, causing markets to crash.

The biggest mistake I see beginning traders make is that they are in too much of a hurry to get rich. As a result, they make too much money too soon. I can’t tell you how many times I have heard of first-time traders losing all their money on their first trade, well before they got a handle on the basics.

I’m usually right 80% to 90% of the time. That means I’m wrong 10% to 20% of the time. If you bet the ranch on one of my losing trades, you’ll get taken to the cleaners. Never bet the ranch.

If you do, you are turning a calculated list into random risk. It is akin to buying a lottery ticket. I often tell clients they have gambling addictions. Make sure you’re not one of them. You can’t trade yourself back from zero with no money.

If you can master the skills that I am teaching you, you can make a living at this FOREVER! So, what’s the hurry? As my old trading mentor used to tell me, the Late Barton Biggs of Morgan Stanley, “invest in haste, repent in leisure,” a time-tested nostrum in this business.

I recommend that you use NO real money on your first few trades. Start with paper trading only. All of the online trading platforms offer wonderful tools that allow you to practice trading before you try the real thing. If you lose their “pretend money”, no harm, no foul. They don’t want you to go broke either. Broke customers don’t pay commissions.

The more time you spend learning trading, the more money you will get out of it. Remember, work in, money out. Spend at least an hour or two getting to know your own trading platform well.

Once you start trading with real money, it will become a totally different experience. Your heart rate steps up. Your hands get sweaty. You start checking your watch. It’s a lot like going into combat. In fact, combat veterans make great traders, which is why the military recruits so actively from the military. I think all these instincts trace back to our Neanderthal days, when our main concern was being chased by a saber-tooth tiger.

The time to learn a trading discipline is NOW. All of a sudden, your opinions, your ego, and your savings were on the line. It’s crucial for you to always start small when using real money.

That way, making a beginner’s mistake, like confusing “BUY” and “SELL” (I see it every day) will only cost you a cup of coffee at Starbucks, and bot your kid’s college education, your house, or your retirement. It won’t take long for you to grow from one contract to thousands, as I have done myself for many years.

It’s all about finding your comfort level and risk tolerance. You never want to have a position that is so large that you can’t sleep at night, or worse, call me in the middle of the night. My answer is always the same. Cut your position in half. If you still can’t sleep, cut it in half again.

I make a bold prediction here. The more experience you gain, the faster your risk tolerance goes up.

I’ll give you one more piece of advice. Take your broker’s technical support phone number and paste it at the top of your computer monitor. You don’t want to go look for it when you can’t figure out how to get out of a position, or your platform breaks. These are machines. It happens. As they teach in flight school, it’s not a matter of if, but when, a machine breaks.

There’s one more thing. When you’re ready to commit real money, don’t forget to take your account off of paper trading. The profits you make can’t be spent.

Risk management is an important part of the position sheet I will be sending you every day.

Take a look below at my recent position sheet I sent out during sharply rising markets, which I update every day.

Asset Class Breakdown

Risk Adjusted Basis

Current Capital at Risk


Risk On

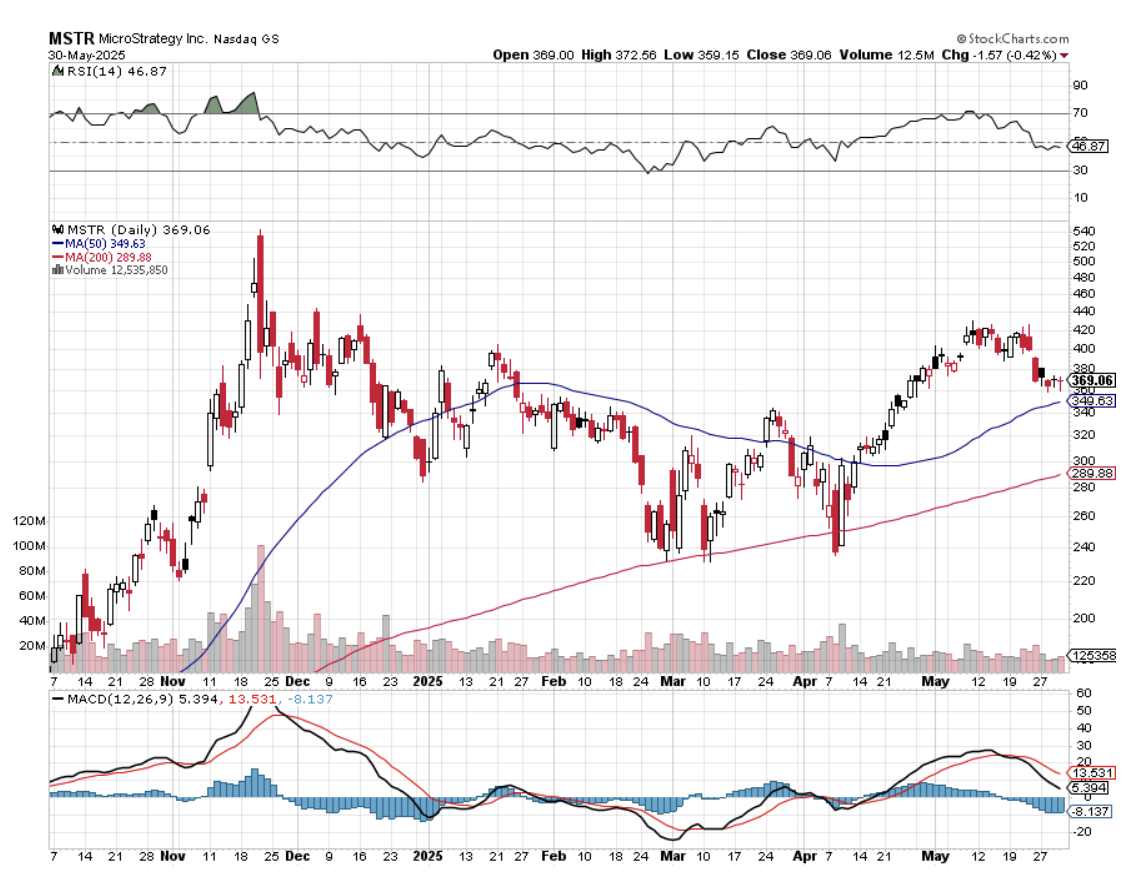
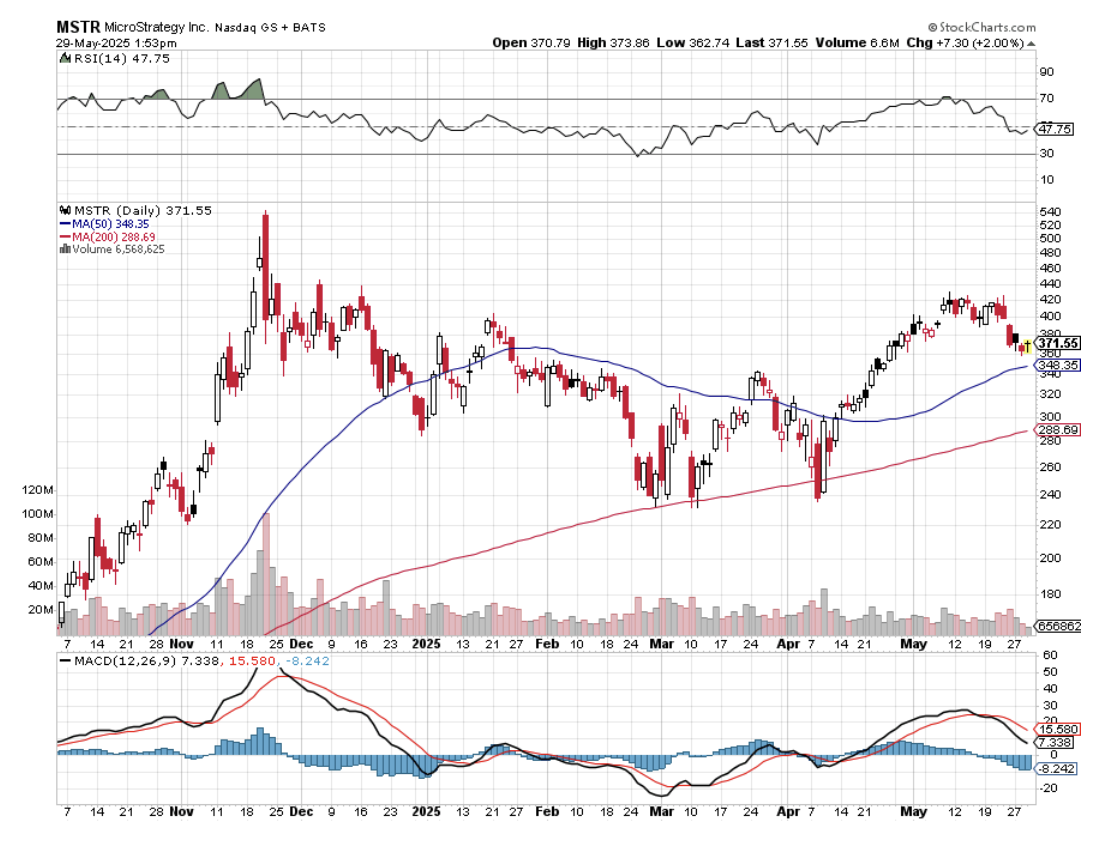
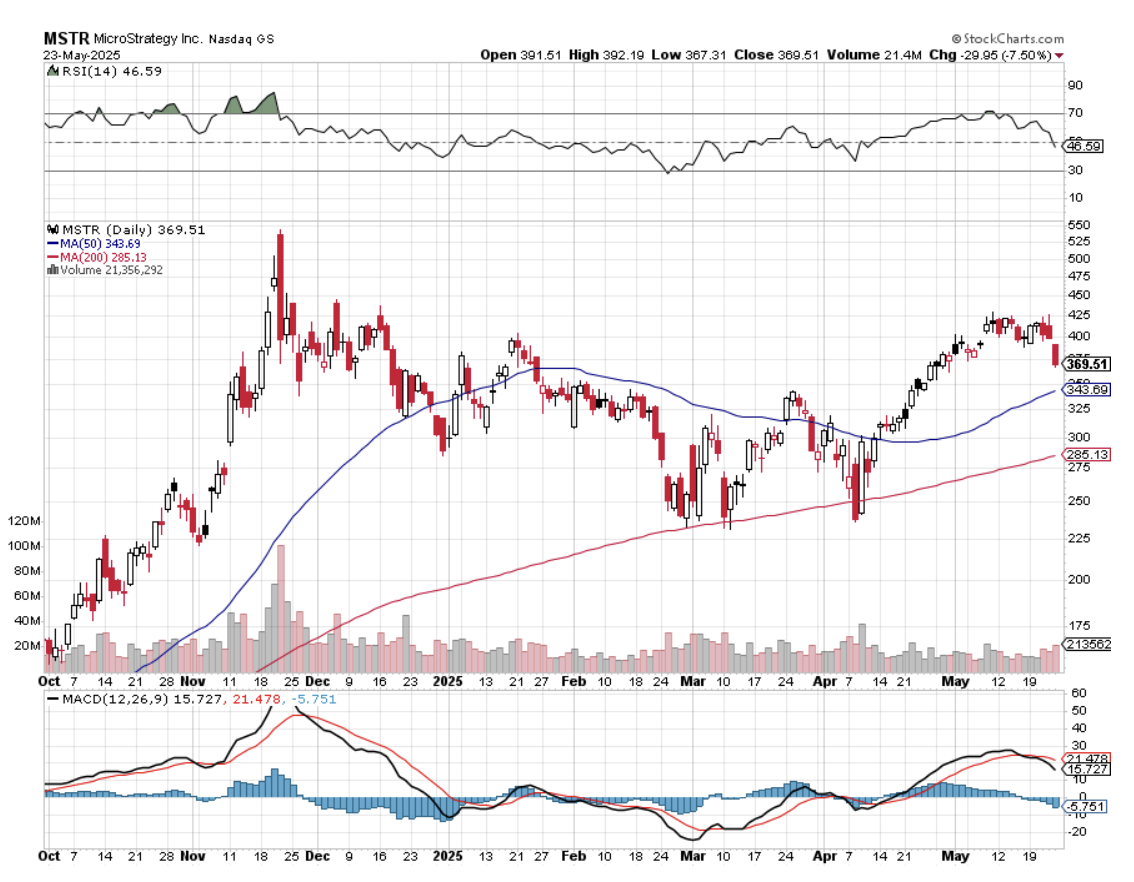
(MSTR) 6/$330-$340 call spread                         10.00%


Risk Off

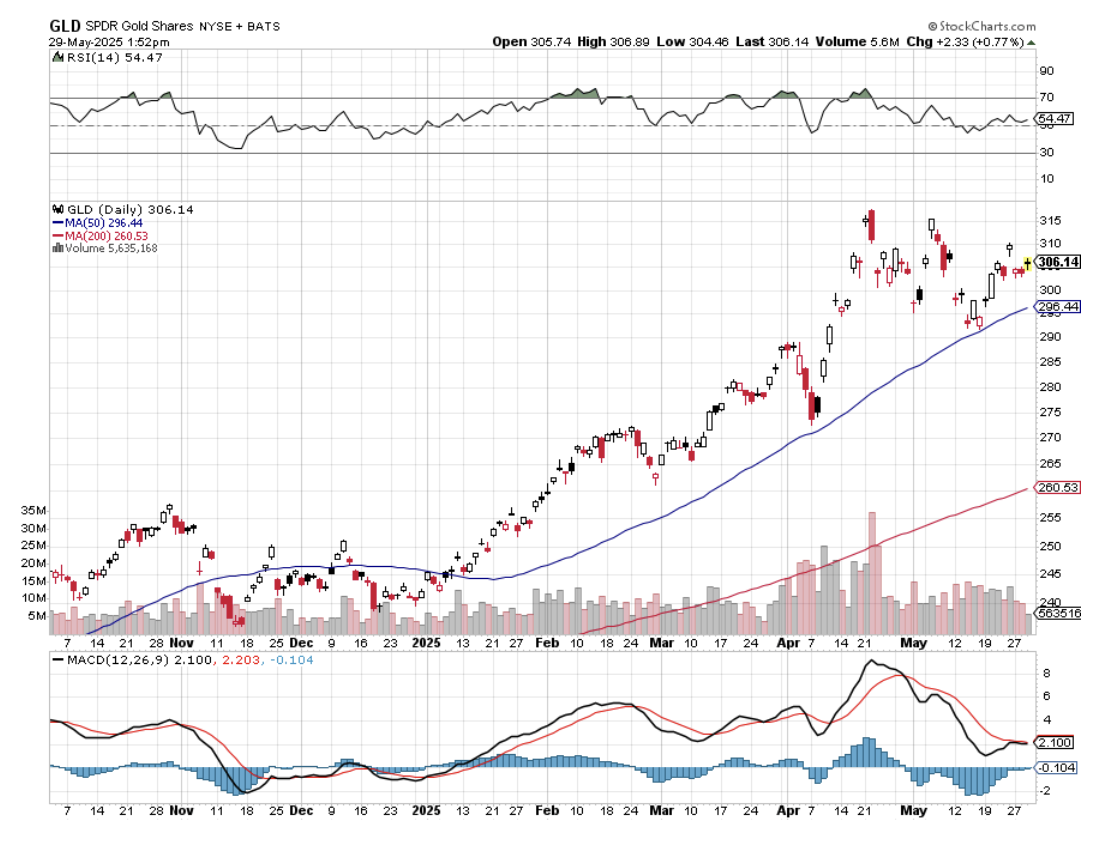
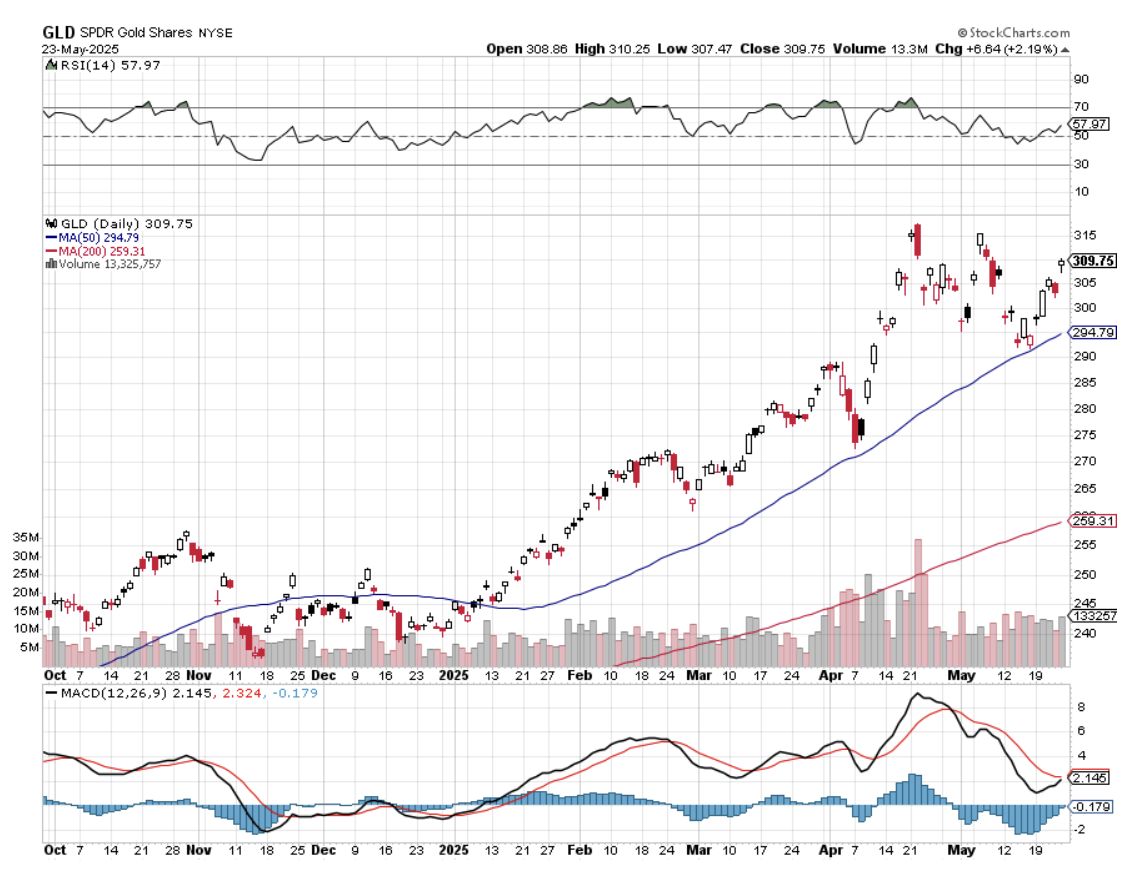
(GLD) 6/$275-$285 call spread                             -10.00%

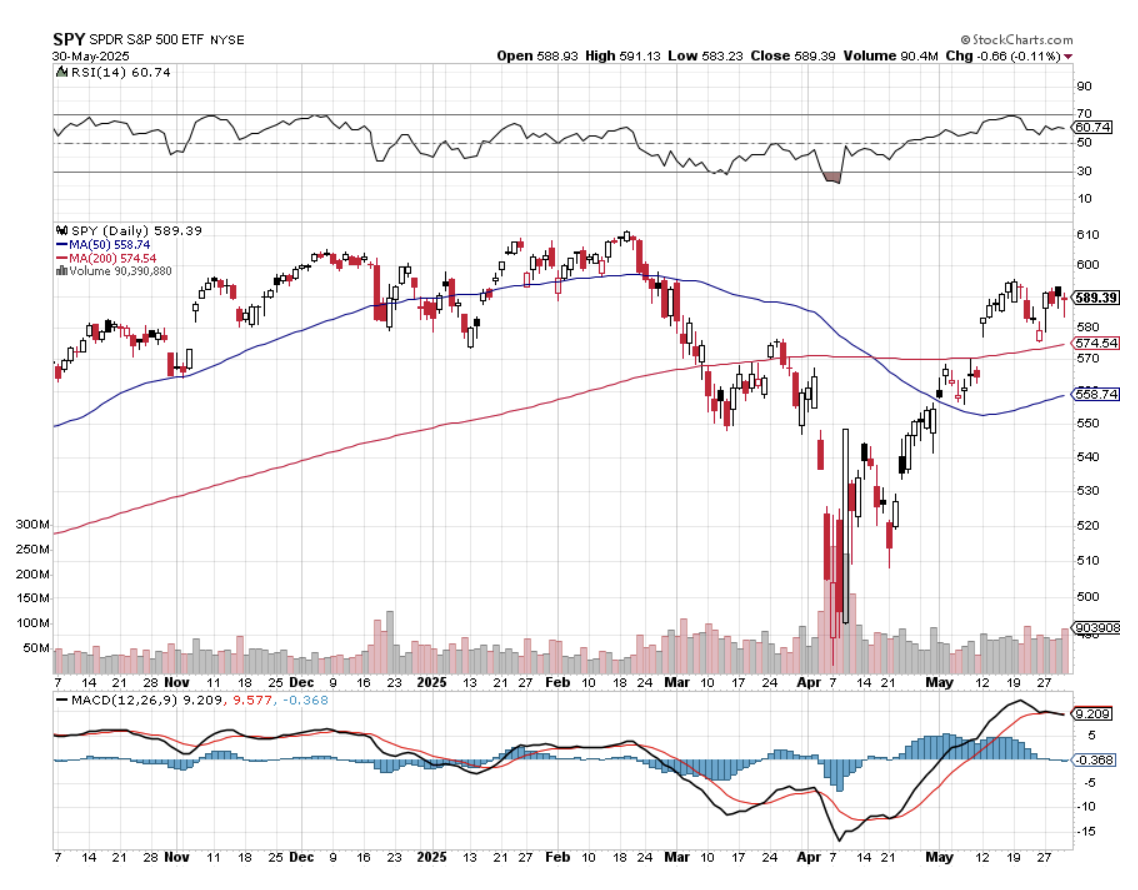
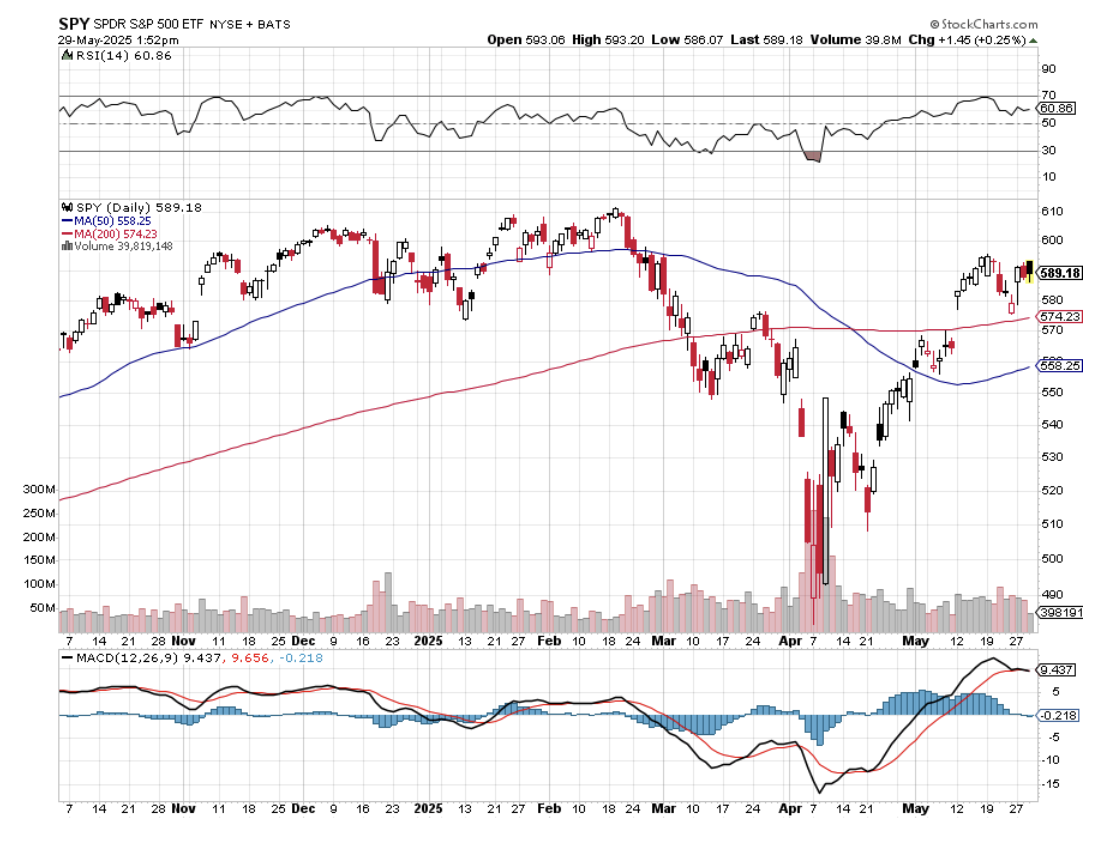
(SPY) 6/$650-$660 call spread                             -10.00%

(MSTR) 6/$470-$480 put spread                           -10.00%

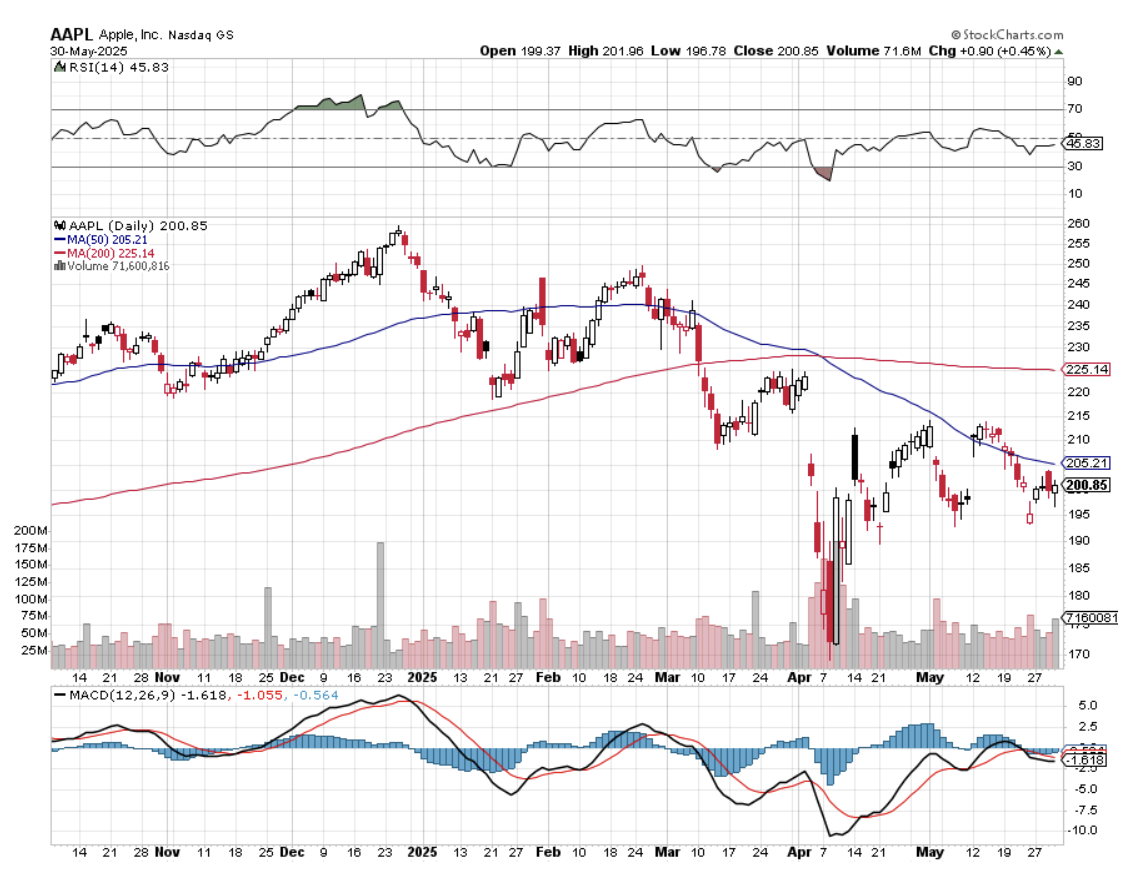
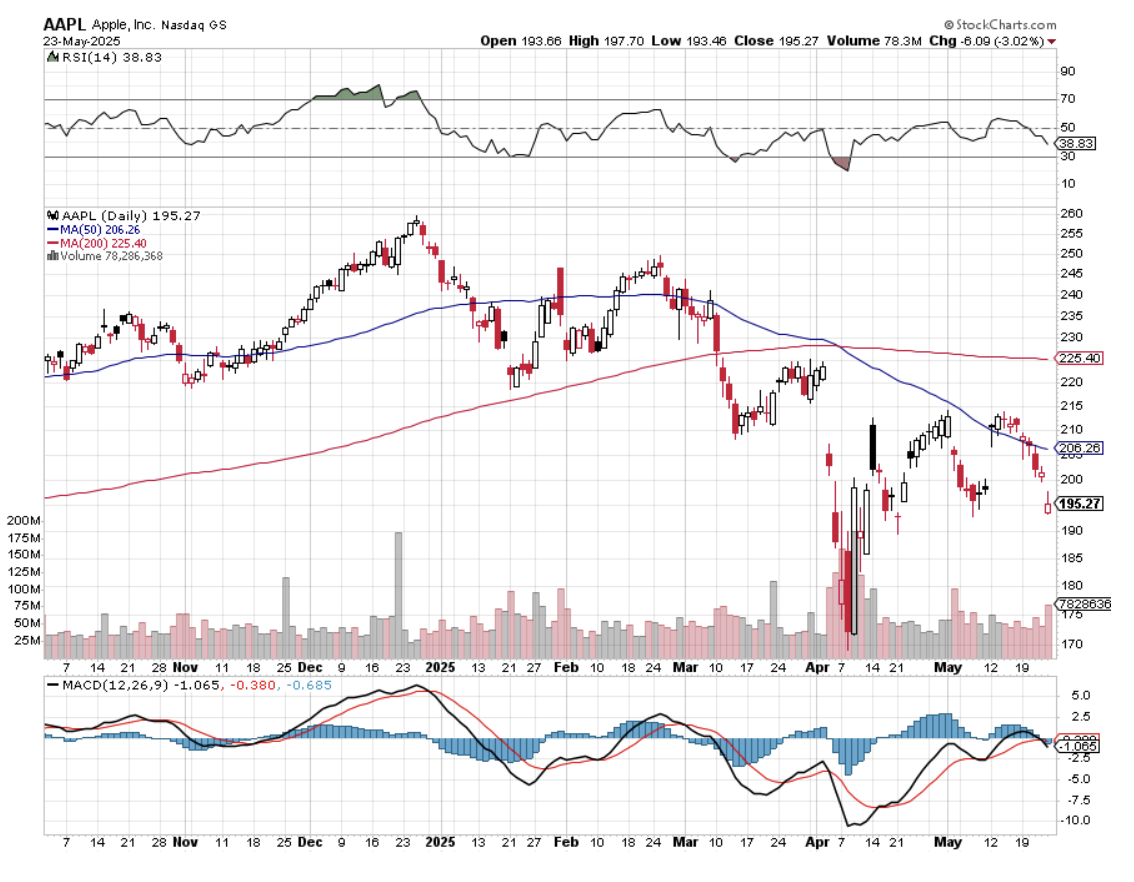
(AAPL) 6/$220-$230 put spread                            -10.00%

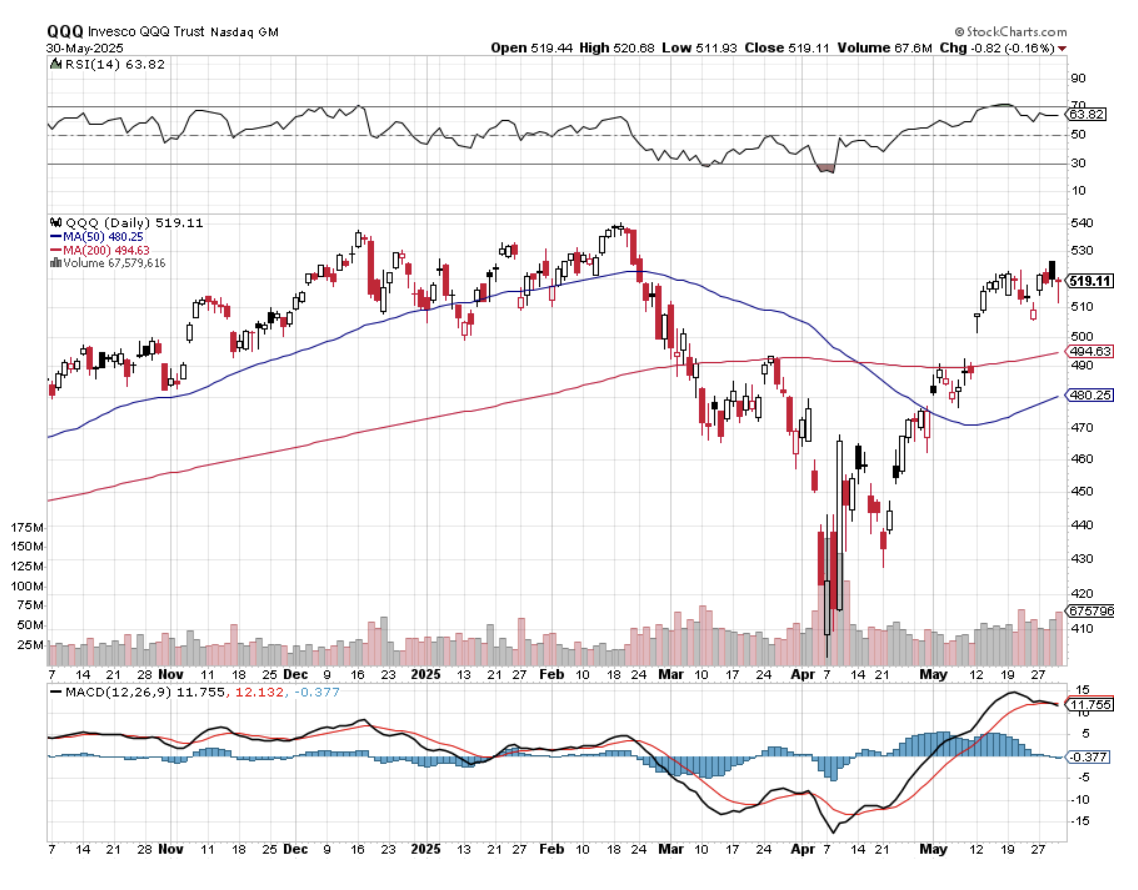
(QQQ) 6/$540-$550 put spread                              -10.00%

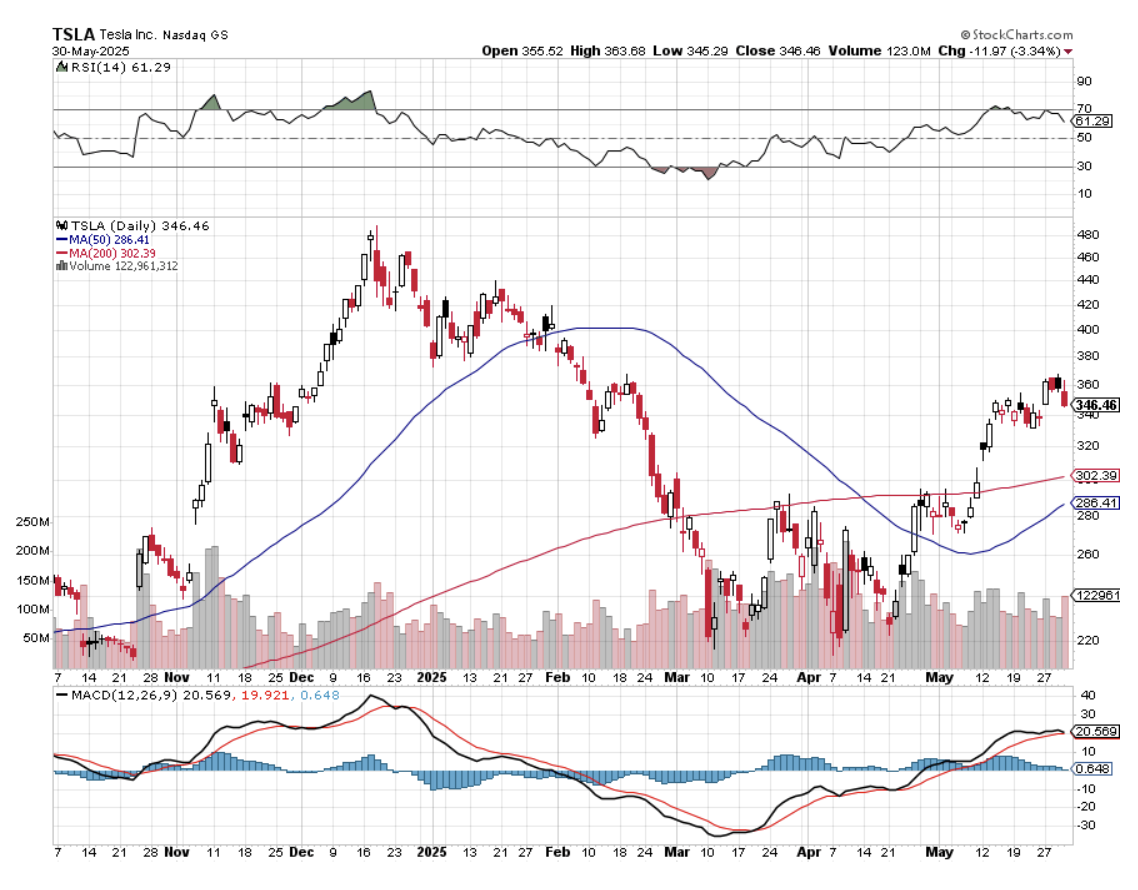
(TSLA) 6/$430-$440 put spread                              -10.00%

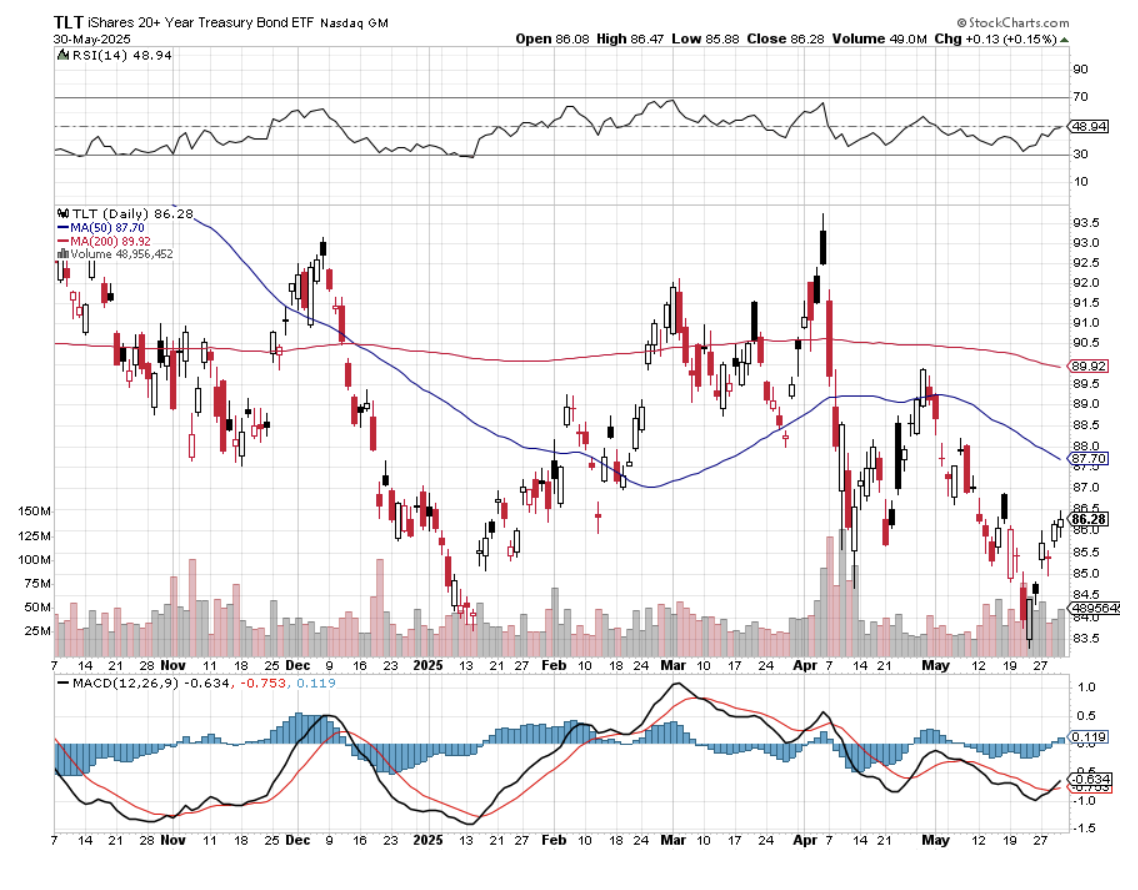
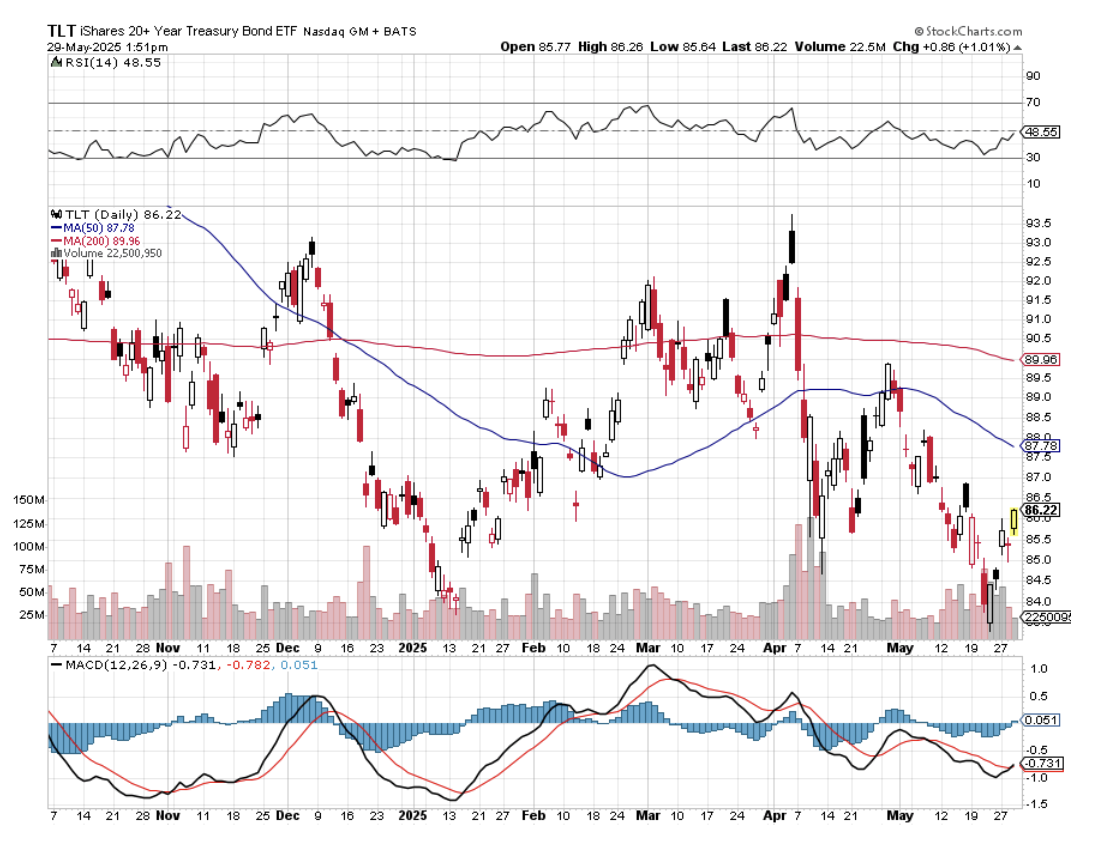
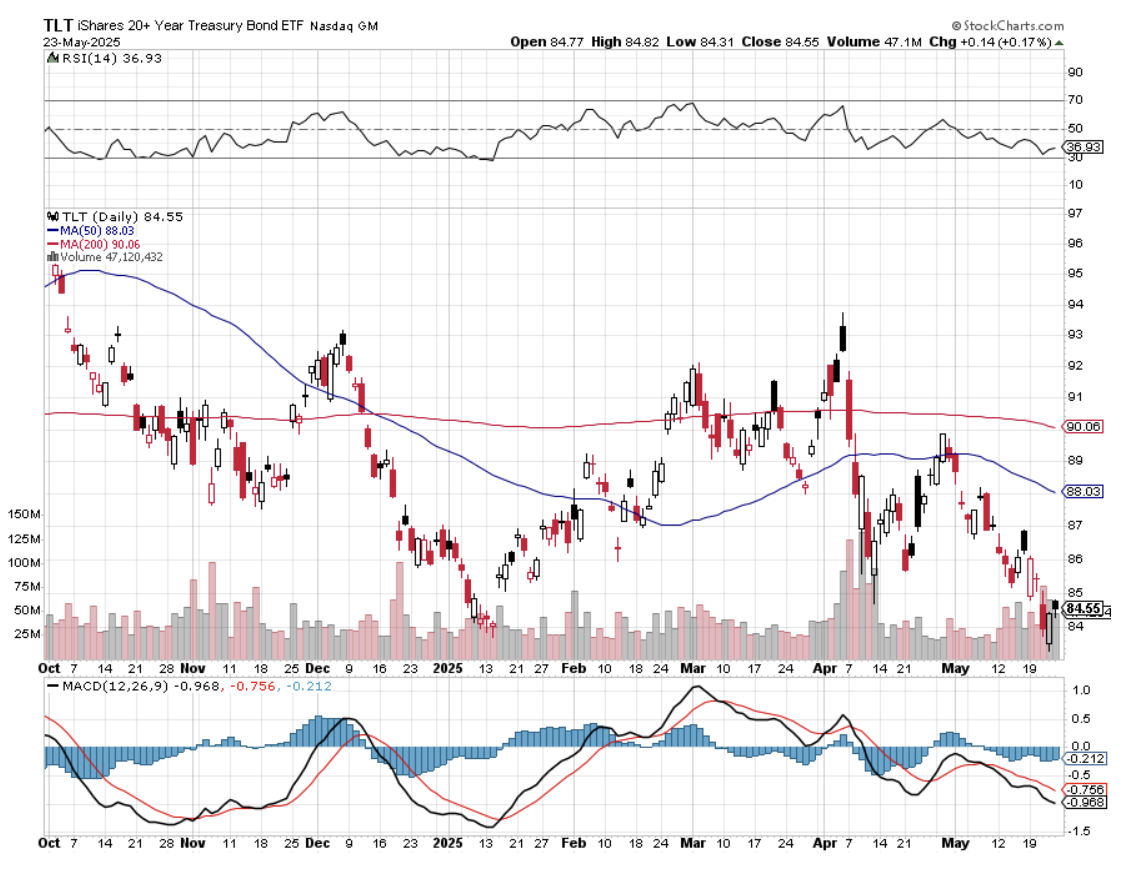
(TLT) 6/$88-$91 put spread                                       -10.00%

(WPM) 6/$75-$80 call spread                                    -10.00%


Total Net Position                                                           -80.00%

Total Gross Position                                                       90.00%


The important thing to look at here is my long/short balance. On the left is the position name, and on the right is the position weighting. I usually run 10% positions, so I don’t have all my eggs in one basket. Maybe twice a year, I’ll run a 20% position in a single stock, and once a year, I’ll have a 30% weighting. Above that, I start to lose sleep.

I have further subdivided the portfolio into “RISK ON” and “RISK OFF.” “RISK ON” means the world is getting better, while “RISK OFF” means the world is getting worse. The long positions have positive numbers, while the short positions have negative ones.

I like to balance “RISK ON” and “RISK OFF” to remove overall market risk from the portfolio. When markets are rising, I tilt positive. When markets are falling, I tilt negative. At the bottom, I have my total net exposure. On this particular day, I was running 60% in long and 20% in shorts, for a total net position of 40% long. This is an aggressively bullish portfolio.

When I’m bullish, the net position is positive. When I’m bearish, the net position is negative. When I have no strong views, the net position is zero. That way, if nothing happens, you still get to rake the money in.

I have no positions at all, only a few days a year. I only play when the risk/reward is overwhelmingly in my favor, and sometimes that is just not possible.

One more warning to the wise. There are literally hundreds of gurus out there marketing services promising 100% a year, if not 100% a month, or even 100% a day. They are all fake, created by 20-year-old marketing types who have never worked in the stock market, or even traded. Unfortunately, I work in an industry where almost everyone else is a crook.

I have worked in the markets for more than 50 years and have seen everything. Ray Dalio is the top-performing hedge fund manager in history, and he only averages 35% a year.  The number of real traders who are right more than 80% of the time you can almost count on one hand. If returns sound too good to be true, they never are.

I want to offer special caution about naked put shorting strategies, which are promoted by 90% of these letters. This is where a trader sells short a put position without any accompanying hedge, hence the word “naked.” This is an unlimited risk position.

You might take in a $1 premium with this approach, but if the market turns against you, and implied volatilities go through the roof, your losses could balloon exponentially to $100 or more, wiping you out. The newsletters recommending these have absolutely no idea when or if this is going to happen.

I call this the “picking up the pennies in front of the steamroller strategy.” No professional trader worth his salt will put money into it. It is banned by most investing institutions. And only a few brokers will still let you do this, and then only with 100% margin requirements, because when losses exceed 100% of capital, they’re left carrying the bag.

Many of those strategies you see being hawked online look great on paper but can’t actually be executed. In other words, you just paid thousands of dollars for an utterly useless service. Sounds like a “No Go” to me.

Stop losses are an important part of any trading strategy.  No one is right 100% of the time. If they claim so, they are lying. The best way to avoid a big loss is to take a small one.

There are many possible places to use stop losses. I use 2% of my total capital. If I start to lose more than that, I am out of there. It’s easy for me to do this because 90% of the time, the next trade will be a winner, and I’ll make back all the money I just lost.

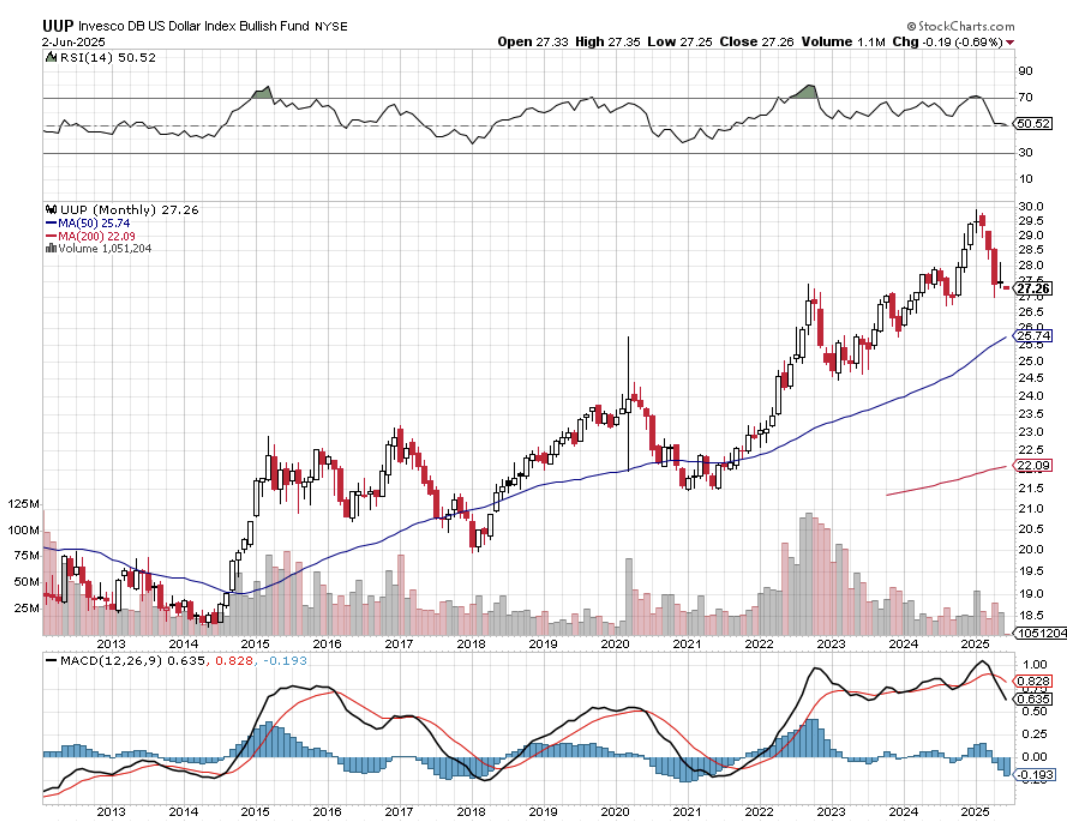
Others use a 10% decline in the underlying stock as a good arbitrary point to limit losses. Others rely on Fibonacci levels (I’ll get to him later). Many traders rely on key moving averages, like the 50-day or the 200-day.

The problem with this is that high-frequency traders have access to the same charting data as you do. They’ll program their algorithms to quickly take a stock through your stop loss level, buy your stock for cheap, and then take it right back up again to book a quick profit. You are left with a “SELL” confirmation in your inbox and no position in a rising market. No wonder people think Wall Street is rigged.

Another concept is the “trailing stop”. That’s when, after an initial rise, you place a stop loss order at your cost. That way you CAN’T lose money. This is known as “playing with the house’s money.” This approach has one shortfall. You can’t place stop losses in the options market that are executed automatically. The same is true for options spreads.

In this case, you use what is known as a “pocket stop loss,” where you set your own mental level on when to get out. Also, these are not automatic, they do establish a trading discipline. Caution: You can’t execute a pock stop-loss when you’re playing gold or on a one-week cruise in the Caribbean.

So, there you have it. By managing your risk prudently, you can tip the risk/reward balance in your favor.

I hope this helps.


https://www.madhedgefundtrader.com/wp-content/uploads/2018/01/john-truckee.jpg 316 352 april@madhedgefundtrader.com https://madhedgefundtrader.com/wp-content/uploads/2019/05/cropped-mad-hedge-logo-transparent-192x192_f9578834168ba24df3eb53916a12c882.png april@madhedgefundtrader.com2025-06-05 09:02:382025-06-05 10:38:09Learning the Art of Risk Control
MHFTR

The Two-Century Dollar Short

Diary, Homepage Posts, Newsletter, Research

Any trader will tell you the trend is your friend, and the overwhelming direction for the US dollar (UUP) for the last 243 years has been down.

Our first Treasury Secretary, Alexander Hamilton, found himself constantly embroiled in sex scandals. Take a ten-dollar bill out of your wallet and you’re looking at a world-class horn dog, a swordsman of the first order.

When he wasn’t fighting scandalous accusations in the press and the courts, he spent much of his six years in office orchestrating a rescue of our new currency, the US dollar.

Winning the Revolutionary War bankrupted the young United States, draining it of resources and leaving it with huge debts.

Hamilton settled many of these by giving creditors notes exchangeable for the worthless Indian land west of the Appalachians.

As soon as the ink was dry on these promissory notes, they traded in the secondary market for as low as 25% of face value, beginning a centuries-long government tradition of stiffing its lenders, a practice that continues to this day.

My unfortunate ancestors took him up on his offer, the end result being that I am now writing this letter to you from California—and am part Cherokee, Delaware, and Sioux.

It all ended in tears for Hamilton, who, misjudging former Vice President Aaron Burr’s true intentions in a New Jersey duel, ended up with a bullet in his back that severed his spinal cord.

Since Bloomberg machines weren’t around in 1782, we have to rely on alternative valuation measures for the dollar then, like purchasing power parity, and the value of goods priced in gold.

A chart of this data shows an undeniable permanent downtrend, which greatly accelerates after 1933 when FDR banned private ownership of gold and devalued the dollar.

Today, going short the currency of the world’s largest borrower, running the greatest trade and current account deficits in history, with a diminishing long-term growth rate, is a no-brainer.

But once it became every hedge fund trader’s free lunch, and positions became so lopsided against the buck, a reversal was inevitable.

We seem to be solidly in one of those periodic corrections, which began a few years ago, and could continue for months, or even years more.

The euro has its own particular problems, with the cost of a generous social safety net sending EC budget deficits careening. Add to that the gargantuan cost of a burgeoning refugee crisis.

Use this strength in the greenback to scale into core long positions in the currencies of countries that are major commodity exporters, boast rising trade and current account surpluses, and possess small consuming populations.

I’m talking about the Canadian dollar (FXC), the Australian dollar (FXA), and the New Zealand dollar (BNZ), all of which will eventually hit parity with the greenback once again.

Think of these as emerging markets where they speak English, best played through the local currencies.

I’m sure that if Alexander Hamilton were alive today, he would counsel our modern Treasury Secretary to talk the dollar up, but to do everything he could to undermine the buck behind the scenes, thus over time depreciating our national debt down to nothing through a stealth devaluation.

Given the Treasury’s performance so far regarding the dollar, I’d say they studied history well.

Hamilton must be smiling from the grave.


A 242-Year Chart of the US Dollar priced in Hard Goods


https://www.madhedgefundtrader.com/wp-content/uploads/2018/04/10-dollar-bill-story-2-image-3.jpg 135 320 MHFTR https://madhedgefundtrader.com/wp-content/uploads/2019/05/cropped-mad-hedge-logo-transparent-192x192_f9578834168ba24df3eb53916a12c882.png MHFTR2025-06-04 09:02:292025-06-04 10:03:20The Two-Century Dollar Short
Mad Hedge Fund Trader

Looking at the Large Numbers

Diary, Free Research, Homepage Posts, Newsletter

I friend of mine asked me what the Global Money supply was.

I just so happen to know that number. It is around $100 trillion. That includes the world’s total M2 money supply, all the physical cash in circulation, plus deposits, promissory notes, and other liquid money instruments.

Writing for The Economist magazine in London for ten years, I still constantly update these numbers in my mind. This, after all, is the air we breathe and the language we speak.

Then it occurred to me that most people don’t know these mega numbers, so I thought I would give you a basic primer and some conclusions.

Enjoy.

$1 quadrillion – the value of all assets in the world, both financial and physical

$100 trillion – Global money supply

$150 trillion – the value of all global bonds and fixed income securities

$100 trillion – value of global stock markets

$54 trillion – US stock market capitalization

$30 trillion – the value of global real estate

$36 trillion – US National debt

$27 trillion – US GDP and end Q1 2025

$22 trillion – US M2 money supply

$20 trillion – total value of US real Estate

$17.8 trillion – GDP of China

$18 trillion – value of global physical gold holdings

$4 trillion – 2021 US corporate profits

$6.7 trillion – US Federal Reserve balance sheet

$6.8 trillion – FY 2024 US Budget Spending (click here for details)

$4.9 trillion – 2024 US Budget revenues

$1.9 trillion – 2024 US Budget deficit

$4.2 trillion GDP of Japan

$4.5 trillion – GDP of Germany

$3.6 trillion – value of all issued cryptocurrencies

$4.0 trillion – GDP of California

$1.7 trillion – GDP of Australia

$2 trillion – GDP of Russia

Looking at this impressive list of numbers, there is one that leaps right out at you. That is the value of cryptocurrencies, which is only $2 trillion, two-thirds of which is Bitcoin.

That is less than 2% of the value of all assets in the world, 1% of the Global money supply, and .1% of US stock market capitalization. In other words, Bitcoin accounts for only a tiny share of global assets.

Which leads one to an obvious conclusion. The next big movement in money will be out of the largest asset classes into the smallest ones. The most obvious target here is the $150 trillion in the value of all bonds and fixed income securities, most of which have negative yields, or yields close to zero.

Move even a small portion out of bonds into Bitcoin, and its value has to double, triple, move up ten times, or even 100 times.

There are other screaming conclusions to be found in these numbers. The bond market (TLT) is toast and can only really go down from here. The same is true for the US dollar (UUP). Oh yes, and you want to buy the Australian dollar (FXA).

It gets better.

The US money supply is currently worth $20.5 trillion and is growing at a 30% rate. So, in a year it will be worth $26.65 trillion, and in two years it will be worth $34.65 trillion.

The biggest factor expanding the money supply today is NOT the government, but the explosive growth a US corporate profits, at $10 trillion in 2021, which is essentially a bet on the future of everything.

And US corporate earnings could continue growing at this ballistic for another decade or more.

That means that not only will global liquidity continue to increase, but it will also do so at an exponential rate.


US Corporate Profits


Federal Reserve Balance Sheet


https://www.madhedgefundtrader.com/wp-content/uploads/2021/09/US-corporate-profits.png 466 864 Mad Hedge Fund Trader https://madhedgefundtrader.com/wp-content/uploads/2019/05/cropped-mad-hedge-logo-transparent-192x192_f9578834168ba24df3eb53916a12c882.png Mad Hedge Fund Trader2025-06-03 09:02:052025-06-03 10:38:59Looking at the Large Numbers
april@madhedgefundtrader.com

The Market Outlook for the Week Ahead, or Heading into Stall Spead

Diary, Homepage Posts, Newsletter

Every pilot dreads a stall.

Pull your nose up so high that you are unable to maintain adequate speed, and your plane flips over and enters a spiral dive. Those who are skilled at stall recovery can right their plane in seconds and live to fly another day. Those who don’t meet a violent end.

As an aerobatic instructor myself, I have been in quite a few stalls. In some planes, stall recovery is a piece of cake, such as with a 1936 Boeing Stearman biplane. Try it in a 1942 P51 Mustang and you haven’t a chance unless you know the special recovery tricks unique to this ferocious aircraft.

Looking at my stock charts this weekend, I am getting a feeling of déjà vu all over again. The markets are stalling, losing momentum, and running out of fuel all over again. More concerning was the sector rotation that took place. Traders are fleeing aggressive big tech and financials and moving money into bombed-out utilities, health care, and energy. Technical warning lights are flashing red everywhere.

The only question is how far down we dive this time. The 200-day moving average at (SPX) $5,740 is begging for attention. After that, we have the 50-day moving average at 5,587. Below that, there’s nothing but thin air until we reach the April 7 low at 4,820.

Bombs away!

It all just highlights how far we have come in a mere seven weeks. Is it time to sell in May and go away? Sounds like a good idea to me.

Of course, a lot could depend on the economic data in the coming weeks, which could do anything. The world has been put through such turmoil this year that the data won’t be reliable or predictable for at least a year.

We head into the weekend with more bad news from Washington, DC. The Chinese have been dithering in the trade negotiations as I expected, and cut off the supply of essential rare earths to the US. The US has responded by doubling the tariff on steel imports to 50%, most of which comes from China. (All of Trump’s US hotels were built with Chinese steel.)

In addition, American courts have ruled that the new global 10% tariffs are illegal, which I also anticipated. It could be months before the Supreme Court renders a final decision. All this does is extend uncertainty for US companies by months, if not years.

There’s that blasted word again. I’m sure “uncertainty” will be named the word of the year by the Oxford English Dictionary if “tariffs” doesn’t get it first. Last year’s winner was “brain rot,” which refers to the impact of consuming excessive amounts of low-quality online content, especially on social media (click here).

Some competition.

This is not what bull markets are made of.

I have a strange feeling that the White House has hired an able technical analyst. Whenever markets are on the verge of complete breakdown, great news magically appears out of nowhere, enabling the Dow to rally 6,000 points. But after markets have enjoyed their big run, the bad news starts to dribble out again, and the market tanks.

I have been getting a lot of requests to update my long-term model portfolio. From a decades-long point of view, nothing has really changed. The global economy is being fundamentally remade by artificial intelligence, and those companies at the forefront will deliver the best investment performance. Never underestimate the earnings power of US tech companies. Notice how well big tech led the last rally. They will lead every new rally from here on. Trade wars, inflation, recessions, politics, and an exploding national debt are just temporary distractions. Keep focused on the big picture.

The only unknown is whether it will take four months or four years to resume the long-term trend. If it happens quickly, we may be able to recover a 10% annual return for stocks. If it doesn’t, the four-year return for stocks could well be zero. The government is learning the hard way that it is easier to break things than to put them back together. But whatever happens, even if stocks do come back into fashion again, the 95% return we saw over the last four years will remain but a fond memory.

On a final note, keep a sharp eye on all of the silver plays, including (SLV), (SIL), and (WPM). It has been trying to break out to the upside and catch up with gold for the past year. The next selloff in stocks might be just the elixir silver needs. The poor man’s gold, the white precious metal’s day is coming.

By the way, if you want to see some of the best aerobatics ever performed, watch 62-year-old Tom Cruise in the latest Mission: Impossible movie, The Final Reckoning. Even I was astounded. Which planes were they flying? Four 1936 Boeing Strearmen were shipped to South Africa for the filming.

My May performance picked up +1.29%. That takes us to a year-to-date profit of +29.69% so far in 2025. My trailing one-year return stands at a record +86.60%. That takes my average annualized return to +50.54% and my performance since inception to +781.58%.

It has been a relatively quiet week in the market. I stopped out of a long in (MSTR). That loss was more than offset by a double short in the same name. I also added a new short in (TSLA). That leaves me 70% “RISK OFF” in (GLD), (SPY), (MSTR), (AAPL), (QQQ), and (TSLA), 10% long in (MSTR), and 20% cash.

Some 63 of my 70 round trips in 2023, or 90%, were profitable. Some 74 of 94 trades were profitable in 2024, and several of those losses were really break-even. That is a success rate of +78.72%.

Try beating that anywhere.


1936 Boeing Stearman in US Army Colors

Courts Toss Global US Tariffs, as we are not in a state of war, the basis on which the administration based its emergency actions. Where that leaves us is anyone’s guess, but stocks like it for 15 minutes, with the Dow up 550 points, which it quickly gave away. The Supreme Court will have to weigh in before we get a final decision. The Constitution clearly gives the power to impose taxes and tariffs to Congress, not the White House.

Core Personal Consumption Expenditure comes into light. April showed a slight increase, resulting in a 2.1% year-over-year inflation rate, below economists’ expectations of 2.2%. Core PCE, which excludes food and energy, rose 2.5% year-over-year, consistent with forecasts and marking the lowest level for the index in over four years. 

The US Economy Contracted at an Annualized Rate of 0.2% in Q1 2025, a slight improvement from the initial estimate of a 0.3% decline, but still marked the first quarterly GDP contraction in three years. The upward revision was driven by stronger-than-expected fixed investment, which partially offset weaker consumer spending and a larger-than-anticipated drag from trade. Imports of goods and services soared 42.6% as businesses and consumers rushed to stockpile goods in anticipation of higher prices following a series of tariff announcements. Additionally, consumer spending growth slowed to 1.2%, the weakest pace since Q2 2023, while federal government spending dropped 4.6%, the steepest decline since Q1 2022. In contrast, fixed investment rose by 7.8%, the strongest gain since mid-2023, and exports increased by 2.4%.

Weekly Jobless Claims Jump, up 14,000 to 240,000. The number of Americans filing new applications for jobless benefits increased more than expected last week, and the unemployment rate appeared to have picked up in May, suggesting layoffs were rising as tariffs cloud the economic outlook. The report from the Labor Department on Thursday showed a surge in applications in Michigan last week, the nation’s motor vehicle assembly hub. The number of people collecting unemployment checks in mid-May was the largest in 3-1/2 years.

Nvidia comes in line, with both sales and profits, taking the shares up $7. China is still a dead weight, with the administration’s national security bans rendering $15 billion worth of inventory worthless. Despite earnings growth still on fire, the shares are unchanged YOY, which is what you get when everyone in the world already owns it. Buy (NVDA) on big dips.

Pending Home Sales Hit Three-Year Low, 6.3% in April to 71.3 on a signed contract basis. The decline in pending sales suggests the resale market will continue to struggle until prices come off their record levels and mortgage rates settle closer to 6%.

Home Prices are Still Rising, according to the S&P Case Shiller National Home Price Index in March, up 3.4% YOY. On a monthly basis, it was the decline since the pandemic. New York City leads with an 8.0% gain because of back-to-the-office orders. Chicago followed with a 6.5% increase and Cleveland with a 5.9% gain. Hurricane hit Tampa is still the only loser with a 2.2% loss.

Tesla Sales Still in Free Fall, with Europe down 49% in April versus an overall 31% decline for EVs in general. There is a ferocious price war in China. European consumers are also showing a preference for hybrid electric vehicles — cars with a small battery that still mainly run on traditional fuel. Hybrid electric vehicles account for just over 35% of the total European car market.

U.S. capital Goods Orders are collapsing, down 1.3% in April amid mounting uncertainty over the economy because of tariffs. That suggests business spending on equipment weakened at the start of the second quarter. The report from the Commerce Department on Tuesday also showed shipments of these goods falling last month. The government’s flip-flopping on import duties was making it difficult for businesses to plan ahead. That has been evident in the deterioration of sentiment among businesses.

Japanese Interest Rates are soaring, part of a worldwide trend, with ultra-long 40-year bond yields hitting 3.675%. Heavily indebted Japanese government bonds are the “canary in the global duration coalmine.” Long-dated debt has sold off on concerns about tax cuts and a chaotic roll-out of sweeping tariffs by the U.S. that will stoke inflation and force governments to spend more.

MicroStrategy (MSTR) issued $2 billion in Preferred Stock, yielding a 10% dividend, which it will use to buy more Bitcoin. The shares fell by 7.5%, even though the dilution of existing shareholders is only 2%. It gets back to my argument that even though total Bitcoin issuance is limited to only 21 million coins by 2040, there is no limit on Bitcoin derivatives.

Global Shipping Rates are soaring as a result of the on-again, off-again trade war. Port congestion is worsening at key gateways in northern Europe, with waiting times for berth space increasing significantly in Bremerhaven, Antwerp, and Hamburg due to labor shortages and low water levels on the Rhine River. The congestion is also affecting other hubs, including Shenzhen, Los Angeles, and New York, and is expected to continue for several weeks, with shipping lines facing delays and higher costs that may require freight rate hikes. Waiting times for berth space jumped 77% in Bremerhaven, Germany, between late March and mid-May.

The 60/40 Portfolio is Dead for Now, with both stocks and bonds going down at the same time. This isn’t supposed to happen. Bonds usually rise going into a recession. But foreign boycotts of new US bond issues and the “Sell America” trade have taken the (TLT) down from $94 to $83 this year, a loss of 11.7%. In the meantime, stocks have gone nowhere this year.

The Shale Oil Boom is Over, due to tax-subsidized US overproduction, weak Chinese consumption, and recession fears. As a result, oil companies are scaling back capital investment. Texas, Oklahoma, and Louisiana will get hit the hardest.


My Ten-Year View – A Reassessment

We have to substantially downsize our expectations of equity returns in view of the election outcome. My new American Golden Age, or the next Roaring Twenties, is now looking at multiple gale-force headwinds. The economy will completely stop decarbonizing. Technology innovation will slow. Trade wars will exact a high price. Inflation will return. The Dow Average will rise by 600% to 240,000 or more in the coming decade. The new America will be far more efficient and profitable than the old. My Dow 240,000 target has been pushed back to 2035.

On Monday, June 2, at 8:30 AM EST, the ISM Manufacturing Index is printed.

On Tuesday, June 3, at 7:30 AM, the JOLTS Job Opening Reports are announced.

On Wednesday, June 4, at 1:00 PM, the ISM Services PMI is released.

On Thursday, June 5, at 8:30 AM, the Weekly Jobless Claims are disclosed. We also get the Challenger Jobs Cuts Report.

On Friday, June 6, at 7:30 AM, we get the Nonfarm Payroll Report for May. At 1:00 PM, the Baker Hughes Rig Count is published.

As for me
, while working for The Economist magazine in London, I was invited to interview some pretty amazing people: Margaret Thatcher, Ronald Reagan, Yasir Arafat, Zhou Enlai.

But one stands out as an all-time favorite.

In 1982, I was working out of the magazine’s New York Bureau on Third Avenue and 47th Street, just seven blocks from my home on Sutton Place, when a surprise call came in from the editor in London, Andrew Knight. International calls were very expensive then, so it had to be important.

Did anyone in the company happen to have a US top secret clearance?

I answered that it just so happened that I did, a holdover from my days at the Nuclear Test Site in Nevada. “What’s the deal?” I asked?

A person they had been pursuing for decades had just retired and finally agreed to an interview, but only with someone who had clearance. Who was it? He couldn’t say now. I was ordered to fly to Los Angeles and await further instructions.

Intrigued, I boarded the next flight to LA, wondering what this was all about. What I remember about that flight is that sitting next to me in first class was the Hollywood director Oliver Stone, a Vietnam veteran who made the movie Platoon. When Stone learned I was from The Economist, he spent the entire six hours grilling me on every conspiracy theory under the sun, which I shot down one right after the other.

Once in LA, I checked into my favorite haunt, the Beverly Hills Hotel, requesting the suite that Marilyn Monroe used to live in. The call came in the middle of the night. Rent a four-wheel drive asap and head out to a remote ranch in the mountains 20 miles east of Santa Barbara. And who was I interviewing?

Kelly Johnson from Lockheed Aircraft (LMT).

Suddenly, everything became clear.

Kelly Johnson was a legend in the aviation community. He grew up on a farm in Michigan and obtained one of the first master’s degrees in Aeronautical Engineering in 1933 at the University of Michigan.

He cold-called Lockheed Aircraft in Los Angeles, begging for a job, then on the verge of bankruptcy in the depths of the Great Depression. Lockheed hired him for $80 a month. What was one of his early projects? Assisting Amelia Earhart with the customization of her Lockheed Electra for her coming round-the-world trip, from which she never returned.

Impressed with his performance, Lockheed assigned him to the company’s most secret project, the twin-engine P-38 Lightning, the first American fighter to top 400 miles per hour. With counter-rotating props, the plane was so advanced that it killed a quarter of the pilots who trained on it. But it allowed the US to dominate the air war in the Pacific early on.

Kelley’s next big job was the Lockheed Constellation (the “Connie” to us veterans), the plane that entered civil aviation after WWII. It was the first pressurized civilian plane that could fly above the clouds and carried an astonishing 44 passengers. Howard Hughes bought 50 just off the plans to found Trans World Airlines. Every airline eventually had to fly Connie’s or go out of business.

The Cold War was a golden age for Lockheed. Johnson created the famed “Skunkworks” at Edwards Air Force base in the Mojave Desert, where America’s most secret aircraft were developed.  He launched the C-130 Hercules, which I flew in Desert Storm, the F-104 Starfighter, and the high-altitude U-2 spy plane.

The highlight of his career was the SR-71 Blackbird spy plane, where every known technology was pushed to the limit. It could fly at Mach 3.0 at 100,000 feet. The Russians hated it because they couldn’t shoot it down. It was eventually put out of business by low-earth satellites. The closest I ever got to the SR-71 was the National Air & Space Museum in Washington, DC, at Dulles airport, where I spent an hour grilling a retired Blackbird pilot.

Johnson greeted me warmly and complimented me on my ability to find the place. I replied, “I’m an Eagle Scout.” He didn’t mind chatting as long as I accompanied him on his morning chores. No problem. We moved a herd of cattle from one field to another, milked a few cows, and fertilized the vegetables.

When I confessed to growing up on a ranch, he really opened up. It didn’t hurt that I was also an engineer and a scientist, so we spoke the same language. He proudly showed off his barn, probably the most technologically advanced one ever built. It looked like a Lockheed R&D lab with every imaginable power tool. Clearly, Kelley took work home on weekends.

Johnson recited one amazing story after another. In 1943, the British had managed to construct two Whittle jet engines and asked Kelly to build the first jet fighter. The country that could build jet fighters first would win the war. It was the world’s most valuable machine.

Johnson clamped the engine down to a test bench and fired it up, surrounded by fascinated engineers. The engine immediately sucked in a lab coat and blew up. Johnson got on the phone to England and said, “Send the other one.”

The Royal Air Force placed their sole remaining jet engine on a plane that flew directly to Burbank Airport. It arrived on a Sunday, so the scientist charged with the delivery took the day off and rode a taxi into Hollywood to sightsee.

There, the Los Angeles police arrested him for jaywalking. In the middle of WWII, with no passport, no ID, a foreign accent, and no uniform, they hauled him straight off to jail.

It took two days for Lockheed to find him. Johnson eventually attached the jet engine to a P-51 Mustang, creating the P-80, and eventually the F-80 Shooting Star (Lockheed always uses astronomical names). Only four made it to England before the war ended. They were only allowed to fly over England because the Allies were afraid the Germans would shoot one down and gain the technology.

But the Germans did have one thing on their side. The Los Angeles Police Department delayed the development of America’s first jet fighter by two days.

Germany did eventually build 1,000 Messerschmitt Me 262 jet fighters, but too late. Over half were destroyed on the ground, and the engines, made of steel and not the necessary titanium, only had a ten-hour life.

That evening, I enjoyed a fabulous steak dinner from a freshly slaughtered steer before I made my way home. I even helped Kelly slaughter the animal, just like I used to do on our ranch in Montana. Steaks are always better when the meat is fresh and we picked the best cuts. I went back to the hotel and wrote a story for the ages.

It was never published.

One of the preconditions of the interview was to obtain prior clearance from the National Security Agency. They were horrified by what Johnson had told me. He had gotten so old he couldn’t remember what was declassified and what was still secret.

The NSA already knew me well from our previous encounters, but MI-6 showed up at The Economist office in London and seized all papers related to the interview. That certainly amused my editor.

Johnson died at age 80 in 1990. As for me, it was just another day in my unbelievable life.


1947 Lockheed Constellation


SR-71 Blackbird


My Former Employer


Good Luck and Good Trading,

John Thomas
CEO & Publisher
The Diary of a Mad Hedge Fund Trader


https://www.madhedgefundtrader.com/wp-content/uploads/2021/09/john-thomas-economist-e1664802946349.png 285 500 april@madhedgefundtrader.com https://madhedgefundtrader.com/wp-content/uploads/2019/05/cropped-mad-hedge-logo-transparent-192x192_f9578834168ba24df3eb53916a12c882.png april@madhedgefundtrader.com2025-06-02 09:02:042025-06-02 11:11:00The Market Outlook for the Week Ahead, or Heading into Stall Spead
april@madhedgefundtrader.com

The Mad Hedge June Traders & Investors Summit is On!

Diary, Homepage Posts, Newsletter

The Fed has stopped raising interest rates, inflation is falling, and tech stocks are on fire! 

What should you do about it?

Attend the Mad Hedge Traders & Investors Summit during June 3-5. Learn from 24 of the best professionals in the market with decades of experience and the track records to prove it.

Every strategy and asset class will be covered, including stocks, bonds, foreign exchange, precious metals, commodities, energy, and real estate.

Get the tools to build an outstanding performance for your own portfolio.

Best of all, by signing up, you will automatically have a chance to win up to $100,000 in prizes. 

Usually, access to an exclusive conference like this costs thousands of dollars. You can attend for free!

Listening to this webinar will change your life! To register, please click here.


https://www.madhedgefundtrader.com/wp-content/uploads/2020/05/mr-john-thomas-1-e1595422688475.png 567 450 april@madhedgefundtrader.com https://madhedgefundtrader.com/wp-content/uploads/2019/05/cropped-mad-hedge-logo-transparent-192x192_f9578834168ba24df3eb53916a12c882.png april@madhedgefundtrader.com2025-05-30 09:04:222025-05-30 14:16:19The Mad Hedge June Traders & Investors Summit is On!
april@madhedgefundtrader.com

May 28 Biweekly Strategy Webinar Q&A

Diary, Homepage Posts, Newsletter

Below please find subscribers’ Q&A for the May 28 Mad Hedge Fund Trader Global Strategy Webinar, broadcast from Incline Village, NV.

Q: What is share price dilution?

A: When a company issues new shares, it dilutes the existing shareholders. So, if you owned 10% of the company before, and somebody does a 10% dilution, then you only own 9% of the company afterwards. Dilutions are usually bad for share prices, because it means everybody owns a little bit less. More shares mean lower prices. Companies do it to raise capital, and clearly, MicroStrategy (MSTR) was using the Las Vegas crypto conference as a means to promote the new issue, which they will then use to buy more Bitcoin. Just to show you how insane their business model is: they’re paying 10% to borrow money—10% guaranteed dividend on the new preferred stock—and using it to buy zero-yielding Bitcoin. So to me, that makes it a Ponzi scheme and the short of the century, and that’s why I put on a double short position, but I was too quick to also go back in on the long side. So, live and learn. Occasionally, you get snake bit.

Q: Down days for stocks have not resulted in flight to safety bids on bonds. Do you see this trend continuing?

A: Yes, I do. That is happening because of the “Sell America” trade; people are abandoning all their investments in America. Normally on a down day in the stock market, you get an up day in bonds. Now though, we’re getting down days in stocks and down days in bonds at the same time. That should not be happening, which means we are trading in a new paradigm now, and new paradigms can be very risky to trade because things don’t behave the way they have historically, and that’s really been going on all year. So get used to it. If you don’t like it, find another line of work, find another way to make money. 90-day T-bills are really good at a 4.4% risk free yield with deferred taxation.

Q: What about holding cash?

A: Whenever you own cash with a broker, you are taking on the credit risk of that broker. If the broker goes bankrupt, like MF Global did in 2011, it’ll take you 3 years to get your cash back. But if you own 90-day U.S. Treasury bills, you can order a bankrupt broker to just transfer your bills to another broker. So that’s why I always recommend 90-day T-bills over cash holdings or money market funds in brokers. This is what every hedge fund does.

Q: Why is the U.S. Stock market lagging the German DAX Index?

A: It’s not because Germany has suddenly taken the lead in technology.
You always want to invest in the country that is stimulating their economy, borrowing to stimulate their economy, and increasing their national debt, because that much of that money ends up in the stock market. We’re doing the opposite here in the US, slowing the economy and reducing the national debt. We are slowing down our economy with higher taxes and higher prices through the tariffs. So that explains a US market that is down YTD and a German market that is up 40%. They are also recovering from a 15-year oversold position. Basically, all the money in the world went into the U.S. markets since the great financial crisis of 2008-9, and now everyone’s overweight the United States, and all of a sudden, it’s not such a great place to invest, so that is what’s happening.

Q: Are there any strong transport companies that could take advantage of the tariff confusion?

A: The answer is no. Transports is one of the worst things to own in a recession because things stop moving. You’ll see when we get to the transport section that the charts are bearing that out. Look at (UPS), (UNP), and (FDX). The only area I know where there’s been a sudden burst of business is shipping containers from China. With the tariffs on again and off again, shippers have responded to the huge swings in their business from zero to enormous demand, as people try to ship in these little time slots that they’re getting. They’re getting enormous demand for containers to get to the U.S. during these 30, 60, or 90-day windows that have opened up.

Q: Is the Fed going to lower interest rates soon?

A: No, they are not. I doubt they will lower interest rates this year and may not even do it for a year until the new Fed governor is appointed, because the primary fear of the Fed right now is inflation caused by tariffs. As long as tariffs are on the front burner, there aren’t going be any interest rate cuts.

Q: Should I sell in May and go away?

A: Yes, sounds like a great idea to me. That’s why I’m 60% short.

Q: How about put spreads in the iShares 20+ Year Treasury Bond ETF (TLT)?

A: Too late. You really only want to do put spreads if by some miracle we get a rally like this year’s highs, like $94 for the (TLT), which is where we were really at only about a month ago; then, yes, that would be a great idea. Down here at $85, no thank you. Buying low, selling high, that’s my new trading strategy. I’m thinking of patenting the idea. It’s a revolutionary new concept.

Q: Are 90-day US Treasury bills tax-free?

A: No, they are not— they are taxed as ordinary income when they mature. Only municipal bonds are tax-free. Those are issued by your local town, county, and state.

Q: Is gold going to rise to $3,500 in the next year?

A: My target for this year is $4,000. Over the next 2 years, it’s $5,000. It really is the only flight to safety asset out there that is still working. Bonds no longer work, and the U.S. Dollar no longer works.

Q: Why is the Statue of Liberty in jail?

A: Because we are running such huge deficits.

Q: When and why will foreigners buy our bonds again?

A: When all current government policies are reversed—when we end the trade wars and confidence in the U.S. dollar is restored, and we stop engaging in economic warfare against our trading partners. One of the reasons Europeans are pulling money back out of the U.S. isthat  they’re moving out of a depreciating currency into an appreciating currency—the Euro. So, that is a big incentive for Europeans to take their money home.

Q: What are the odds of revaluing the U.S. gold reserve to a higher price than the current $34 an ounce that it is currently valued at?

A: I have no idea. This is what Franklin Roosevelt did to help end the Great Depression in the 1930s. He revalued the US gold holdings from $28 to $34 and used the extra money created to feed people and launch thousands of stimulus projects across the US. You see them in every American city, and I hike on the High Sierra trails built back then all the time. If Roosevelt hadn’t done that, five million Americans would have starved to death. It is possible that the present government will sell gold reserves in order to finance tax cuts for the wealthy. A revaluation to today’s gold market price of $3,347 per troy ounce from $34 would increase the value of the Treasury’s gold holding 98 times from $8.9 billion to $872 billion. So, that can’t be ruled out. Please don’t give them the idea. No one is starving today.

Q: What are the chances that the U.S. goes back onto the gold standard?

A: We went off the gold standard in 1934 because the growth of the global economy was limited by the growth of gold supplies. In fact, global gold supplies are shrinking as we run out of productive mines, and that is why the price is going up. So, if you’re looking to cause another Great Depression, that would be a good way to do it, going back on the gold standard. I mention this because one of the candidates for Fed Governor next year is Judy Shelton, who wants to put the U.S. back on the gold standard. She was voted down by the Senate last time they tried to appoint he to a Fed position. Having been a gold trader myself for 55 years, I’m familiar with all of these gold arguments. That is why we use paper money instead of gold-backed money. You can print all the paper money you want, but the average cost of mining new gold, I think, is around $1,600/ounce and rising fast. So, that greatly limits your supply.

Q: Did Nixon take the U.S. off the gold standard?

A: It was actually a two-step process. Franklin Delano Roosevelt banned the private ownership of gold in 1934, and then Nixon took us off the gold standard completely in 1972. That led to an 80% decline in the U.S. dollar against European currencies. I was a currency and gold trader in those days, so I remember those that well—gold went from $34 to $900. That was a great trading market, and most people my age (there are a few of us left) cut their teeth on trading currencies and gold. There were a lot of currencies to trade before the euro was created. You could do things like go long Italian lyra, short Danish mortgages, and all kinds of stuff, so all that business is now gone.

Q: Why hasn’t silver (SLV) broken out yet?

A: The answer is, silver is much more tied to the economy than is gold, because there’s a lot of demand from jewelry, which nobody buys in recessions. Solar, which is losing its subsidies, and also central banks, don’t buy silver for reserves—they buy gold. I’m sure  someone out there will run out there and say, “But wait, the Bank of Botswana owns a ton of silver.” Sure, but it’s not a major central bank play, and they’re a major part of the argument to buy gold.

To watch a replay of this webinar with all the charts, bells, whistles, and classic rock music, just log in to www.madhedgefundtrader.com , go to MY ACCOUNT, click on GLOBAL TRADING DISPATCH, then WEBINARS, and all the webinars from the last 12 years are there in all their glory.

Good Luck and Good Trading

John Thomas
CEO & Publisher
The Diary of a Mad Hedge Fund Trader


https://madhedgefundtrader.com/wp-content/uploads/2019/05/cropped-mad-hedge-logo-transparent-192x192_f9578834168ba24df3eb53916a12c882.png 0 0 april@madhedgefundtrader.com https://madhedgefundtrader.com/wp-content/uploads/2019/05/cropped-mad-hedge-logo-transparent-192x192_f9578834168ba24df3eb53916a12c882.png april@madhedgefundtrader.com2025-05-30 09:02:512025-05-30 14:13:17May 28 Biweekly Strategy Webinar Q&A
MHFTR

A Tribute to a True Veteran

Bitcoin Alerts, Diary, Homepage Posts, Newsletter, Research

The onset of the pandemic found me on an obscure, deserted coral ridge in the Solomon Islands in a remote corner of the South Pacific. The jungle was lush, and malarial mosquitoes alighted in clouds. I was looking over the capital city of Honiara on the main island, whose name is honored by all the Marine Corps. veterans:

Guadalcanal.

I had to hold back the tears as I dug through the foxhole on Hanekin’s Ridge defended by my Uncle Mitch during one of the most violent hand-to-hand battles of WWII. I found dozens of 6.5 mm Japanese Arisaka copper jacketed shells, along with an assortment of unexploded hand grenades, mortar shells, and 30 caliber machine gun casings.

I repeated the same at the base of Hill 27, where my then 19-year-old father fought a similar pitched battle. The battle was later chronicled in the 1998 movie The Thin Red Line. His suffering had to be immense. The reason he stayed in California is that visits to his native Brooklyn, NY, triggered his malaria. Dad never talked about the war.


Gingerly Handing a Live Japanese Grenade


Last Monday was Memorial Day in the United States.

I’ll be putting on my faded Marine Corps fatigues, with gold railroad track bars on my major’s oak leaves on my collar, and leading the hometown’s parade.  

Since job prospects for high school graduates in rural Pennsylvania were poor in 1936, Mitch walked 200 miles to the nearest Marine Corps recruiting station in Baltimore.

After basic training, he spent five years rotating between duty in China and the Philippines, manning the fabled gunboats up the Yangtze River.

When WWII broke out, he was a seasoned sergeant in charge of a machine gun platoon. That put him with the seventh regiment of the First Marine Division at Guadalcanal in October 1942. He missed the notorious Bataan Death March by weeks.

When the Japanese counterattacked, Mitch was put in charge of four Browning .30 caliber water-cooled machine guns and 33 men, dug in at trenches on a ridge above Henderson Field.


A Zero Fighter Wing


The Japanese launched massive waves of suicide attackers in a pouring tropical rainstorm all night long, frequently breaking through the lines and engaging in fierce hand-to-hand combat.

If the position fell, the line would have been broken, leading to a loss of the airfield and possibly the entire battle. WWII in the Pacific would have lasted two more years.

After the first hour, all of Mitch’s men were either dead or severely wounded, shot or slashed with samurai swords. So, Mitch fired one gun until it was empty, then scurried over to the next, and then the next. In between human waves of banzai attackers, he ran back and reloaded all the guns.

To more easily pitch hand grenades, he cut the arms off his green herringbone fatigues. When the Japanese launched their final assault and then retreated, he picked up a 50-pound Browning, cradled it in his arms, and ran down the hill after them, firing all the way, and burning all the skin off his left forearm.

Mitch’s commanding officer, Col. Herman H. Hanneken, heard the guns firing all night from the field behind. He was shocked when he visited the position the next morning, finding Mitch alone in front of a twisted sea of 2,000 Japanese bodies.

Mitch was awarded the Congressional Medal of Honor by General “Chesty” Puller at the Melbourne Cricket Grounds in Australia a few months later.


The Medal of Honor


After the war, Mitch, now a captain, was handed the plum of all Marine Corps jobs, acting as the liaison officer with Hollywood. He provided the planes, ships, Marines, and beaches needed to make the great classic war films.

He got to know stars like John Wayne, Lee Marvin, and yes, even Elvis Presley, who he described as “a very nice boy.” The iconic fictional hero in the 1949 film, Sands of Iwo Jima, the quiet, but strong Sergeant John M. Striker, was modeled after Mitch.

Tradition dictated that all military officers saluted Mitch, even five-star generals, and he was given a seat to attend every presidential inauguration from FDR on. When Mitch became too old to attend, I took that seat. Pacific countries issued stamps with his image, and Mattel sold a special GI Joe in his likeness, which I have.

When Mitch got older and infirm, I used my captain’s rank to escort him on diplomatic missions overseas to attend important events, like the D-Day 40th anniversary in Normandy.

The Top of Hill 27


Whenever Mitch was in town, he would join me for lunch with some of my history-oriented hedge fund clients and a more humble and self-effacing guy you never met. He occasionally scratched the massive scars on his forearm, which still bothered him after half a century.

I used to confess to my fellow traders present, “It makes what we do for a living look pretty feeble, doesn’t it?”


What’s Left of a Marine Corsair Shot Down


Mitch passed away in 2003 while he was working as a technical consultant to the pre-production of the HBO series, The Pacific, an absolute must-see for all armchair historians.

The principal character in the series is an amalgam of Mitch and John Basalone, another Medal of Honor winner at Guadalcanal. Basalone later died leading a charge on Iwo Jima, so his name was used in the film for dramatic effect.

The funeral in Riverside, California, was marked by a lone eagle, which continuously circled overhead. According to the Indian shaman present, this only occurs at the services for great warriors.

A dozen living Medal of Honor winners accompanied the casket. Boy, the Marines can sure put on a great funeral, perhaps because they have had so much practice.

When I get back from my parade, I’ll take out the samurai sword Mitch captured on that fateful day, a 1692 Muneshige, the hilt still scarred with 30 caliber slugs, and give it a ritual polishing in sesame oil and powdered deer horn, as samurai have done for a millennium.

While in Guadalcanal, I managed to dig up several dog tags from Marines missing in action that were still legible after 78 years in the ground. The Marine Historical Division in Quantico Station, Virginia, is tracing them so I can return them to the families.

To read more about the First Marine Division’s campaign during the war, please read the excellent paperback, The Island: A History of the First Marine Division on Guadalcanal by Herbert Laing Merillat, which you can buy by clicking here.

To buy the DVD, The Pacific, click here.


Mitchel Paige


Hanneken’s Ridge in 1942


Hanneken’s Ridge Today


A 30 Caliber Machine Gun


A US Wildcat Fighter Crash Landed


Marines Who Didn’t Make It Back


https://www.madhedgefundtrader.com/wp-content/uploads/2018/05/Man-with-medal-image-2-e1527280632711.jpg 383 300 MHFTR https://madhedgefundtrader.com/wp-content/uploads/2019/05/cropped-mad-hedge-logo-transparent-192x192_f9578834168ba24df3eb53916a12c882.png MHFTR2025-05-28 09:02:542025-05-28 14:29:11A Tribute to a True Veteran
april@madhedgefundtrader.com

The Market Outlook for the Week Ahead, or The Bond Vigilantes are Back!

Diary, Homepage Posts, Newsletter

A friend of mine once told me that when he dies, he wants to be reincarnated as the bond market. I don’t blame him. So would I.

The administration can talk up stocks, fire entire government agencies, ignore court rulings, arrest judges, and intimidate its own political party. The one thing it absolutely CAN’T do is control the bond market, which so far is giving the president’s performance a firm thumbs down by taking bond yields up to new 2025 highs, and prices to new lows.

Even if Trump appoints the most dovish Fed governor in history, which is likely in a year, the bond market won’t wear it for a second, potentially taking yields into double digits. The Fed can only control overnight interest rates. It can only affect long-term rates through quantitative tightening or easing, which now stands at $6.7 trillion of easing. The bond market is in charge of everything else.

The bottom line is that the bond market was far more willing to lend to President Biden than President Trump. That’s what the numbers say. That’s not just because Trump plans to increase the National Debt from $36 trillion to $51 trillion over the next 4-10 years. Trump has also threatened to withhold tax payments to foreign investors, impose limitations on capital flows, and default.

Let me tell you why the bond vigilantes are seeing red. The just-passed House budget plan assumes massive increases in tax revenues because it thinks the economy is growing at a 3% annual rate. News flash no 1: It isn’t. The economy is, in fact, shrinking as it does in recessions. It assumes that tariff revenues will double. New flash No. 2: tariff revenues have shrunk dramatically because of the collapse of international trade.

The US Treasury also assumes that foreign investors will continue to buy 30%-50% of our new bond issues. News flash no. 3: foreigners are selling huge amounts of their US Treasury bonds, not buying, which is why 30-year bond prices have collapsed and are basis points away from an 18-year high in yields at 5.18%.

The bond vigilantes are not to be taken lightly. The last time they were this upset was in 1979, when they took ten-year US Treasury bill yields up to 16%, causing a three-year-long recession. Stocks fell by 30% from already very low lows. The 20% inflation rate then was caused by the second oil shock and a collapsing US dollar, not tariffs.

I remember all this well because I was in the White House at the time during the administration of Ronald Reagan. Don’t kid yourself, this can’t happen again.

If it does, you can expect the S&P 500 to plunge to 3,000 or less. That’s because the S&P 500 price earnings multiple in 1979 was only at 7.9X versus 21X today.

The stock market seems to have tunnel vision, as it can only listen to one story at a time. After the inauguration, it saw high tariffs coming with laser-like focus, and the Index fell by 21%. On April 9, when tariffs were cut from 145% to 30%, the stock market decided that AI is more important than tariffs, and they soared by 23%. It will worry about tariffs when it actually sees them, which may be weeks or months off. Now bond yields are the order of the day, taking stocks down again.

Whatever happened to the original bond vigilantes? Inflation fell from 20% to 0.6%. The budget deficit ground down to zero during the Clinton administration in 1999. Then, people thought that the bond market might cease to exist, and insurance companies were making contingencies for investing in corporate debt instead. The bond vigilantes disappeared forever to become a footnote in history.

Oops!

Europe has responded to the trade war, including the 50% tariff threat issued on Friday, with their “TACO” Strategy-Trump Always Chickens Out. Trump’s cave on Chinese tariffs, from 145% to only 30%, has given Europeans hope that the best response to the trade war is to do nothing and let Trump negotiate with himself. They are aware that the longer negotiations drag on, the greater the political price Trump has to pay at home.

Even a 30% tariff will bring a US recession, but that beats the heck out of a depression that the 145% tariff would have caused. Could Europe be hanging on for the same 30% deal?

I wonder if the Chinese and the Europeans are talking to each other?

Recession expectations may leap from soft to hard data on Thursday, May 28, at 8:30 AM when we get the first preliminary read on Q2 GDP.

My May performance is down -2.43%. That takes us to a year-to-date profit of +25.97% so far in 2025. My trailing one-year return stands at a record +83.00%. That takes my average annualized return to +50.46% and my performance since inception to +777.86%.

It has been another wild week in the market. I took profits in my (SPY) short when the Dow Average suddenly cratered by 1,000 points. I took a small loss in (TLT), preferring to get out of the way of a rampaging hoard of bond vigilantes. I added two new longs in (MSTR) on the dip. That leaves me 60% short in (MSTR), (GLD), (AAPL), and (QQQ), 20% long in (MSTR), and 20% cash. We are about to retest the market lows.

Some 63 of my 70 round trips in 2023, or 90%, were profitable. Some 74 of 94 trades were profitable in 2024, and several of those losses were really break evens. That is a success rate of +78.72%.

Try beating that anywhere.

Stocks Crash on Treasury Bond Yield Spike, with ten-year yields hitting 4.6%. Wall Street’s worries about a ballooning deficit that threatens America’s status as a safe haven were reflected in a $16 billion Treasury sale of 20-year bonds that bombed, with stocks, bonds, and the dollar falling. A Foreign boycott was a major issue. The prospect of a House bill that could add up to $16 trillion to the national debt over the next 4-10 years has sent all asset classes into free fall, except for gold.

The Bond Vigilantes are Back, and are not to be taken lightly, as seen by yesterday’s failed auction of 20-year US Treasury bonds.  The last time they were this upset, they took the ten-year US Treasury bill yields up to 16%, causing a three-year-long recession. Stocks fell by 30% from already very low lows. The 20% inflation rate then was caused by an oil shock and a collapsing US dollar, not tariffs.

Trump Threatens 25% Tariff Against Apple
, unless the company builds iPhones in the US, which can’t be done. The shares dropped 6% on the news. The Dow dumped 400 points at the opening. Another day, another trade war. Maintain your (AAPL) short.

Walmart (WMT) is Planning Mass Layoffs, some 1,500 jobs, as demanded by the high prices brought by the trade war. Walmart is the largest U.S. private employer with about 1.6 million employees. It employed about 2.1 million employees worldwide in total, according to its website. It is also the country’s biggest importer, with about 60% of its imports, mainly items such as clothing, electronics, and toys, from China.

The company had last week said it would raise prices for some products by the end of May as President Donald Trump’s trade war hits its supply chain and increases expenses.

Existing Home Sales Hit 16-Year Low, down 0.5% to 4 million units. Inventory jumped 9% MOM and 21% YOY. That is a 4.4-month supply, a five-year high. The median home price is at $414,000, up 1.8% YOY. First-time buyers accounted for 30% of the sales. Homes over $1 million are doing better, up 6% YOY. The contract cancellation rate doubled due to the stock market crash.

US dollar Hits Two-Year Low, as the “Sell America” trade continues. It’s almost unprecedented for a currency to fall when its interest rates are rising. Debt, default, and trade wars are now the larger concern. Keep buying dips in (FXE), (FXA), (FXB), and (FXY) on dips.

New Home Sales Hit Three-Year High
, up 10.9%, but rising mortgage rates and economic uncertainty remained headwinds for the housing market. Builders are definitely trying to unload inventory ahead of a recession. Data for February and March was revised significantly down, taking some of the shine from the unexpected increase in sales last month. New homes are now cheaper than existing ones.

Weekly Jobless claims are Unchanged,
down only 2,000 to a seasonally adjusted 227,000 for the week ended May 17. They expect claims in the coming weeks to drift into the upper end of their 205,000-243,000 range for this year, mostly driven by difficulties adjusting the data for seasonal fluctuations. Economists, however, see layoffs picking up in the second half of 2025 as the administration’s tariffs dampen demand, snarl supply chains, and stoke inflation.

Investors Flock to Non-US Equity Funds
. Investors poured $2.5 billion into ex-US mutual funds and ETFs. It’s the highest inflow on record and reverses a three-year trend. Confidence in the US is falling as long as it is demolishing the economies of foreign trading partners.

Tesla Sales Aren’t Recovering
, with forecasts ranging from zero growth to down 10% YOY. The first three months of the year didn’t go as planned. Tesla delivered about 337,000 cars in the first quarter, down 13% from a year earlier and far below what Wall Street expected. At the start of 2025, the first-quarter delivery estimate was about 455,000 vehicles, according to FactSet. The miss even had Chief Financial Officer Vaibhav Taneja citing brand image “challenges”. Sell all (TSLA) rallies.

Gold Jumps 1% on US Bond Downgrade
. Credit downgrades and eventual default have been the dream of gold bugs for the last 50 years. Gold is the last flight to safety asset. Buy gold (GLD) on dips.

My Ten-Year View – A Reassessment

We have to substantially downsize our expectations of equity returns in view of the election outcome. My new American Golden Age, or the next Roaring Twenties, is now looking at multiple gale-force headwinds. The economy will completely stop decarbonizing. Technology innovation will slow. Trade wars will exact a high price. Inflation will return. The Dow Average will rise by 600% to 240,000 or more in the coming decade. The new America will be far more efficient and profitable than the old. My Dow 240,000 target has been pushed back to 2035.

On Monday, May 26, is Memorial Day and a National Holiday. All markets are closed.

On Tuesday, May 27, at 7:30 AM EST, the S&P Case Shiller National Home Price Index is announced.

On Wednesday, May 28, at 1:00 PM, minutes from the last FOMC Meeting are disclosed.

On Thursday, May 29, at 8:30 AM, the Weekly Jobless Claims are disclosed. We also get the preliminary read for Q2 GDP, which should indicate whether we are in recession or not.

On Friday, May 30, at 7:30 AM, we get Core Personal Consumer Expectations. At 1:00 PM, the Baker Hughes Rig Count is published.

As for me, when I first met Andrew Knight, the editor of The Economist magazine in London 50 years ago, he almost fell off his feet. Andrew was well known in the financial community because his father was a famous WWII Battle of Britain Spitfire pilot from New Zealand.

At 34, he had just been appointed the second youngest editor in the magazine’s 150-year history. I had been reporting from Tokyo for years, filing two stories a week about Japanese banking, finance, and politics.

The Economist shared an office in Tokyo with the Financial Times, and to pay the rent, I had to file an additional two stories a week for the Pink Newspaper as well. That’s where I saw my first fax machine, which then was as large as a washing machine, even though the actual electronics would fit in a notebook. It cost $5,000.

The Economist was the greatest calling card to the establishment one could ever have. Any president, prime minister, CEO, central banker, terrorist, or war criminal would suddenly be available for a one-hour chat about the important affairs of the world.

Some of my biggest catches? Presidents Gerald Ford, Jimmy Carter, Ronald Reagan, George Bush, and Bill Clinton, China’s Zhou Enlai and Deng Xiaoping, Japan’s Emperor Hirohito, terrorist Yasir Arafat, and Teddy Roosevelt’s oldest daughter, Alice Roosevelt Longworth, the first woman to smoke cigarettes in the White House in 1905.

Andrew thought that the quality of my posts was so good that I had to be a retired banker, at least 55 years old. We didn’t meet in person until I was invited to work the summer out of the magazine’s St. James Street office tower, just down the street from the palace of then-Prince Charles.

When he was introduced to a gangly 25-year-old instead, he thought it was a practical joke, which The Economist was famous for. As for me, I was impressed with Andrew’s ironed and creased blue jeans, an unheard-of practice in the Wild West where I came from.

The first unusual thing I noticed working in the office was that we were each handed bottles of whisky, gin, and wine every Friday. That was to keep us in the office working and out of the pub next door, the former embassy of the Republic of Texas from pre-1845. There is still a big white star on the front door.

Andrew told me I had just saved the magazine.

After the first oil shock in 1973, a global recession ensued, and all magazine advertising was canceled. But because of the shock, it was assumed that heavily oil-dependent Japan would go bankrupt. As a result, the country’s banks were forced to pay a ruinous 2% premium on all international borrowing. These were known as “Japan rates.”

To restore Japan’s reputation and credit rating, the government and the banks launched an advertising campaign unprecedented in modern times. At one point, Japan accounted for 80% of all business advertising worldwide. To attract these ads, the global media was screaming for more Japanese banking stories, and I was the only person in the world writing them.

Not only did I bail out The Economist, I ended up writing for over 50 business and finance publications around the world in every English-speaking country. I was knocking out 60 stories a month, or about two a day. By 26, I became the highest-paid journalist in the Foreign Correspondents’ Club of Japan and a familiar figure in every bank head office in Tokyo.

The Economist was notorious for running practical jokes as real news every April Fool’s Day. In the late 1970s, an April 1 issue once did a full-page survey on a country off the west coast of India called San Serif.

It warned that if the West Coast kept eroding, and the East Coast continued silting up, the country would eventually run into India, creating serious geopolitical problems.

It wasn’t until someone figured out that the country, the prime minister, and every town on the map were named after a type font that the hoax was uncovered.

This was way back, in the pre-Microsoft Word era, when no one outside the London Typesetters’ Union knew what Times Roman, Calibri, or Mangal meant.

Andrew is now 86 and I haven’t seen him in yonks. My business editor, the brilliant Peter Martin, died of cancer in 2002 at a very young 54, and the magazine still awards an annual journalism scholarship in his name.

My boss at The Economist Intelligence Unit, which was modelled on Britain’s MI5 spy service, was Marjorie Deane, who was one of the first women to work in business journalism. She passed away in 2008 at 94. Today, her foundation awards an annual internship at the magazine.

When I stopped by the London office a few years ago, I asked if they still handed out the free alcohol on Fridays. A shocked young writer ruefully told me, “No, they don’t do that anymore.”

Sometimes, change is for the worse, not the better.


Good Luck and Good Trading,

John Thomas
CEO & Publisher
The Diary of a Mad Hedge Fund Trader


50 Chart for Ten-Year US Treasury Bond Yields


https://www.madhedgefundtrader.com/wp-content/uploads/2021/09/john-thomas-economist-e1664802946349.png 285 500 april@madhedgefundtrader.com https://madhedgefundtrader.com/wp-content/uploads/2019/05/cropped-mad-hedge-logo-transparent-192x192_f9578834168ba24df3eb53916a12c882.png april@madhedgefundtrader.com2025-05-27 09:02:192025-05-27 16:42:33The Market Outlook for the Week Ahead, or The Bond Vigilantes are Back!
april@madhedgefundtrader.com

How to Read the Mad Hedge Daily Position Sheet

Diary, Homepage Posts, Newsletter

We have recently had a large influx of new subscribers.

Therefore, I am offering a refresher course on how to use the Mad Hedge Daily Position Sheet, which is included with your subscription. But first, let me dive back into the deep and dark primordial history of the Mad Hedge Fund Trader to learn its origins.

Because I missed the thrill and adrenaline of the financial markets, I started to launch a new hedge fund back in 2007. I had just spent six years in the oil & gas industry developing the new fracking technology, and it was just too slow and sedentary for me.

Weeks were spent landing drilling rights in some of the most remote, dry, and desolate parts of the US, and some of the people you had to deal with you didn’t necessarily want to introduce to your mother.

So I took the software and spreadsheets developed by the hedge fund I ran and eventually sold during the 1990s, modernized them, and added sophisticated new algorithms. Then I started raising money for a brand new hedge fund from high net worth individuals and institutions.

Then the 2008 financial crisis hit. Everyone to a man pulled out of my proposed fund, some losing their entire fortunes in the ensuing crash. One even gave me his place in line to buy the new Tesla Model S in 2009, which ended up becoming chassis number 125 off the assembly line in Fremont.

My new hedge fund would have to wait.

Then I wondered whether individual retail investors would have any interest in my services. My goal was to make available sophisticated trading strategies to individuals usually only available to the wealthy with $5 million minimum investments in large hedge funds.

I took the updated software I created for my new hedge fund and offered it as the Mad Hedge Fund Trader in February 2008. It turned out that the public interest was overwhelming, and the rest is history.

The Diary of a Mad Hedge Fund Trader proved so exhilarating that I never did get around to launching that new hedge fund. It turns out there is far more satisfaction in turning a $50,000 into $500,000 than converting a millionaire into a billionaire.

I promise to tell the rest of the story in a future letter.

In order to access the Mad Hedge Daily Position Sheet, do the following:

1) Log into your account at www.madhedgefundtrader.com by clicking on “Member Login” in the upper right corner.

2) Type in your email address and password in the white boxes in the lower left corner.

3) A page with “Welcome Back” appears. Hover your cursor over the blue “My Account” text in the upper right corner. A dropdown menu appears listing all of the Mad Hedge Services you have purchased.

4) Click on GLOBAL TRADING DISPATCH.

5) Eight blue and red boxes will appear. Click on the Current Positions blue box.

6) In the lower left corner, you will find a piece of blue hypertext link labeled “Download in Excel (XLSX) Updated for (today’s date). Click on this.

7) The new spreadsheet will appear in your “Downloads” folder. And here you have it to play with as you want.

Well, that was easy! You can now analyze your own positions, run your own market scenarios, adopt different assumptions, and so on. It’s yours to keep. Until tomorrow, when you get a new one.

Now that you’re in, there’s a lot here to digest. You are now officially a pro! At least a semi-pro.

First of all, make sure you have the correct Date in cell C2. We usually post an updated spreadsheet 30 minutes after the New York Stock Exchange closes at 4:00 PM EST (or 6:00 AM Sydney time the next day), but sometimes there are delays caused by chasing down errors.

If you are like me, the next cell you will want to jump to is the Month-to-Date Performance in cell F15. This determines whether you’ll be taking your wife or girlfriend out to an expensive dinner that night or spend the night tossing and turning in bed. Usually, it’s the former, but occasionally it’s the latter.

It’s an easy leap there to Year-to-Date Performance in cell F17 and Performance since the December 8, 2010 Inception in Cell F9.

Next, you will want to check my Asset Class Breakdown that starts in cell A11 to make sure you haven’t missed anything. Life happens, the Internet goes down, or emails can end up in SPAM folders, so it’s best to cross-check my trading book with yours. These are divided into Risk On and Risk Off positions. Risk On means that my global team’s exhaustive research has informed me that the underlying stock will rise. Risk Off means it will fall.

In an ideal world, Risk On and Risk Off balance each other out, generating a net risk of zero percent. This doesn’t actually happen very often (only in neutral market conditions, which are rare).

In reality, I am very heavy Risk On positions at market bottoms and very heavy Risk Off positions at market tops. And when the risk/reward is terrible, I will have no positions at all, as was the case at the end of June 2024. That is what you want. Always let the other guy unnecessarily stick their neck out.

Cell B32 will show the Total Net Position of all your longs and shorts. Cell B34 shows you the Total Aggregate Position, or the number of positions you have added up. That way, you know exactly how much free cash you have to spend on new positions.

To the right of the Asset Class Breakdown, you will see a multicolored pie chart showing the weightings of each individual position.

Next, we go to Current Positions in cell C39. Here is where you find the details of each individual position. Since I believe that the low-hanging fruit in the financial market is still in options spreads, where the risk-reward is overwhelmingly in your favor, these positions are presented in long and short pairs.

Column A – Date Opened
Column B – Date Closed
Column C – ticker symbol, maturity month, and option strike price
Column D – Asset Class
Column E – long or short
Column F – Underlying stop loss price (where you bail on a losing position)
Column G – Notional Cost
Column H – Current Market Price
Column I – Profit & Loss for the individual position
Column J – Profit & Loss for the spread pair of positions
Column K – Risk Weighting Metrics
Column L – Leverage
Column M – Portfolio Net Exposure
Column N – I keep open for future custom Algorithmic Analysis
Column O – I keep open for future custom Algorithmic Analysis
Column P – Number of options contracts per position. Negative numbers are short positions

In Cell C79, you will find a listing of all trades executed in 2025 along with their individual profit & loss. From Cell C150, you find a listing of all trades executed in 2024. We actually have records going back to 2010, but nobody cares about that except the SEC.

Well, that’s about it. If any of you have questions about the above explanation, please email me at support@madhedgefundtrader.com.

John Thomas
CEO & Publisher
The Diary of a Mad Hedge Fund Trader


https://www.madhedgefundtrader.com/wp-content/uploads/2024/07/John-thomas-in-Alaska.png 854 1138 april@madhedgefundtrader.com https://madhedgefundtrader.com/wp-content/uploads/2019/05/cropped-mad-hedge-logo-transparent-192x192_f9578834168ba24df3eb53916a12c882.png april@madhedgefundtrader.com2025-05-23 09:02:412025-05-23 15:59:01How to Read the Mad Hedge Daily Position Sheet
MHFTF

Decoding the Greenback

Diary, Homepage Posts, Newsletter

If you want to impress your friends with your vast knowledge of financial matters, then here are the Latin translations of the script on the back of a US dollar bill.

“ANNUIT COEPTIS” means “God has favored our undertaking.” “NOVUS ORDO SECLORUM” translates into “A new order has begun.” 

The Roman numerals at the base of the pyramid are “1776.” The better-known “E PLURIBUS UNUM” is “One nation from many people.” 

The basic design for the cotton and linen currency with red and blue silk fibers, which has been in circulation since 1957, carries enough symbolism to drive conspiracy theorists to distraction. 

An all-seeing eye? The darkened Western face of the pyramid? And of course, the number “13” abounds. 

Thank Freemason Benjamin Franklin for these cryptic symbols and watch Nicholas Cage’s historical adventure movie “National Treasure.” 

The balanced scales in the seal are certainly wishful thinking and a bit quaint if they refer to the Federal budget. 

Study the buck closely because there are soon going to be a lot more of them around, thanks to a deficit that is rising to record levels daily.


What Did You Really Mean, Ben?

https://www.madhedgefundtrader.com/wp-content/uploads/2018/10/Benjamin-Franklin.png 412 320 MHFTF https://madhedgefundtrader.com/wp-content/uploads/2019/05/cropped-mad-hedge-logo-transparent-192x192_f9578834168ba24df3eb53916a12c882.png MHFTF2025-05-21 09:04:032025-05-21 10:53:39Decoding the Greenback
Page 7 of 13«‹56789›»

Legal Disclaimer

There is a very high degree of risk involved in trading. Past results are not indicative of future returns. MadHedgeFundTrader.com and all individuals affiliated with this site assume no responsibilities for your trading and investment results. The indicators, strategies, columns, articles and all other features are for educational purposes only and should not be construed as investment advice. Information for futures trading observations are obtained from sources believed to be reliable, but we do not warrant its completeness or accuracy, or warrant any results from the use of the information. Your use of the trading observations is entirely at your own risk and it is your sole responsibility to evaluate the accuracy, completeness and usefulness of the information. You must assess the risk of any trade with your broker and make your own independent decisions regarding any securities mentioned herein. Affiliates of MadHedgeFundTrader.com may have a position or effect transactions in the securities described herein (or options thereon) and/or otherwise employ trading strategies that may be consistent or inconsistent with the provided strategies.

Copyright © 2025. Mad Hedge Fund Trader. All Rights Reserved. support@madhedgefundtrader.com
Scroll to top