It certainly has been a year of gnashing teeth and tearing hair for inveterate gold bugs (GLD). They got everything they wanted on the fundamental side. Runaway printing presses from the Federal Reserve, profligate spending from the US government, and a series of unending crises threatening our oil supplies in the Middle East.
Yet, the barbarous relic has barely budged. It is down 4% year on year, and has been in a full-scale bear market for the past 18 months, stuck at $250 off its peak price. This flaccid performance is particularly egregious in the face of? a torrid stock market, which has seen the S&P 500 soar 13% from its November bottom. What gives? Is there no value in a financial panic anymore?
To paraphrase Winston Churchill, the answer is ?a riddle, wrapped in mystery, inside an enigma,? which is a fancy way of saying there are more reasons than one can count.
No growth in the monetary base is the first answer that I give guests at my frequent global strategy luncheons. Over the last four years, the Fed balance sheet has ballooned from $800 billion to $3.6 trillion, and could be on its way to $5 trillion, thanks to QE1, 2, 3, 4, and infinity.
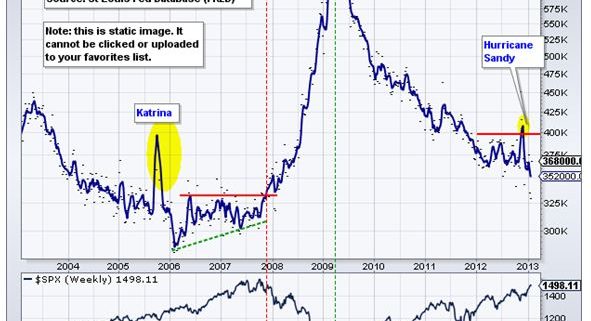
But the actual money in circulation in the broader economy, as measured by the Federal Reserve Bank of St. Louis, has flat lined for the past 18 months. No real monetary growth means no rising gold prices. Where did all that money go? On to the balance sheets of the big banks that refuse to lend, where it has sat, frozen in stone.
Gold in the past has been resorted to as a traditional inflation hedge. But look at the entire globe, and you can only find double digit price rises in sanction ridden Iran. They have been notable sellers of gold as they attempt to sell oil pay and for imports outside a US dollar based financial system. Look anywhere else, and deflation is the scourge of the day, from Japan, to Europe, to the US. Gold doesn?t fit in this picture anywhere.
Huge buying from China was a major factor in the golden age of the 2000?s, which enjoys a strong cultural affinity for all hard assets, especially gold and silver. A slower growing Middle Kingdom brings fewer buyers of the yellow metal. Sure, the post election (theirs, not ours) economy is recovering, but only to an 8% GDP growth rate, not the red hot 13% rate of past years. I can almost hear the air going out of gold.
The global bid we have seen for almost all risk assets has not exactly drawn buyers to the yellow stuff. Who needs an insurance policy when you are going to live forever. Gold used to be a ?RISK ON? asset, but underwent a gender change operation last fall. Now it goes to sleep whenever traders stampede into stocks.
Finally, gold has stopped rising because of the advanced age of the bull market. The yellow metal has been appreciating off its $240 bottom for 15 years now. It may have simply run out of steam. The last bull market, which launched when the US went off the gold standard in 1972, lasted only eight years. I remember waiting in line at a Johannesburg gold store to sell krugerands when it peaked.
It is an old trader?s nostrum that the cure for high prices is high prices. At least holders of bullion and coins have the consolation that they don?t own gold stocks (GDX), which have performed far worse.
I don?t believe that gold has entered a permanent bear market. Emerging market central banks still have to triple their holdings to catch up with the asset allocations of their western compatriots. That adds up to a lot of gold.
Individuals in emerging markets are still boosting gold holdings, although at a slower marginal rate than in the past. But for the time being, they seem content to sit on low bids around $1,500 and let the market come to them. I do expect a resurgence of gold?s best friend, inflation. But that won?t happen until we are well into the 2020?s, when a stiff demographic tailwind fans the flames.
Until then, the yellow metal could well stay directionless. That is a day trader?s or margin trader?s worst nightmare.

Flat Monetary Growth Means Flat Gold Prices


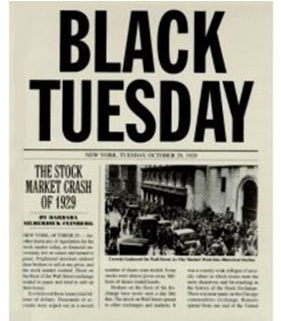
Crummy Long

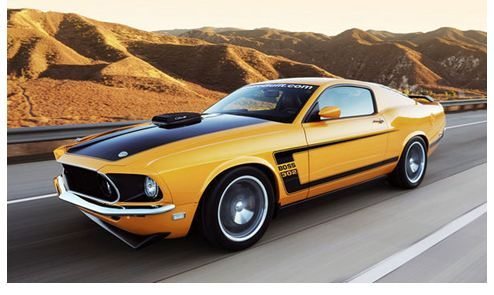
Great Long

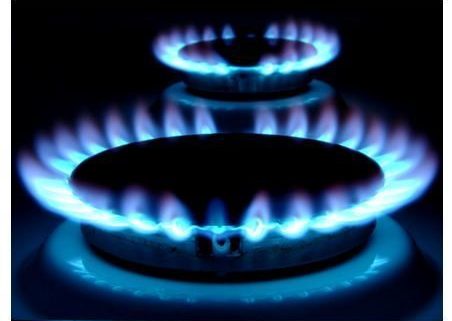
Call Me When You Wake Up