• support@madhedgefundtrader.com
  • Member Login
Mad Hedge Fund Trader
  • Home
  • About
  • Store
  • Luncheons
  • Testimonials
  • Contact Us
  • Click to open the search input field Click to open the search input field Search
  • Menu Menu

Tag Archive for: (DIA)

Mad Hedge Fund Trader

The Hard Numbers Behind Selling in May

Diary, Newsletter

If I had a nickel for every time that I heard the term ?Sell in May and go away? this year, I could retire. Oops, I already am retired! In any case, I thought that I would dig out the hard numbers and see how true this old trading adage is.

It turns out that it is far more powerful than I imagined. According to the data in the Stock Trader?s Almanac, $10,000 invested at the beginning of May and sold at the end of October every year since 1950 would be showing a loss today. Amazingly, $10,000 invested on every November 1 and sold at the end of April would today be worth $702,000, giving you a compound annual return of 7.10%.

My friends at the research house, Dorsey, Wright & Associates, (click here for their site at http://www.dorseywright.com/) have parsed the data even further. Since 2000, the Dow has managed a feeble return of only 4%, while the long winter/short summer strategy generated a stunning 64%.

Of the 62 years under study, the market was down in 25 May-October periods, but negative in only 13 of the November-April periods, and down only three times in the last 20 years! There have been just three times when the "good 6 months" have lost more than 10% (1969, 1973 and 2008), but with the "bad six month" time period there have been 11 losing efforts of 10% or more.

Being a long time student of the American, and indeed, the global economy, I have long had a theory behind the regularity of this cycle. It?s enough to base a pagan religion around, like the once practicing Druids at Stonehenge.
Up until the 1920?s, we had an overwhelmingly agricultural economy. Farmers were always at maximum financial distress in the fall, when their outlays for seed, fertilizer, and labor were the greatest, but they had yet to earn any income from the sale of their crops. So they had to borrow all at once, placing a large cash call on the financial system as a whole. This is why we have seen so many stock market crashes in October. Once the system swallows this lump, it?s nothing but green lights for six months.
After the cycle was set and easily identifiable by low-end computer algorithms, the trend became a self-fulfilling prophecy. Yes, it may be disturbing to learn that we ardent stock market practitioners might in fact be the high priests of a strange set of beliefs. But hey, some people will do anything to outperform the market.

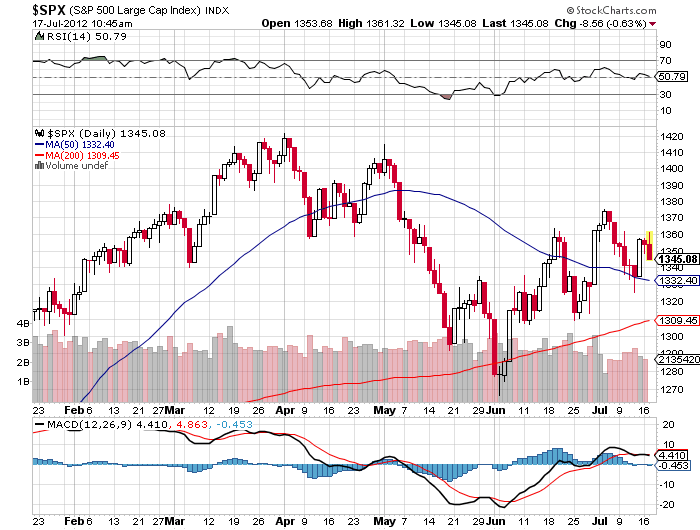
It is important to remember that this cyclicality is not 100%, and you know the one time you bet the ranch, it won?t work. But you really have to wonder what investors are expecting when they buy stocks at these elevated levels, over $159 in the S&P 500.

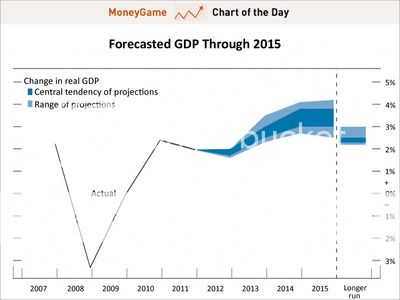
Will company earnings multiples further expand from 15.5 to 17 or 18? Will the GDP suddenly reaccelerate from a 2% rate to the 4% expected by share prices when the daily data flow is pointing the opposite direction?

I can?t wait to see how this one plays out.

SPY 4-24-13

DIA 4-24-13

XLY 4-24-13

XRT 4-24-13

Beach Sun Bathers Thank Goodness I Sold in May

https://www.madhedgefundtrader.com/wp-content/uploads/2013/04/Beach-Sun-Bathers.jpg 207 209 Mad Hedge Fund Trader https://madhedgefundtrader.com/wp-content/uploads/2019/05/cropped-mad-hedge-logo-transparent-192x192_f9578834168ba24df3eb53916a12c882.png Mad Hedge Fund Trader2013-04-29 01:33:422013-04-29 01:33:42The Hard Numbers Behind Selling in May
Mad Hedge Fund Trader

?Sell in May? Has Started

Newsletter

You don?t have to wait until May for the next correction in the stock market, which is only four trading days away. Take a look at the charts below prepared by my good friends, Arthur Hill and John Murphy at Stockcharts.com, and you?ll see it has already started. In fact, it might be almost over.

Only 42% of stocks listed on the New York Stock Exchange are now above their 50-day moving averages, down from the 90% peak at the end of January. That suggests we are already well into bear market territory. The downturn has been lead by materials, technology, energy, and industrials.

Look at the charts for the S&P 500 (SPY) and the Dow. We are clearly on target to match the previous all time highs in the next few days, possibly during the month end liquidity surge. That?s where potential double tops come into play. If I am right, then we could be in for a 5%-10% pullback. If I am wrong, then we are in for a flat line for a month before we resume the upward path.

So I am modifying my trading strategy that has been wildly successful for the past six months, delivering to you a 45% performance gain off the bottom. To use all of my favorite sailing metaphors, I?ll be battening down the hatches, clearing the decks, reefing the sheets, and preparing for a squall.

Here are the following course adjustments I recommend for a tougher market:

1) Cut your book in half and maintain a 50% cash position to take advantage of the unanticipated opportunities that will almost certainly come. You can?t buy bottoms if you lost all of your money on the downslide.

2) Shorten your maturities. Instead of betting the ranch by going out two or three months, limit option positions to the front month. There is no crueler existence than managing a long dated option position that is going against you.

3) Pigs get fed, but hogs get slaughtered. Instead of running positions into expiration, go for quicker, smaller profits. Instead of keeping the entire profit, settle for half or two thirds. Market volatility is so low that it is not worth hanging on for the final two weeks just to capture the last few basis points. This shortens the time that surprises or black swans can happen. Use time as capital. As I have so magnificently shown this year, you get a much higher score hitting 40 singles than a couple of home runs (hint for foreigners: our baseball season has just started).

4) Get yourself some short exposure for the inevitable shakeout. I recommend put spreads in the Russell 2000 (IWM), which always falls the fastest in down markets. But go at least 5% in-the-money to give yourself a safety margin income in case this thing keeps clawing its way up.

5) Avoid positions that have worked well for the past half-year, because this is where traders will rush to take profits and ?de-risk? their books first. This includes long positions in consumer staples, pharmaceuticals, utilities, and transportation, and short positions in commodities (CU), oil (USO), and precious metals (GLD) (SLV).

6) Get out of your bond shorts. It?s amazing to me that ten-year yields (TLT) have fallen to a parsimonious 1.70%, while stocks have rallied. But then, it has been an amazing life. This is rare in the rich tapestry of financial markets and usually presages trouble. It can only mean that the smart money is positioning itself cautiously in anticipation of a dump in stocks. If that is the case, the May correction could take ten year yields down to 1.50%, and bond prices though the roof. Use the month end ?RISK ON? surge to take profits on the (TBT).

There is an alternative explanation for all of this. The correction is already done and we are about to launch into a new bull leg. The selloff has been masked by a rotation within the broader indexes. Take another look at the chart of stocks above their 50-day moving averages. We have spent three months falling from 90% to 42%. Historically, it bottoms at 20%. The last time this happened was at the end of November and early June. Remember what happened after that?

If that is the case, we are already two thirds of the way through the spring correction, and on the eve of another 5%-10% leg up in stocks and other risk assets. It is what investors are least expecting; therefore, it cannot be ruled out. As my in-house strategist, Sherlock Holmes, used to say, ?Eliminate the obvious, and consider all other possibilities.?

SPY 4-24-13

DIA 4-24-13

NYA50R 4-22-13

SPX 4-23-13

Sherlock Holmes Meet My New Strategist

https://www.madhedgefundtrader.com/wp-content/uploads/2013/04/Sherlock-Holmes.jpg 296 242 Mad Hedge Fund Trader https://madhedgefundtrader.com/wp-content/uploads/2019/05/cropped-mad-hedge-logo-transparent-192x192_f9578834168ba24df3eb53916a12c882.png Mad Hedge Fund Trader2013-04-25 09:19:092013-04-25 09:19:09?Sell in May? Has Started
Mad Hedge Fund Trader

Bidding for the Stars

Diary, Newsletter

A few years ago, I went to a charity fundraiser at San Francisco?s priciest jewelry store, Shreve & Co. The well-heeled masters of the universe bid for dates with the local high society beauties, dripping in diamonds and Channel No. 5. Well fueled with champagne, I jumped into a spirited bidding war over one of the Bay Area?s premier hotties, whom shall remain nameless. Suffice to say, she has a sports stadium named after her.

The bids soared to $12,000, $13,000, $14,000. After all, it was for a good cause, Pari Livermore?s California State Parks Foundation. But when it hit $12,400, I suddenly developed lockjaw. Later, the sheepish winner with a severe case of buyer?s remorse came to me and offered his date back to me for $14,000.? I said ?no thanks.? $13,000, $12,000, $11,000? I passed.

The current altitude of the stock market reminds me of that evening. If you rode gold (GLD) from $800 to $1,920, oil, from $35 to $149, and the (DIG) from $20 to $60, why sweat trying to eke out a few more basis points, especially when the risk/reward ratio sucks so badly, as it does now?

I realize that many of you are not hedge fund managers, and that running a prop desk, mutual fund, 401k, pension fund, or day trading account has its own demands. But let me quote what my favorite Chinese general, Deng Xiaoping, once told me: ?There is a time to fish, and a time to hang your nets out to dry.? That?s why my cash position has steadily been rising over the last few weeks.

At least then I?ll have plenty of dry powder for when the window of opportunity reopens for business. So while I?m mending my nets, I?ll be building new lists of trades for you to strap on when the sun, moon, and stars align once again.

As for that date? She eventually married one of California premier technology titans, an established billionaire in his own right, and now has two cute kids. It?s all part of life?s rich mosaic. And sorry, I?m not saying who because gentlemen don?t talk.

DIA 4-15-13

SPY 4-15-13

IWM 4-12-13

QQQ 4-11-12

Shreve & Co.

https://www.madhedgefundtrader.com/wp-content/uploads/2013/04/Shreve-Co..jpg 378 431 Mad Hedge Fund Trader https://madhedgefundtrader.com/wp-content/uploads/2019/05/cropped-mad-hedge-logo-transparent-192x192_f9578834168ba24df3eb53916a12c882.png Mad Hedge Fund Trader2013-04-16 01:33:032013-04-16 01:33:03Bidding for the Stars
DougD

QE3 Blows Out Bears.

Newsletter

The big surprise today was not that the Federal Reserve launched QE3, but the extent of it. ?For a start, they moved the ?low interest rate? target out to mid-2015. ?They left the commitment to bond-buying open-ended. ?The first-year commitment came in at $480 billion, in-line with previous efforts.

Reading the statement from the Open Market Committee, you can?t imagine a more aggressive posture to stimulate the economy. ?You have to wonder how bad the data that we haven?t seen yet is, not just here, but in Europe and Asia as well. The big question now is: ?Will it make any difference??

Asset markets certainly bought the ?RISK ON? story hook, line, and sinker in the wake of the Fed action. ?Gold leapt $30, the Dow soared 200 points, the dollar (UUP) was crushed, the Australian dollar (FXA) rocketed a full penny (ouch!), and junk bonds (HYG) caught a new bid at all-time highs. ?The real puzzler was the Treasury bond market, which saw the (TLT) fall 2 ? points. ?I guess this is because the new Fed buying will be focused on mortgage-backed securities at the expense of Treasuries.

I knew that if they were to do anything, it would be aimed at the residential real estate market, which has been a thorn in their side for the last five years. ?The reason we have 1.5% growth instead of 3% is real estate. Real estate is the missing 1.5%.

But what will be the impact? ?Some $480 billion of buying of mortgage-backed securities over the next 12 months will lower the 30 year conventional mortgage from the current 3.70%. ?But all that will do is enable those who refinanced for the last two years in a row to do so a third time. Those who are underwater on their mortgages and have only negative equity to offer banks as collateral will remain shut out. ?This will generate a big payday for mortgage brokers, but won?t trigger any net new home-buying which the economy desperately needs.

The harsh reality for the housing market is that the demographic headwind of downsizing baby boomers is so ferocious that the Fed is unable to piss against it. Here is the problem:

*80 million baby boomers are trying to sell houses to 65 million Gen Xer?s who earn half as much

*6 million homes are late or in default on payments

*An additional shadow inventory of 15 million units overhangs the market owned by frustrated sellers

*Fannie Mae and Freddie Mac are in receivership, which account for? 95% of US home mortgages.? Each needs $100 billion in new capital. Good luck getting that out of a deadlocked congress

*The home mortgage deduction a big target in any tax revamp. The government would gain $250 billion in revenues in such a move

*The best case scenario for real estate is that we bump along a bottom for 5 years. The worst case is that we go down another 20% when a recession hits in 2013.

It could be that 95% of the new QE3 is already in the market, and that the markets will roll over once the initial headlines and ?feel good? factor wears off. ?With the markets discounting this action for nearly four months, this could be one of the greatest ?buy the rumor, sell the news? opportunities of all time.

Whatever the case, I am not inclined to chase risk assets up here. Anyway, I am now so far ahead of my performance benchmarks for the year that I can?t even see them on a clear day.


Is That My Benchmark Out There?

https://madhedgefundtrader.com/wp-content/uploads/2019/05/cropped-mad-hedge-logo-transparent-192x192_f9578834168ba24df3eb53916a12c882.png 0 0 DougD https://madhedgefundtrader.com/wp-content/uploads/2019/05/cropped-mad-hedge-logo-transparent-192x192_f9578834168ba24df3eb53916a12c882.png DougD2012-09-13 23:03:282012-09-13 23:03:28QE3 Blows Out Bears.
DougD

Watch Out for the Coming Risk Reversal

Newsletter

It is a fact of life that markets get overstretched. Think of pulling on a rubber band too hard, or loading too many paddlers at one end of a canoe. Whatever the metaphor, the outcome is always unpleasant and sometimes disastrous.

Take a look at the charts below and you can see how extended markets have become. Stocks (DIA), (QQQ), (IWM) have reached the top of decade and a half trading ranges. Bonds (TLT), (LQD) are at three month lows, and yields have seen the sharpest back up in over a year.

In the meantime, the non-confirmations of these trends are a dime a dozen. Every trader?s handbook says that you unload risk assets like crazy whenever you see the volatility index (VIX) trade in the low teens for this long. The Shanghai Index ($SSEC), representative of the part of the world that generates 75% of the world?s corporate profits, hit a new four year low last night. Copper (CU) doesn?t believe in this risk rally for a nanosecond. Nor is the Australian dollar (FXA) signaling that happy days are here again.

I am betting that when the whales come back from their vacations in Southampton, Portofino, or the South of France, they are going to have a heart attack when they see the current prices of risk assets. A big loud ?SELL? may be the consequence of a homecoming. A Jackson Hole confab of central bankers that delivers no substantial headlines next week could also deliver the trigger for a sell off.

You may have noticed that European Central Bank president, Mario Draghi, has come down with a case of verbal diarrhea this summer. His pro-bailout comments have been coming hot and heavy. When the continent?s leaders return from their extended six week vacations, it will be time to put up or shut up. The final nail in this coffin could be A Federal Reserve that develops lockjaw instead of announcing QE3 at their September 12-13 meeting of the Open Market Committee.

To me, it all adds up to a correction of at least 5%, or 70 points in the S&P 500, down to 1,350. I?m not looking for anything more dramatic than that in the run up to the presidential election. I am setting up my bear put spreads to reach their maximum point of profitability in the face of such a modest setback. A dream come true for the bears would be a retest of the May lows at 1,266, however unlikely that may be.

For the real crash, you?ll have to wait for 2013 when a recession almost certainly ensues. Stay tuned to this letter as to exactly when that will begin.

?The Real Crash Isn?t Coming Until 2013

https://madhedgefundtrader.com/wp-content/uploads/2019/05/cropped-mad-hedge-logo-transparent-192x192_f9578834168ba24df3eb53916a12c882.png 0 0 DougD https://madhedgefundtrader.com/wp-content/uploads/2019/05/cropped-mad-hedge-logo-transparent-192x192_f9578834168ba24df3eb53916a12c882.png DougD2012-08-20 23:03:132012-08-20 23:03:13Watch Out for the Coming Risk Reversal
DougD

This Party is About to End

Newsletter

They are really rocking the market today, with the Dow up nearly 200 points off the back of a non-disastrous Chinese GDP growth figure of 7.7%. However, there is a serious disconnect going on in our markets which suggests to me that our own party may be about to end.

Yesterday?s blockbuster weekly jobless claim took applications for unemployment benefits down to a four-year low of 350,000. But if you ignore this, you have an unending series of data reports that shows an economy clearly decelerating to a growth rate of 1% per annum or less. That is one-seventh China?s rate.

And yet, you have an S&P 500 with a top end range that is a mere 3% within the high for the year. You don?t need a PhD in math from MIT to understand that rising stock prices and falling growth are an anomaly that can?t last and can only end in tears.

I think this is happening for a couple of reasons. Many traders are awaiting Q2, 2012 earnings reports and are willing to give companies the benefit of the doubt until they are out. Stocks are at the historic low end of valuation ranges. Many institutions are still underweight, and willing to use dips to pick up some bargains. This is why this summer has been a short seller?s nightmare, volatility has fallen through the floor, and many hedge funds have bailed for the duration.

I also think that many institutions are waiting for the Federal Reserve to announce QE III at their end of July meeting, thus powering the market to new yearly highs. I?m betting that they will be sorely disappointed. Ben Bernanke has so few bullets left to protect the economy that he will wait until the Indians are circling the wagons and unleashing a barrage of arrows, before he takes action. Quantitative easing is meant to be a safety net, not a stepladder from which to boost ever-higher asset prices. The Fed?s failure to deliver could give us the trigger we need to break to new lows in August.

Take a look at the charts below to see how clearly defined the recent channels and ranges are. Next time the SPX approaches 1,370, I might think about going short, taking out some downside insurance, selling out of the money calls, and generally getting yourself into a risk off posture. If you don?t, your summer could turn into a giant rainstorm.


This Party is Nearly Over


https://madhedgefundtrader.com/wp-content/uploads/2019/05/cropped-mad-hedge-logo-transparent-192x192_f9578834168ba24df3eb53916a12c882.png 0 0 DougD https://madhedgefundtrader.com/wp-content/uploads/2019/05/cropped-mad-hedge-logo-transparent-192x192_f9578834168ba24df3eb53916a12c882.png DougD2012-07-16 23:04:502012-07-16 23:04:50This Party is About to End
DougD

Another Alarm Bell

Newsletter

I am a numbers guy. Show me the data and I?ll draw my own conclusions, ignoring conflicted brokerage research, the paid talking heads on TV, and all the politically motivated garbage pumped out by industry sponsored fake research institutes. I am also a glass half full kind of guy, willing to make a positive interpretation when all else is equal. After all, over the very long term, everything goes up in value.

Having said all of that, I have to tell you that the economic data flow has recently been rolling over like the Bismarck. In January and February it was uniformly positive. In March, it turned decidedly mixed. Since the beginning of April they have turned overwhelmingly negative. This is what tops in both the economy and the stock market are made of.

I normally don?t bother you with such details, as most readers prefer me to distill my comments down to ?BUY? or ?SELL?. But the deterioration has been so dramatic in recent weeks that I thought you should see what I am looking at. Let me give you this week?s sampling:

April 19? March existing homes sales -2.6%
April 19? Philly Fed down from 12.5 in March to 8.5 in April
April 19? Leading economic indicators down from +0.7% in February to +0.3% in March.
April 19? Weekly jobless claims down 2,000, but held most of last week?s 13,000????? .?????????????? spike upward
April 17? New permits for Single Family homes -3.5% in March
April 17? Housing starts down from 2.8% in February to -5.3% in March
April 16? February business inventories +0.6% because people aren?t buying stuff.
April 16? Empire state down from 22 in March to 6.6 in April
April 16? March Consumer Price Index 0.3%, but most of the increase was for?????? gasoline.

Any one of these data points is relatively unimportant. When they are all moving in the same direction, that is important. And this has been going on for more than a month now. When preparing my last two biweekly strategy webinars I had difficulty finding any positive data points to report. The only plus figure that I have seen recently was the International Monetary Fund?s upgrade of its outlook for the global economy for 2012 from 3.3% to 3.5% which no one pays attention to anyway.

There is a big problem for the stock bulls in all of this. We have a stock market that is priced for perfection, having taken earnings multiples up from 11 to 14 in six months. As a result, we now have a market that is priced for 4% GDP growth in a 2% GDP economy. But guess what? The 2% GDP is coming through. Instead of perfection we are getting mediocrity. Look out below.

I am not a permabear, but I know plenty of people who are. Maybe it is time for me to start paying them more attention, reading their research, answering their e-mails.


Maybe I Should Start Returning His Calls

https://www.madhedgefundtrader.com/wp-content/uploads/2012/04/Angry-Grizzly-Bear.jpg 399 266 DougD https://madhedgefundtrader.com/wp-content/uploads/2019/05/cropped-mad-hedge-logo-transparent-192x192_f9578834168ba24df3eb53916a12c882.png DougD2012-04-19 23:03:592012-04-19 23:03:59Another Alarm Bell

tastytrade, Inc. (“tastytrade”) has entered into a Marketing Agreement with Mad Hedge Fund Trader (“Marketing Agent”) whereby tastytrade pays compensation to Marketing Agent to recommend tastytrade’s brokerage services. The existence of this Marketing Agreement should not be deemed as an endorsement or recommendation of Marketing Agent by tastytrade and/or any of its affiliated companies. Neither tastytrade nor any of its affiliated companies is responsible for the privacy practices of Marketing Agent or this website. tastytrade does not warrant the accuracy or content of the products or services offered by Marketing Agent or this website. Marketing Agent is independent and is not an affiliate of tastytrade. 

Legal Disclaimer

There is a very high degree of risk involved in trading. Past results are not indicative of future returns. MadHedgeFundTrader.com and all individuals affiliated with this site assume no responsibilities for your trading and investment results. The indicators, strategies, columns, articles and all other features are for educational purposes only and should not be construed as investment advice. Information for futures trading observations are obtained from sources believed to be reliable, but we do not warrant its completeness or accuracy, or warrant any results from the use of the information. Your use of the trading observations is entirely at your own risk and it is your sole responsibility to evaluate the accuracy, completeness and usefulness of the information. You must assess the risk of any trade with your broker and make your own independent decisions regarding any securities mentioned herein. Affiliates of MadHedgeFundTrader.com may have a position or effect transactions in the securities described herein (or options thereon) and/or otherwise employ trading strategies that may be consistent or inconsistent with the provided strategies.

Copyright © 2025. Mad Hedge Fund Trader. All Rights Reserved. support@madhedgefundtrader.com
  • Privacy Policy
  • Disclaimer
  • FAQ
Scroll to top