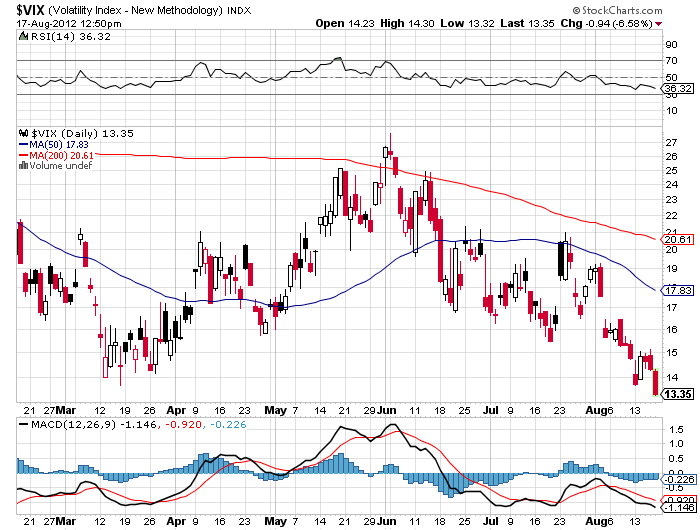
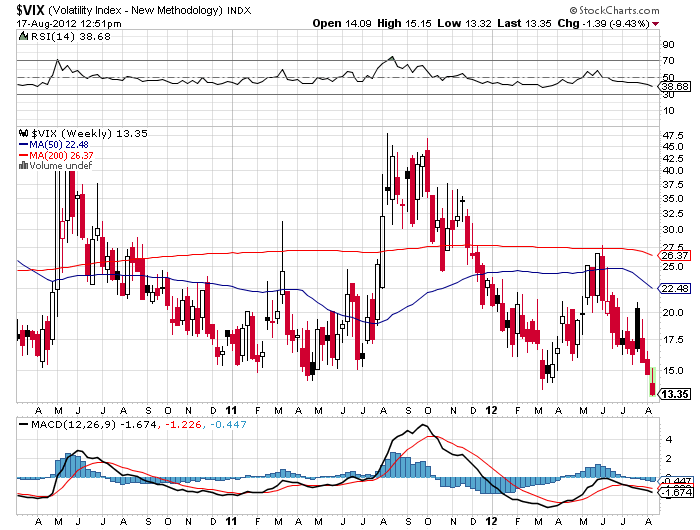
Mr. Market sometimes speaks in mysterious tongues, and you really have to wonder what he is struggling to tell us by taking the Volatility Index (VIX) down to a subterranean $13 handle on Friday, a new five year low.
A number of advisors have been recommending that investors load up on the (VIX) in recent months to give them downside protection from an imminent market crash. Those who followed such advice were hammered, their clients no doubt striking them off invitation lists for summer barbeques.
In the past month, the (VIX) has cratered from $20 to $13. Just last October, it touched $49, when I urged readers to pile in on the short side. I came out in the mid-$30?s weeks later.
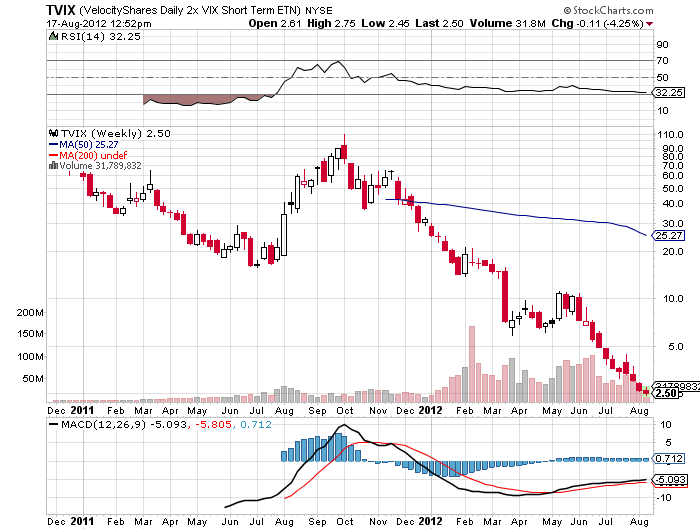
Those who traded the triple leveraged (TVIX) fared even worse, this blighted ETF plunging from $5 to $2.50 during the same period. The (TVIX) is doing the best impression of an ETF going to zero that I know of. A year ago it was trading at $110. This is why I plead with traders to avoid triple leveraged ETF?s like the plague. These things are designed for day trading by hedge funds only. Eventually, they all go to zero.
I am even seeing this in my own portfolio. A week ago, I sold short the September, 2012 (SPY) $147 calls at $0.38. A week later, the (SPY) has risen by 1.2% but the call options have done a swan dive to $0.34. This can only happen when they are crushing volatility.
I quit recommending (VIX) plays in March when I realized that there is some sort of arbitrage going on in the hedge fund community that is punishing (VIX) owners. I haven?t figured out the exact mathematical dynamics yet, but it has to involve selling short the cash stocks and shorting (VIX) contracts against them. Whatever they lose on the cash short is more than made up by the profits on their (VIX) short.
It?s easy to see how successful this would be. While August (VIX) traded at a lowly 13.40%, September volatility is still up at 18%, and January, 2013 is trading at a positively nosebleed 25%. That spread provides a lot of room to take in some serious money.
So what is the 13% really trying to tell us? Here are some thoughts:
*It is discounting multiple tranches of quantitative easing by central banks around the world that take all asset prices up for the rest of the year.
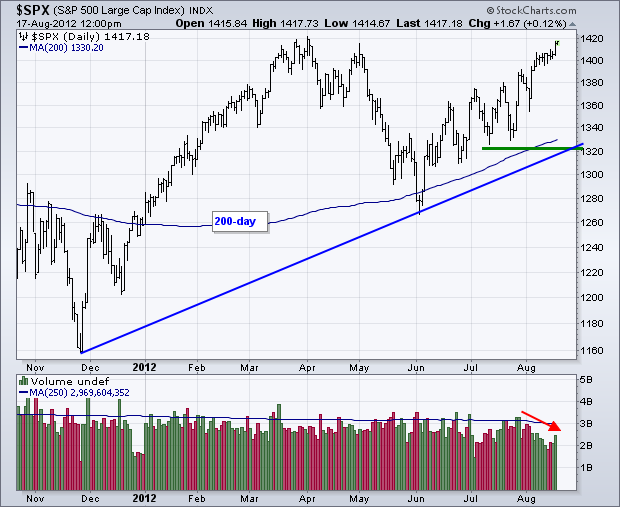
*It reflects the complete abandonment of the stock market by the individual investor, which is why trading volume has collapsed.
*It also indicates how exchange traded funds are taking over, sucking volume out of the stock market. The (VIX) doesn?t reflect activity in ETF?s.
*It could be discounting an Obama win in the presidential election. Stocks have delivered a 72% return since the Obama inauguration, the third best in history after Franklin Roosevelt and Bill Clinton. Mixed stock and bond portfolios have delivered the best returns on record, with both asset classes appreciating dramatically for 3 ? years, something that never happens.
It could be that the (VIX) at this level has it all wrong, and that a stock market selloff is about to send it soaring. Those who have rigidly held on to that belief until now have been severely tested.
For those who have fortunately avoided the (VIX) trade so far, let me give you a quick primer. The CBOE Volatility Index (VIX) is a measure of the implied volatility of the S&P 500 stock index. You may know of this from the talking heads on TV, beginners, and newbies who call this the ?Fear Index?.
For those of you who have a PhD in higher mathematics from MIT, the (VIX) is simply a weighted blend of prices for a range of options on the S&P 500 index. The formula uses a kernel-smoothed estimator that takes as inputs the current market prices for all out-of-the-money calls and puts for the front month and second month expirations.

Ready to Take the Plunge on Volatility?