Maybe it's the calming influence of the sound of North Atlantic waves crashing against the hull outside my cabin door for a week. Maybe it was the absence of an Internet connection for seven days, which unplugged me from the 24/7 onslaught of confusing noise.
But suddenly, the outlook for financial markets for the rest of 2018 has suddenly become crystal clear.
I'll give you the one-liner: Nothing has changed.
Some nine years and four months into this bull market, and the sole consideration in share pricing is earnings. Everything else is a waste of time. That includes the Greece crisis, the European debt crisis that drove MF Global under, two presidential elections, the recent trade wars, even the daily disasters coming out of the White House.
Keep your eye focused on earnings and everything else will fade away into irrelevance. It that's simple.
As I predicted, the markets are stair-stepping their way northward ahead of each round of quarterly earnings reports.
And now that we know what to look at, the future looks pretty good.
The earnings story, led by big tech, is alive and well. After a torrid Q1, which saw corporate earnings grow by a heart palpitating 26%, we are looking for a robust 20% for Q2, 23% in Q3, and another 20% in Q4.
The sushi hits the fan when Q1 2019 earnings grow by a mere 5% YOY as the major elixir of tax cuts wear off, leaving us all with giant hangovers.
Amazon (AMZN), Netflix (NFLX), and Microsoft (MSFT), all Mad Hedge recommendations over the past year, account for 70% of the total market gains this year.
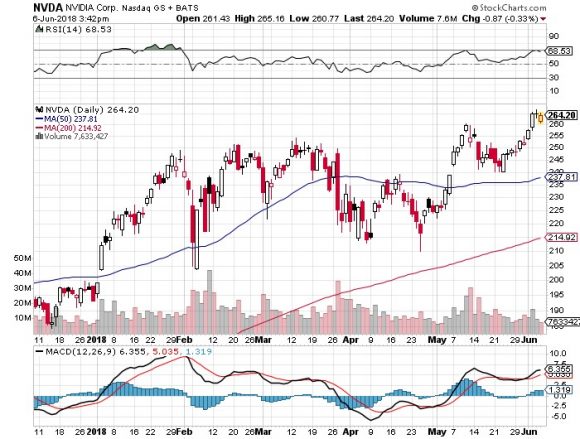
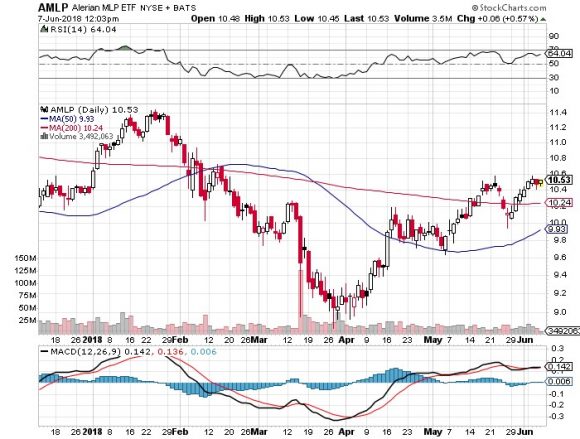
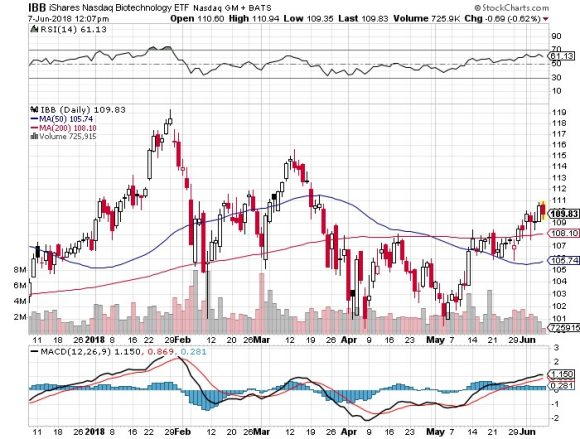
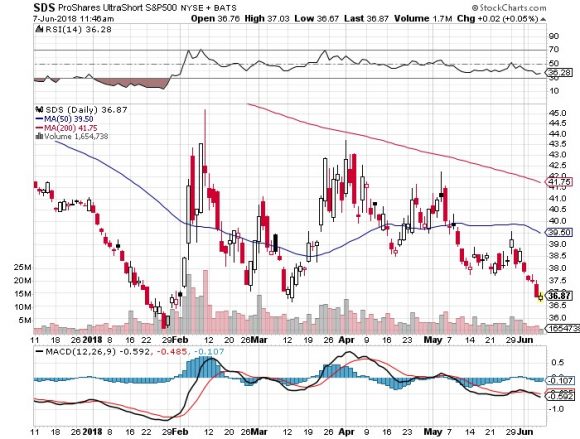
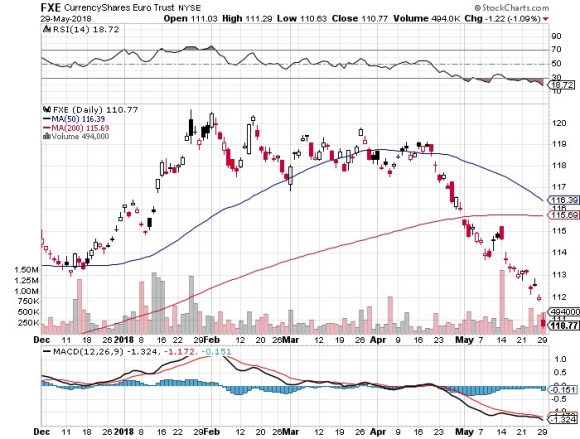
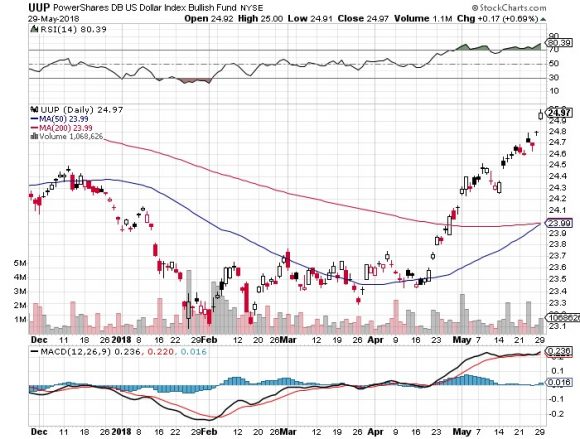
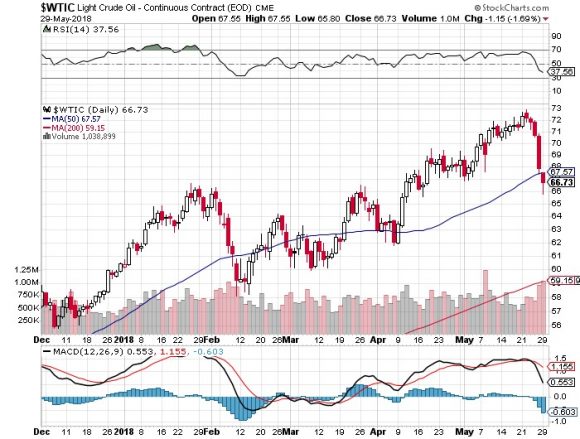
Look at the table below and you see there has only been ONE trade this year and that has been to buy technology stocks. Everything else, such as oil, the S&P 500 (SPY), the U.S. dollar (UUP) has been an also-ran, or an absolute disaster. And we nailed it. Some 80% of our Trade Alerts this year have been to buy technology stocks.
The gasoline poured on the fire by the huge corporate tax cuts are only now being felt by the real economy. Q2 GDP growth could run as hot as 4%. But there is a sneaking suspicion in the hedge fund industry that these represent peak earnings for the entire economic cycle.
Corporate stock buybacks hit a new all-time high in Q2, as companies repatriate cash hoards from abroad at extremely preferential tax rates to buy back their own shares.
Trade wars are certainly a worry. But retaliation is directed only at Trump supporting red states, which accounts for only a tiny share of U.S. corporate profits. Technology stocks, which account for half of all American profits, have largely been immune, except for the chip sector (MU), (LRCX), which has its own cyclical problems.
Yes, we know this will all end in tears. The yield curve will invert in a year, taking short-term interest rates higher than long-term ones, triggering a recession and a bear market. But the final year of a bull market is often the most profitable as prices go ballistic. You would be a fool to stay scared out of stocks by headline risk and an uncertain Twitter feed.
Yes, early leading indicators of a coming recession are popping up everywhere now. A stunning 12.3% drop in June Housing Starts has to be at the top of anyone's worry list, as rising home mortgage rates and disappearing tax deductions take their pound of flesh. It was the worst report in nine months.
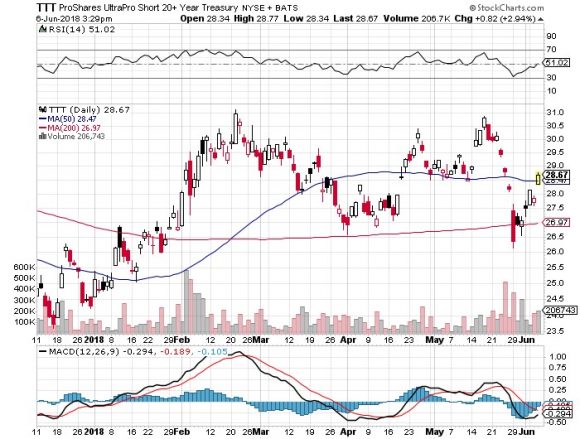
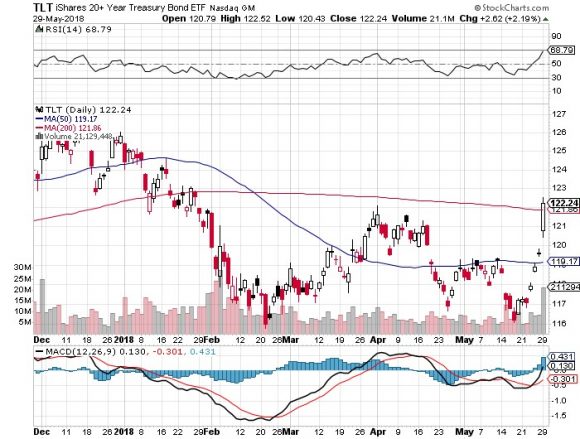
The trade wars promise to leave the Detroit auto industry in substantially reduced form, or at least, the stock market believes so. And a 10-year U.S. treasury bond yield that has been absolutely nailed in a 2.80% to 2.90% range for three months is another classic marketing topping indicator.
I'll let you know when it is time to pull up stakes and head for higher ground. Just keep reading the Diary of a Mad Hedge Fund Trader.
As I have been at sea and out of the markets, my 2018 year-to-date performance remains unchanged at an eye-popping 24.82%, and my 8 1/2-year return sits at 301.29%. The Averaged Annualized Return stands at 35.10%. The more narrowly focused Mad Hedge Technology Fund Trade Alert performance is annualizing now at an impressive 38.69%.
This coming week will be a very boring week on the data front.
On Monday, July 23, there will be nothing of note to report.
On Tuesday, July 24 at 8:30 AM EST, the May Consumer Price Index is released, the most important indicator of inflation.
On Wednesday, July 25 at 7:00 AM, the MBA Mortgage Applications come out. At 2:00 PM EST the Fed is expected to raise interest rates by 25 basis points. At 2:30 Fed governor Jerome Powell holds a press conference.
Thursday, July 26, leads with the Weekly Jobless Claims at 8:30 AM EST, which saw a fall of 13,000 last week to 222,000. Also announced are May Retail Sales.
On Friday, July 27 at 9:15 AM EST we get May Industrial Production. Then the Baker Hughes Rig Count is announced at 1:00 PM EST.
As for me, I am going to attempt to think of more great thoughts this afternoon while hiking up to the Hornli Hut at 11,000 feet on the edge of the Matterhorn, a climb of about 5,000 feet out the front door of my chalet. I always seem to think of my best ideas while hiking uphill. The liter of Cardinal beer and a full plate of bratwurst with rosti potatoes will make it all worth it.
Good luck and good trading.


0