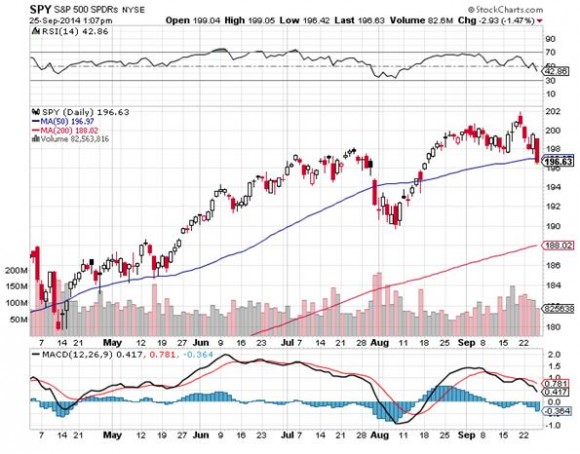
Well, so much for the 200 day moving average! It?s like that girlfriend who has been ferociously loyal for the last year, and suddenly she is busy every weekend and never returns phone calls.
Not that this ever happens to me. Ahem.
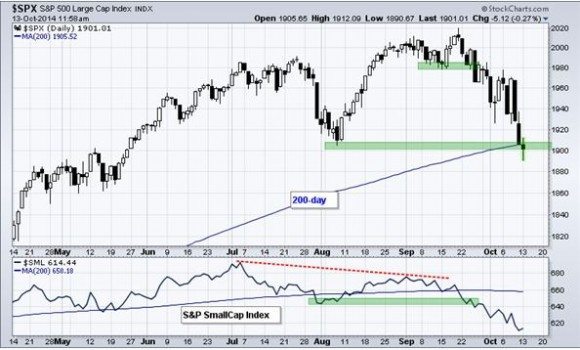
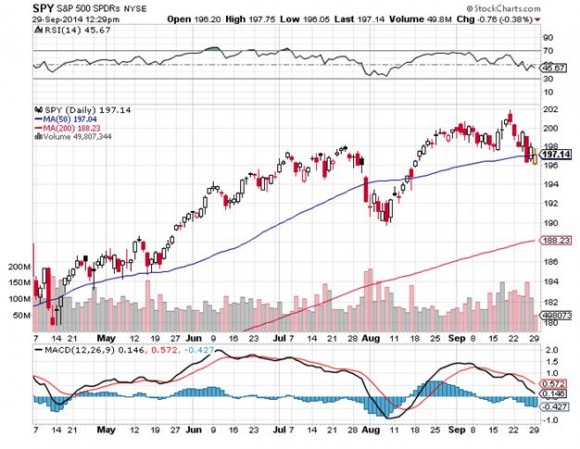
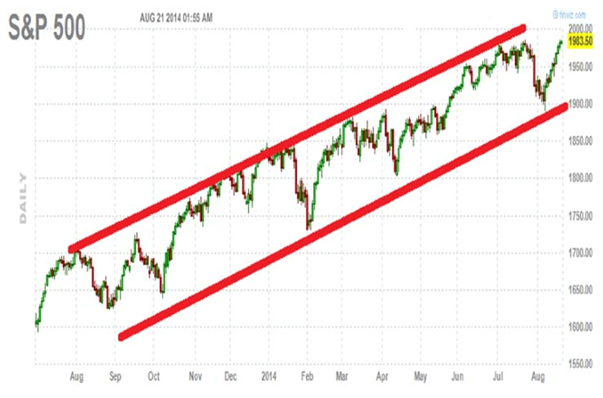
I knew there would be trouble when the perma bulls on TV told me the market would bounce hard off this inviolable line in the sand, with the (SPX) at 1,905. I cut my bullish equity positions by two thirds on the first market rally and never looked back.
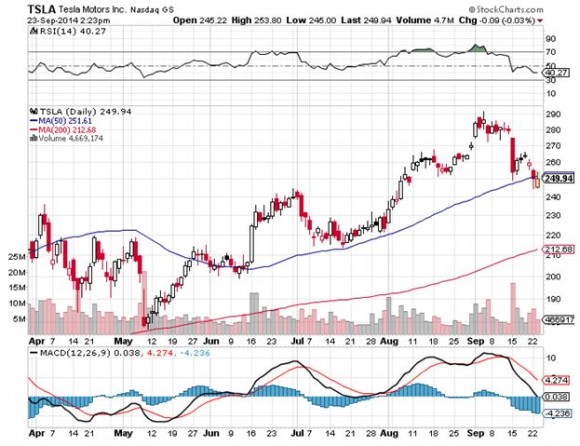
For proof that you still make beginner mistakes after 45 years in the business, take a look at how I handled my Tesla (TSLA) position last week. Elon Musk teased us all with his ?D? tweet two weeks ago, and the stock levitated magically while all other momentum stocks were being mercilessly thrown overboard.
?Women and traders? first comes to mind.
Did I sell into the rumor and capture the 80 basis point profit I had in hand? Nope. I held on until yesterday morning and bailed after a $40 plunge in the stock, taking a 1.62% hit.
This happened while the rest of Texas was coming down with Ebola Virus. I fall victim to the bout of over confidence whenever my Trade Alert success rate exceeds 90%, as it recently has done. I start to believe my own research, always a fatal flaw.
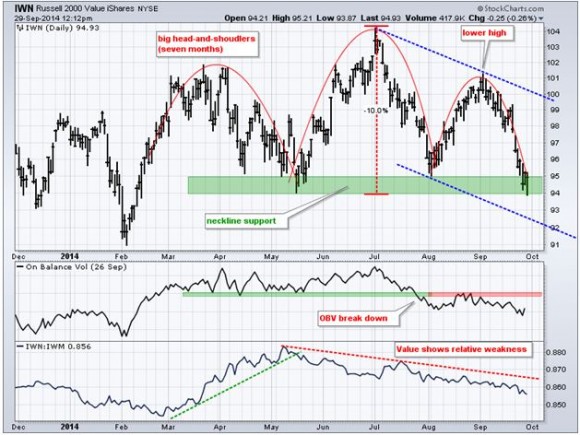
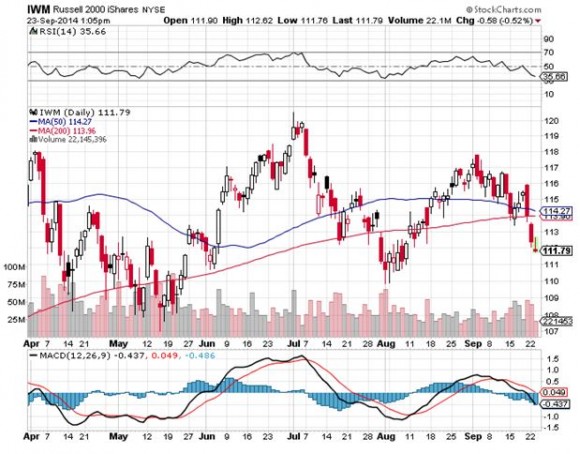
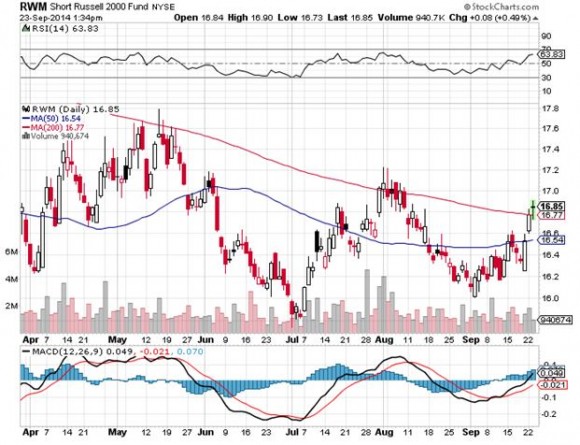
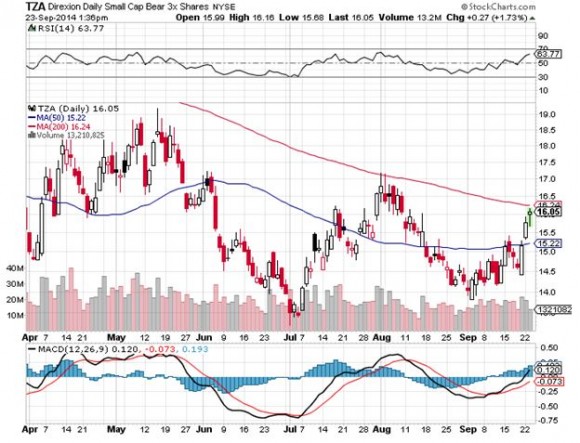
Fortunately, I?m still running double shorts in the S&P 500 (SPY) and the Russell 2000 (IWM) to hedge these losses. The ?Hedge? in ?Mad Hedge Fund Trader? is a well-earned one, I assure you.
You would think I would get hate mail for making such a stupid mistake. Au contraire! Readers thanked me for pulling the plug so quickly and with all humility. It appears that when most other newsletters put out a bad call they develop a sudden case of amnesia, leaving their customers to thrash about in bloody, shark-invested waters on their own.
Not here!
So, should we be burning up the Internet trunk lines with frenzied clicks to unload our long-term stock portfolios?
I think not. Here are ten reasons why I believe the bull market in shares is still alive and well:
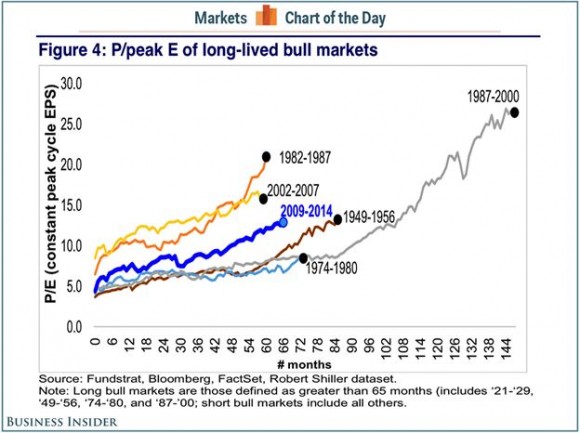
1) Stocks are selling at only 14 X 2015 earnings, in the middle of the historic range.
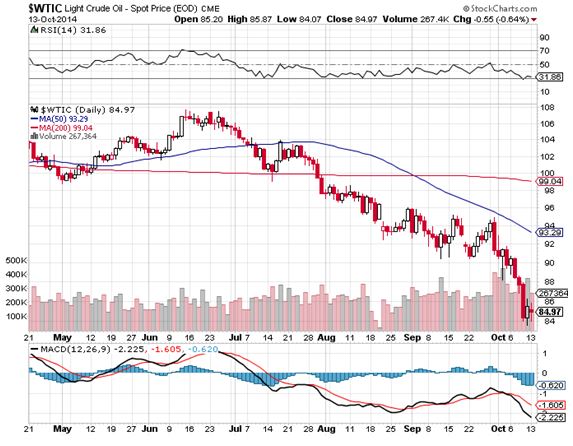
2) The $23 plunge in oil prices we have enjoyed over the last five months amounts to a gigantic tax cut for the world economy, and could add a full 1% to US GDP growth, which has essentially come out of nowhere. Saudi Arabia told us today that this could go on for another year. Remember, it is our oil that is crushing prices.
3) The Christmas selling seasons is setting up to be a strong one, thanks to a friendly calendar and renewed consumer confidence. This is why retailers and credit card companies like American Express (AXP) have been reviving.
4) The November 4 midterm elections are still a big unknown for the market to discount. The next day could signal the beginning of the yearend bull market.
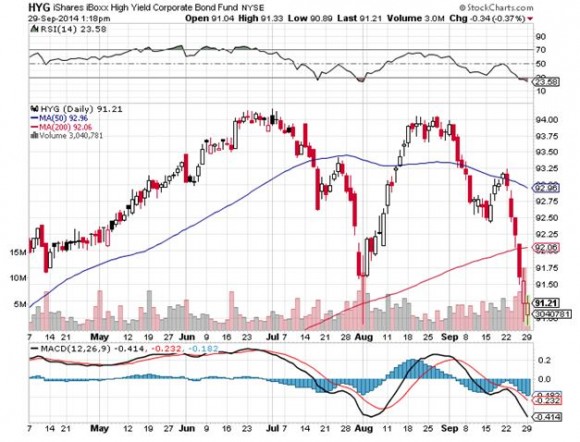
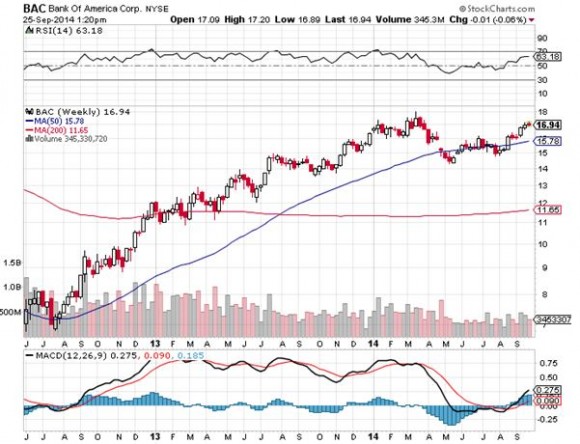
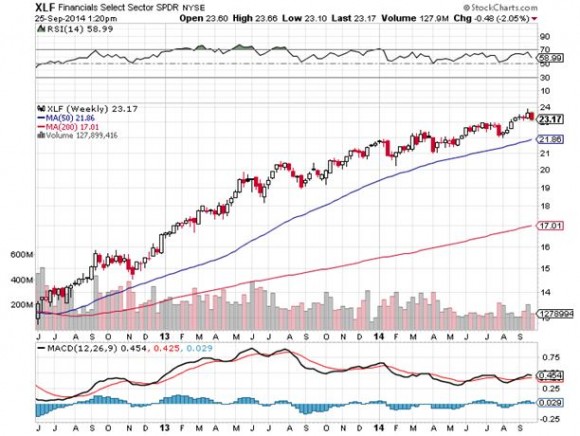
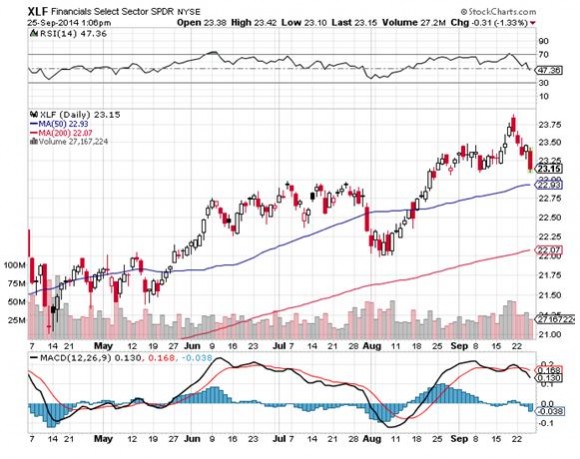
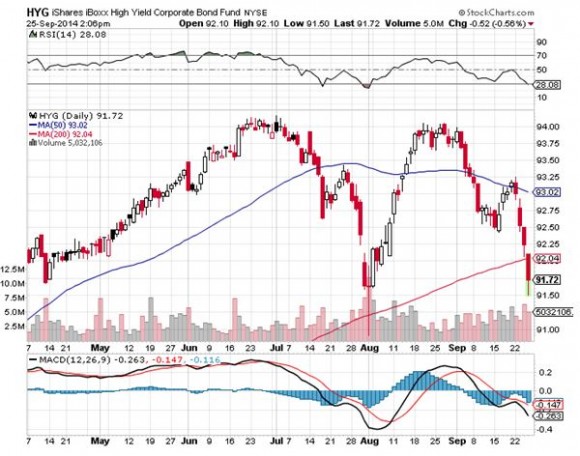
5) I think we are seeing the final blow off top in the bond market. A reversal would be very stock friendly, especially for financials (BAC).
6) Mergers and acquisitions are continuing at a torrid pace. This is happening because companies see each other as cheap, not expensive, and usually happens at market bottoms.
7) Those who aren?t merging are buying their own stock back with both hands, like Apple, at a staggering $400 billion annualized rate.
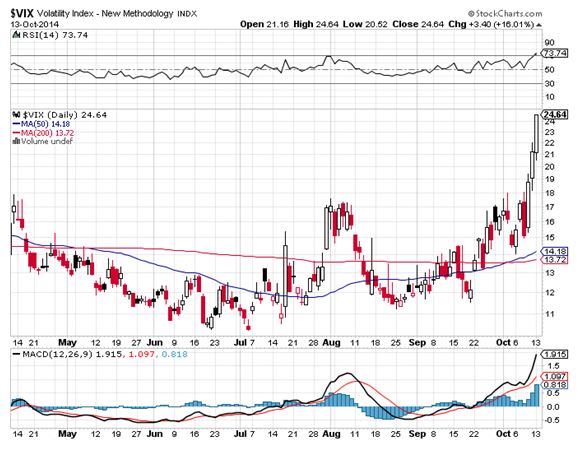
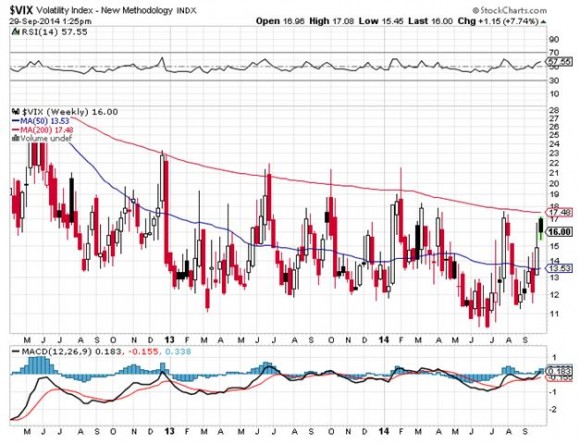
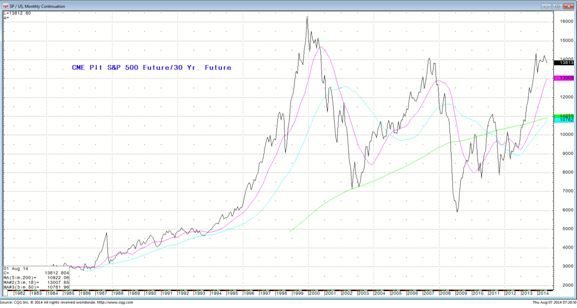
8) Volatility spikes (VIX) also signal market bottoms (see chart below). We are nearing another top with the closely followed indicator closing at $24.64 today, a high for the past two years.
9) Capital spending is accelerating, not only in technology, but across most other industries as well. This is why the IMF boosted its growth forecast for America next year to 3.8%, and that is probably a low number.
10) Ever heard of ?Sell in May and Go Away?? Well, ?Buy in November and stay put? is also true. That is only weeks away. October is usually the worst month of the year to sell and is not the path to untold riches.
The big question now is how much additional pain we have to suffer before the promised turnaround occurs.
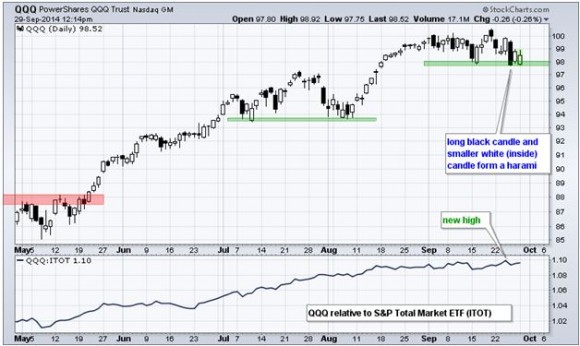
My colleague, Mad Day Trader Jim Parker, went over his screens with a fine tooth comb and came up with $1,846 and $1,810 for the (SPX). Similarly, NASDAQ could trade down to the $3,700-$3,800 range.
My personal favorite is on the calendar, the Midterm elections on November 4. Whatever the outcome, we could see an upside explosion that lasts for six months, once thus unknown disappears. Not only could this make your year in 2014, but 2015 as well.
And I already know who is going to win! It is gridlock, whether the Democrats control one House of congress, or none!