• support@madhedgefundtrader.com
  • Member Login
Mad Hedge Fund Trader
  • Home
  • About
  • Store
  • Luncheons
  • Testimonials
  • Contact Us
  • Click to open the search input field Click to open the search input field Search
  • Menu Menu

Tag Archive for: (TLT)

Mad Hedge Fund Trader

The 60-40 Correction

Newsletter

Traders have been tearing their hair out this year, if they have any left.

The indecisive, flip flopping, ?RISK ON?/?RISK OFF? state of play has been devoid of any direction clues for the past three months. Gold (GLD), the yen (FXY), and bonds (TLT) have been even worse, flat lining inside of narrow ranges.

Hedge fund P & L?s have been hemorrhaging everywhere. The brokers are doing not much better, with some big ones reporting profits down by 50% or more. For many, it is shaping up to be the worst year of the decade.

I have to confess that I have not seen conditions like this during my own long and varied career. I can make money in up markets, and in down markets. But I am helpless in that go nowhere, with option implied volatilities at all time lows.

Better to go take a long nap.

Bulls hate the market because it won?t go up, and bears despise it because it fails to fall. So, what gives?

A page out of the Investing 101 handbook might explain everything.

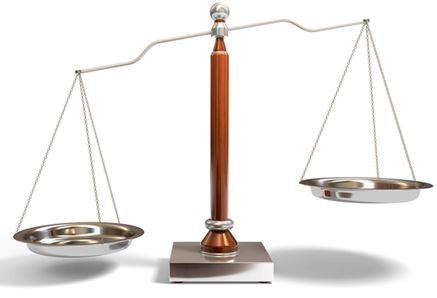
For eons now, possibly for entire epochs, investment advisors have recommended that their clients place 60% of their liquid assets in stocks, and the remaining 40% in bonds. When extreme market moves knock portfolios out of this cherished balance, they should buy and sell securities to bring it back in line.

And therein lies the problem.

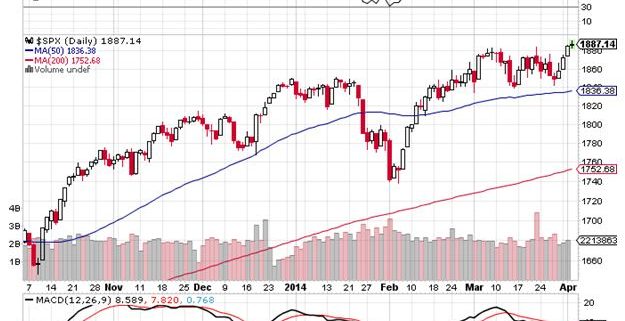
2013 delivered one of the most spectacular stock performances in history, with the S&P 500 up 26%, and 29% when you include dividends. Bonds fell, the (TLT) plunging from $114 to $101, taking the ten-year Treasury yield up from 1.80% to 3.02%. Those who started last year with a traditional belt and suspenders 60%-40% balance ended up 2013 with a portfolio closer to 70%-30%.

So what have investors been doing since the beginning of 2014? Selling stocks and buying bonds to return their desired 60%-40% balance.

This all sounds nice in theory. How much money are we talking about to achieve this rebalancing? A lot. A whole lot. I?d say about $600 billion.

The markets certainly believe in this theory. Bonds have been the most ardent followers, going up since the first trading day of the year. It has posted this blowout return despite the Fed throttling back its monthly bond buying by a massive $40 billion a month since the end of last year.

Stocks are more skeptical, befuddled by the random noise of earnings reports, geopolitical events, ultra low interest rates, and the residual effects of the Fed?s quantitative easing.

Selling was largely confined to the sectors that had risen the most, technology (QQQ), small caps (IWM) and biotechnology (IBB). So instead of a move down in any appreciable way, stocks have given us monotonous sideways action.

How does all this end?

Get everyone?s portfolio back to 60%-40% and the way then becomes clear to fall out of balance again. How will this be resolved? Stocks will gain and bonds will take a nosedive, until we approach the 70%-30% ratio again.

This paves the way for a blowout fourth quarter in the stock market that I have been predicting all year. That should take the (SPX) to 2,100, or up about 10% on the year. What will take the lead? Technology (QQQ), small caps (IWM), and biotechnology (IBB), the sectors that were hit the hardest earlier in the year.

This is why I started piling on risk positions last week, buying Apple (AAPL) and Google (GOOGL), and selling short Treasury bonds (TLT) and the Japanese yen (FXY).

SPY 12-31-13

TLT 12-31-13

RSP 5-27-14

ScaleSo Which Balance is the Right One?

https://www.madhedgefundtrader.com/wp-content/uploads/2014/05/Scale.jpg 298 437 Mad Hedge Fund Trader https://madhedgefundtrader.com/wp-content/uploads/2019/05/cropped-mad-hedge-logo-transparent-192x192_f9578834168ba24df3eb53916a12c882.png Mad Hedge Fund Trader2014-05-28 01:04:312014-05-28 01:04:31The 60-40 Correction
Mad Hedge Fund Trader

Beware the ?Spinning Tops?

Newsletter

Winter is definitely over here in Incline Village, Nevada. When I started my daily ten-mile hikes from the Tunnel Creek Caf? ten days ago, I had to don snowshoes in the parking lot. Yesterday, I had to climb for two hours to find snow at 8,000 feet.

It?s definitely time to put my winter equipment into storage. The aspen trees are budding and yellow crocuses are breaking out all over.

That was also the conclusion of the killer April nonfarm payroll report, which brought in an eye popping 288,000. March was revised up from 192,000 to 203,000. Even more stunning was the plunge in the headline unemployment rate from 6.7% to 6.3%. It was a perfect number. Almost. We?re almost back to normal again.

I thought we were home free on our iShares Barclay 20+ Year Treasury Bond Fund (TLT) May, 2014 $113-$116 in-the-money bear put spread.
The blockbuster release should have driven a stake through the heard of the bond market.

And fall it did?.for about 15 minutes. Then news of the White House press conference announcing a further ratcheting up of tensions with Russia over the Ukraine triggered one of those rip your face off short covering rallies that have become so common this year. Prices for the (TLT) jumped to new 2014 highs, just short of our near short strike at $113. Stocks sagged.

If you had a mole at the Department of Labor who leaked to you the April nonfarm payroll a day in advance, you would have loaded the boat with long stock/short bond positions. Instead, we got the opposite. Welcome to a trader?s dull, brutish, and short life in 2014.

Throw bad news on the market, and if it fails to go down, you buy the heck out of it. That is a valuable lesson that I have learned over the decades, and I think it applied to the Treasury (TLT) bond market on Friday.

This was not weekend I wanted to go into short of bonds so close to the money. Putin is on a roll and appears to be willing to toss the dice once again. Now, he?s calling for a United Nations Security Council Meeting. Better to talk than shoot, I always say. It?s cheaper. I?ve tried both, and definitely prefer the latter.

If there has been another valuable lesson this year, it has been to keep positions small, and stop out of losers fast. So, as much as I hate to, I pulled the ripcord on my short, taking another nick on my performance this year.

?Markets can remain irrational longer than you can remain liquid,? said the great economist and primordial hedge fund trader, John Maynard Keynes. So true, so true.

The goal here is to maintain iron discipline in risk control and be the last man still standing when trading conditions improve and markets become easy again later this year. Until then, I?ll be engaging in small, short term opportunistic trades. I?ll also be doing a ton of deep research, building short lists of positions to Hoover up when life gets better.

Mind you, yields at these levels make absolutely no sense. They are predicting that deflation is now a permanent aspect of our lives. (To understand how that might be possible, read my interview in tomorrow?s letter with Google engineering director, Ray Kurzweil). Bonds are also shouting at us that we will remain stuck at a subpar 2% economic growth rate for years to come.

The inverse of bad news is also true. If you shower good news on a stock market and it fails to rise, you sell it. This suggests that a big dump in stocks is imminent, which is long overdue.

The markets certainly think this. Take a look at the chart below showing the ?spinning tops? in the S&P 500 in recent days, where shares trade across a wide range, but remain unchanged on the day. So named because the bar looks like a child?s toy, a spinning top suggests indecision among investors and a possible coming selloff. This is what happened in the beginning of March and April, opening the way for drops of 50 and 85 (SPY) handles.

This means that the ?head and shoulders? scenario I talked about a week ago is still on the table (click here for the article ?Watch Out for the Head and Shoulders?). That?s why I quickly knocked out a (SPY) June $193-$196 put spread.

In the meantime the media deluge for the upcoming midterm elections has already started, which are still five months away. Nevada governor Brian Sandoval is basing his entire campaign on his failed attempt to stop Obamacare in the courts. It is a strategy that will be repeated across the Midwest this year.

It sounds like this will be a good summer to stay out of the country. Sell in May and go away?

SPX 5-1-14

Percent Job Losses

TNX 5-1-14

John Thomas

SnowshoesGoing Into Storage


TopsBeware the Spinning Tops

https://www.madhedgefundtrader.com/wp-content/uploads/2014/05/Tops.jpg 335 430 Mad Hedge Fund Trader https://madhedgefundtrader.com/wp-content/uploads/2019/05/cropped-mad-hedge-logo-transparent-192x192_f9578834168ba24df3eb53916a12c882.png Mad Hedge Fund Trader2014-05-05 08:55:552014-05-05 08:55:55Beware the ?Spinning Tops?
Mad Hedge Fund Trader

Cashing in on My Shorts

Newsletter

Take the easy money and run. No one every got fired for taking a profit. That?s the mood I was in when I came in and saw my long volatility ETF (VXX) spiking and my short in the S&P 500 (SPY) cratering. I sent out Trade Alerts immediately that took my model-trading portfolio into a rare 100% cash position.

The Volatility Index (VIX) is up a breakneck 35% in a week, while the ETF (VXX) has tacked on 11%. You don?t get such heart palpitating moves like this very often, especially when they are all going in your favor.

It helped that Mad Day Trader Jim Parker, rushed the chart below to me right after the opening showing that the NASDAQ 100, the chief whipping boy in this selloff, is becoming severely oversold and fast approaching a major area of support (the lime green line). Bonds (TLT) are stalling at $110.60, and the ?RISK OFF? move in the Japanese yen (FXY) is approaching the upper limit of its 2014 range.

This all adds up to the possibility that another one of those ?rip your face off? short covering rallies could be near.

The rule in this type of market is to take the quick profits. You especially want to date, and not marry, the (VXX), since the contango over time can cost you your shirt.

Trading on the short side is a totally different animal than traditional long side plays. It is much harder work, as shorts behave totally differently than longs. The movie is on fast forward and you must act quickly.

To be up 15.45% so far in 2014, a down year when most investors are tearing their hair out, and up a meteoric 7.89% in April, is nothing less than heroic. Eight out of my last ten Trade Alerts have been profitable. The email plaudits have already started pouring in. Now all your friends at the country club can hate you, but only if you followed my advice.

Let me tell you what I did right this week, so you can take a page from the playbook of the master.

1) I kept the positions small, so I could sleep at night
2) I did the hard trade, selling when everyone else loved this market
3) I took trading profits quickly
4) I ignored the talking heads on TV so I wouldn?t puke out at the bottom
5) I didn?t take the Princess cruise from San Francisco to Los Angeles, where 50 passengers and 25 crew came down with norovirus. Imagine getting sick before your get to Mexico.

Is it possible that I am improving with age? That I?m becoming a better trader as I get older? That the payoff for a 45-year accumulation of market experience keeps increasing? What a concept!

I don?t think this correction is over. Vladimir Putin can drop a bombshell on the markets at any time. We are going into the traditional May-October ?RISK OFF? seasonal with markets still very near all time highs. The midterm elections in November are introducing a new level of uncertainty. The IPO bubble continues unabated (there are seven today!), and will only end in tears.

And who knows when another cruise ship is going to come down with norovirus?

But nothing moves in a straight line. It?s time to move to the sidelines so I can reload on the short side after the next short covering rally exhausts itself.

As for me, I am going to spend the rest of the day writing checks to the US Treasury to pay taxes for myself, the numerous entities I control, and a gaggle of impoverished relatives. All American tax returns are due on Tuesday.

Then I?m going down to Union Square in San Francisco and buy myself a new Brioni pin stripe suit, another pair of Bruno Magli alligator skin shoes, and have a kir royal at the top of the Mark Hopkins Hotel, thankful for my good fortune that I can pay all these bills.

VIX 4-11-14

VXX 4-11-14

SPY 4-11-14

USA 4-11-14

FXY 4-11-14

TLT 4-11-14

Burning Building

https://www.madhedgefundtrader.com/wp-content/uploads/2014/04/Burning-Building-e1430840521423.jpg 308 400 Mad Hedge Fund Trader https://madhedgefundtrader.com/wp-content/uploads/2019/05/cropped-mad-hedge-logo-transparent-192x192_f9578834168ba24df3eb53916a12c882.png Mad Hedge Fund Trader2014-04-14 01:05:442014-04-14 01:05:44Cashing in on My Shorts
Mad Hedge Fund Trader

Mad Day Trader Jim Parker?s Q2 Views

Newsletter

Mad Day Trader Jim Parker is expecting the second quarter of 2014 to be an uneventful, low volume, range trading affair. There is insufficient momentum in the major indexes to substantially break out of the ranges established in Q1.

He does see a modest upward bias to the market. But it is going to have to fight for every point. Sector leadership will change daily, with a brutal rotation. The market is still paying the price of having pulled forward too much performance into 2013.

Jim is a 40-year veteran of the financial markets and has long made a living as an independent trader in the pits at the Chicago Mercantile Exchange. He has worked his way up from a junior floor runner to advisor to some of the world?s largest hedge funds. We are lucky to have him on our team and gain access to his experience, knowledge, and expertise.

Jim uses a dozen proprietary short-term technical and momentum indicators to generate buy and sell signals. Below are his specific views for the new quarter according to each asset class with specific pivot points.

Stocks ? It will be a ?RISK ON? quarter for equities, but not by much. Stocks are still digesting the meteoric gains of 2013. A solid close in the S&P 500 (SPX) over 1,895 will take us right to 1,950. A failure brings us back to 1,800 quickly. Far more important is the NASDAQ, which has been the lead index for some time now. A convincing break of 3,700 will take us to the old high at 4,800. Old, big tech (XLK) will provide the leadership.

Bonds ? Are not going anywhere and Jim is a better seller of rallies. The 30-year futures contract is providing the guidance here, and it has been acting particularly poorly. The flattening of the yield curve has been one of the most dramatic in recent memory. If the (TLT) breaks the 50-day moving average at $107, the next stop will be $105. Demolish that, and we plunge to $101, which equates to a 3.05% yield on the ten year Treasury bond.

Foreign Currencies - The big focus of the currency markets now is to be long the British pound (FXB) and short the Japanese yen (FXY). It would be best to buy the cross, but the individual legs should work as well, as I have done in my The Mad Hedge Fund Trader?s model trading portfolio with a short yen position. The Australian dollar (FXA) decisively broke $91.50 to the upside and is now targeting $93. You should buy any pullbacks to $91.50, as long as central bank governor George Stevens keeps his mouth shut. The Euro (FXE) will be a safer sell after this week?s ECB meeting in order to avoid an ambush from president Mario Draghi.

Precious Metals - Gold (GLD) looks terrible and should be avoided at all costs. Gold bugs would be better off finding a long dark cave and hiding. We are dead in the middle of a six-month range and are likely to test the bottom at $1,200 next. Only a major rally would negate this view. As for silver (SLV), it is dead in the water, so don?t bother.

Energy - Oil (USO) looks sickly as well, now that the boost we got from the Crimean crisis is fading. The $92-$107 range continues. Get a good break of $98.50 and it will target $92. Jim is a better seller of Texas tea than a buyer. Jim also wants to sell the next decent rally in natural gas (UNG) going into the summer, looking for surging fracking supplies to swamp the market by then.

Ags - Soybeans (SOYB) are definitely the crop of the year, and the ETF could easily tack on another 10% from here. Corn (CORN) got a boost from yesterday?s bullish USDA report and could follow through. Only wheat (WEAT) is looking poorly from a technical perspective, and lacks the global fundamentals to help it.

Volatility - Buy the dips and sell the rips. The current $13 low is attractive, and Jim expects it to trade as high $22 sometime in Q2 if we break resistance at $15.50. A long VIX position also makes a nice hedge for your other ?RISK ON? positions as well.

If you are not already getting Jim?s dynamite Mad Day Trader service, please get yourself the unfair advantage you deserve. Just email Nancy in customer support at support@madhedgefundtrader.com and ask how to upgrade your existing Global Trading Dispatch service for an additional $1,000 a year.

SPX 4-2-14

NDX 4-2-14

TLT 4-2-14

FXB 4-2-14

GOLD 4-1-14

VIX 4-2-14Jim Parker


https://www.madhedgefundtrader.com/wp-content/uploads/2014/04/SPX-4-2-14.jpg 485 625 Mad Hedge Fund Trader https://madhedgefundtrader.com/wp-content/uploads/2019/05/cropped-mad-hedge-logo-transparent-192x192_f9578834168ba24df3eb53916a12c882.png Mad Hedge Fund Trader2014-04-03 01:04:592014-04-03 01:04:59Mad Day Trader Jim Parker?s Q2 Views
Mad Hedge Fund Trader

Charts to Watch For an End to the Crisis

Newsletter

Bad China data?.Russia threatens the Ukraine?.more bad China data?.maneuvers at the Russia-Crimea border. The bull has been punched out with a market that was down every day last week, China and Russia both taking turns thrashing investors, like tag team wrestlers. When will it end?

The canaries in the coal mine will be found in the charts below. This is where you will first hear the all-clear signal, when it is safe to return with an aggressive ?RISK ON? posture.

As always, watch the bond market. If the current rally in the (TLT) fails anywhere short of $110, it?s a sign that traders are fleeing the safety of the Treasury bond market and are happy to return to riskier assets, like equities. That equates to a ten year Treasury bond yield of just over 2.50%. A breakout of prices above this, and yields below suggest that more trouble is coming.

Keep close tabs on the Chinese Yuan (CYB). After an unrelenting five-year appreciation, it started a swan dive two weeks ago. That is when a banking crises in the Middle Kingdom started picking up steam. This prompted currency traders to unload Chinese renminbi for more stable dollars. The collapse of copper mirrors this. New signs of life in the Yuan and copper will hint that trouble there is over for now.

The Japanese yen is another big one to monitor. Most hedge funds borrow yen and sell them to finance long positions around the world. This is why the yen has been perennially week for the past two years. But when they dump these positions and hide under their beds, the reverse happens.

They buy back their yen shorts, pushing it up. That?s why the latest round of jitters has the Japanese currency probing four-month highs. If the yen fails here, it?s because investors are going back into the market for other assets.

Of course, the Russian stock market (RSX) is a no brainer to watch. Thanks to the antics of Vladimir Putin, it is down 28% so far in 2014, making it the world?s worst performing market this year. Invading your neighbors and threatening to incite WWIII is not good for your equities. I doubt he cares, but emerging market investors do.

Gold (GLD) is certainly earning its pay as a flight to safety instrument. It has been flying like a bat out of hell all year and is now testing major resistance. If the barbarous relic suddenly loses its luster, the memo will go out to buy paper assets once more.

Finally, keep the chart for the Volatility Index (VIX) planted on the top of your screen. Recent tops have been around the $21 level, only $3 higher than the current level. When cooler heads prevail, the (VIX) will collapse once again. Puts on the (VXX) are the way to play this move.

The interesting thing about these charts is that they are all moving to the extreme edges of multi month ranges. So we could be one more flush away from the end of this move.

That?s unless Russia really does invade Crimea in force. Then all bets are off.

SPY 3-14-14

TLT 3-14-14

CYB 3-14-14

COPPER 3-13-14

RSX 3-14-14

FXY 3-14-14

VIX 3-14-14

GOLD 3-13-14

Atomic BombThis a Sell Signal

https://www.madhedgefundtrader.com/wp-content/uploads/2014/03/Atomic-Bomb.jpg 334 447 Mad Hedge Fund Trader https://madhedgefundtrader.com/wp-content/uploads/2019/05/cropped-mad-hedge-logo-transparent-192x192_f9578834168ba24df3eb53916a12c882.png Mad Hedge Fund Trader2014-03-17 01:04:512014-03-17 01:04:51Charts to Watch For an End to the Crisis
Mad Hedge Fund Trader

Time to Sell the Treasury Market Short

Newsletter

There is a layup of a trade setting up here in the wake of the escalating crisis in the Ukraine. Since January 2, the Treasury bond market (TLT) has enjoyed a massive 8 point rally, taking the ten year yield from 3.05% to 2.60%.

By shorting Treasury bonds here, you are betting that the yield doesn?t drop below 2.48% by March 21, an eight month low. That is only 13 trading days away.

Given a synchronized global economic recovery and rising US corporate earnings across a broad range of industries, the chances of this are minimal.

To get below this level in yields, you really need an out and out shooting war in the Ukraine, a complete nonstarter. Don?t forget that we have a February nonfarm payroll on Friday, which in recent months have been relentlessly disappointing. Therefore, I expect bonds to go nowhere for the rest of the week.

This is all a warm up for a much bigger trade that I am planning, a 10% weighting in the (TLT) June $108 puts outright, which last traded at $2.75. If the (TLT) returns to the $101 bottom, this could be an easy triple, and one of our biggest trades of the year. But you don?t want to consider this until we go over the top on the (TLT) on the charts, and the downside momentum resumes.

TLT 3-3-14

Vladimir PutinSee You a Division, and Raise You a Division

https://www.madhedgefundtrader.com/wp-content/uploads/2014/03/Vladimir-Putin.jpg 315 473 Mad Hedge Fund Trader https://madhedgefundtrader.com/wp-content/uploads/2019/05/cropped-mad-hedge-logo-transparent-192x192_f9578834168ba24df3eb53916a12c882.png Mad Hedge Fund Trader2014-03-04 01:03:002014-03-04 01:03:00Time to Sell the Treasury Market Short
Mad Hedge Fund Trader

All Asset Class Risk Reversal at Hand

Newsletter

I believe that we are on the verge of seeing major reversals across all asset classes. Get this one right, and you will make a fortune. Screw it up, and you will soon be looking for your next job on Craig?s List.

I understand that there is a desperate need for code writers in the cloud.

As always, I am taking my cue from the bond market. The great anomaly in the financial markets during February was the big divergence between the stock and bond markets.

While it was off to the races for stocks, the S&P 500 rocketing an impressive 7%, bonds didn?t believe it for a nanosecond.

If you had asked any global strategist a month ago where the ten year Treasury yield would be if the (SPX) posted a new all time high at 1,865, to a man they would have said 3.05%. Instead, bonds closed the week at a parsimonious 2.65%.

Something is desperately wrong with this picture.

If it were just bonds blowing a raspberry at this stock rally, I wouldn?t be so concerned. However, both the Euro (FXE) and the Japanese yen (FXY), (YCS) moved from strength to strength. They should be falling in a real bull market for stocks.

Precious metals have also been calling foul. If shares were the new risk free investment, why did gold pop by 9% last month? Better yet, why is silver up a sparkling 18%?

The gold producers have done even better. When Barrick Gold (ABX) soars by 26% in s single month, you?ve got to be worried about the stock market.

So here?s what happens next. With an assist from the Russian takeover of the Ukraine (wasn?t it so polite of them to wait a full week after the Sochi Olympics ended?), bonds take a run at the highs for prices and the low for yields, in the mid 2.50%?s.

This is why Mad Day Trader, Jim Parker, shot out a quick, opportunistic long play in the (TLT) last week. There, they will fail once again, as we are now in the early stages of a multi decade bear market.

This will prompt stocks (SPX) to give up a third to a half of the recent rally, taking it to the bottom of an ascending channel at 1,800 (see below). Volatility (VXX) will spike from the current $12 handle back up to $20. This is why I bought the (SPY) $189 - $192 bear put spread on Thursday, which expires on March 21.

When the bond rally gives up the ghost, shares will resume their 2014 surge. Avoid emerging markets (EEM), because another dump in the bond market knocks the stuffing out of them one more time.

What will the currencies do? This will be the starting gun for great short plays on the yen, which returns to a ten-year bear market, and the Euro, which is just tweaking a three-year high.

In the meantime, the dollar basket ETF (UUP) launches into a multi month rally after putting in a double bottom. I shouldn?t need to draw lurid drawings for you on how to trade this.

As for gold? Sorry in advance to the hard money crowd, the inflationistas, and conspiracy theorists (who cares if Germany wants its gold reserves back from the Federal Reserve?). I think the 2014 rally in the barbarous relic dies a sudden, horrible death, and goes back to retest the $1,200 low one more time, possibly breaking it.

This scenario opens up great entry points across virtually all of the many asset classes that I track. When it?s time to strap on a position, I?ll shoot out Trade Alerts as fast as the speed of electricity permits (186,000 miles per second, or 300 meters per second in Europe).

Yes, I think we will finally get a real 10% correction in stocks going into the summer. But you better be nimble to trade it. My experience tells me that too many of you are selling at market bottoms, not buying.

I just thought you?d like to know.

spy 2-28-14

RSP 2-28-14

TLT 2-28-14

TNX 2-28-14

John Thomas - SnorkelJust Thought You?d Like to Know

https://www.madhedgefundtrader.com/wp-content/uploads/2014/03/John-Thomas-Snorkel.jpg 340 447 Mad Hedge Fund Trader https://madhedgefundtrader.com/wp-content/uploads/2019/05/cropped-mad-hedge-logo-transparent-192x192_f9578834168ba24df3eb53916a12c882.png Mad Hedge Fund Trader2014-03-03 01:05:232014-03-03 01:05:23All Asset Class Risk Reversal at Hand
Mad Hedge Fund Trader

Three Charts That Will Turn the Markets

Newsletter

I wrote at length yesterday about why this is not a new bear market, but a traditional 7%-10% correction instead. Now, I?ll show you three charts that will call the exact turnaround.

The ten-year Treasury bond (TLT), (TBT) is clearly the lead contract. It has, far and away, been the most accurate in anticipating the future direction of all asset classes. Get this one right, and everything else falls into line.

Take a look at the chart for the (TLT) below, which has clearly broken the 200 day moving average. I think that this is a false breakout, and that we are not trading in a new $108-$112 trading range that prevailed last spring. Note that while the 200-day average is busted, the 200-week is still putting up fierce resistance. This may well be the line in the sand that counts.

Next, take a look at the chart for the Japanese yen (FXY), (YCS). This is crucial because the yen is the world?s funding currency, thanks to its zero interest rates. When traders are in ?RISK OFF? MODE, they dump their positions in all asset classes and buy yen to repay their broker loans. This forces the yen to appreciate against the US dollar, something the Japanese government is loathe to seeing. This occurs on a scale of trillions of dollars.

When investors throw caution to the wind and pile back into ?RISK ON? portfolios, the reverse happens. They borrow yen and sell them to finance new positions, sending the yen down. Weakness in the yen is therefore the first place you will see a recovery in global markets.

The yen chart bellows shows that it is taking a run at its 200 day moving average at $97.91. That is only $1.70 up from here, and in line with ?100 to the dollar in the cash market, another important resistance level.

My expectation is that the yen will fail here and return to its longer-term downtrend, bringing a major 6% rally against the greenback to an end. That will send a great flashing green light to traders that the buyers strike is over and that its time to get back to work.

You see a very similar inverse chart with the S&P 500 (SPX). The bottom here also appears to be the 200 day moving average at 1,708, a mere 32 points below today?s low. That is only one bad day away. Watch for a rally from here to trigger simultaneous sell offs in the Treasury bond and yen markets.

You can play this game all day long. A confirming move of a top in interest rates would be a big rally in bank shares, which need higher interest rates to make more money. So keep a laser focus on Bank of America (BAC) and Citigroup (C). At the same time, gold (GLD) will once again get thrown out with the trash, since higher rates punish holders here with a greater opportunity cost.

This all may happen sooner than you think. The Friday January nonfarm payroll neatly sets up a double top in the volatility index at $21. Get a good number, like over 200,000, and see substantial back month revisions up, and volatility will collapse back to the mid teens. Everything else I described above will come to pass.

However, I won?t find out what transpired until Saturday. When the Department of Labor releases the anxiously awaited report, I should be fast asleep in my first class cabin somewhere over French Polynesia on my way to New Zealand. Send me an email on what happens.

TLT 2-4-14 a

TLT 2-4-14 b

FXY 2-4-14

SPX 2-4-14

VIX 2-4-14

Hula GirlsThe Nonfarm What?

https://www.madhedgefundtrader.com/wp-content/uploads/2014/02/Hula-Girls.jpg 269 409 Mad Hedge Fund Trader https://madhedgefundtrader.com/wp-content/uploads/2019/05/cropped-mad-hedge-logo-transparent-192x192_f9578834168ba24df3eb53916a12c882.png Mad Hedge Fund Trader2014-02-05 01:05:332014-02-05 01:05:33Three Charts That Will Turn the Markets
Mad Hedge Fund Trader

Three Corrections for the Price of One

Newsletter

I love this market action. For me, it means that we are setting up ideal entry points for a broad range of asset classes that will deliver another +67% year.

It will set up for you too, if you continue to read this letter.

What the market is in fact doing is giving us three corrections for the price of one. Remember the traditional September swoon that never happened, the worst trading month of the year? How about the forgotten ritual October crash? And the November dip that always precedes the December yearend rally?

Well guess what? After forgetting how to go down for the longest period of time, we are getting all three downturns compressed into a single big one. That will give us a start finish decline of 7.2% in the (SPX) down to 1730, in line with every correction of the past two years (see chart below), and worst case the proverbial 10% textbook correction.

If my assumptions are correct, then in a worst-case scenario we are already 75% through this pullback on a price basis, and 65% on a time basis. Needless to say, selling short stocks here is out of the question. That train left the station at New Years.

After sitting on my hands, shuffling the papers around my desk several times, and going for my umpteenth coffee refill, I finally pulled the trigger on my iShares Barclays 20+ Year Treasury Bond Fund June, 2014 $106 puts trade. It finally entered no brainer territory.

It hit me what had been driving markets this year, but it took a ten-pound sledgehammer to do it.

Bonds have had it absolutely right this year. They took off right out of the gate on January 2 and never looked back.

Stocks on the other hand have been much more confused and disoriented, like an airplane pilot doing aerobatics on Instrument Flight Rules. They initially rose a little bit, right along with bonds, which almost never happens. You knew that wasn?t going to last.

Then they flat lined for two weeks. It took almost a month before traders realized that the punch bowl was gone and it was time to head into ?RISK OFF? mode. The tardy call can be traced to the fact that you calculate your average stock traders? IQ by taking a bond trader?s and then dividing by two.

What all this means is that the bond market has been correctly calling market direction two weeks before the stock market has. This is bound to continue.

There is another factor to consider here. Bond traders have now seen a whopping great eight point rally in a month, taking the yield on the ten year Treasury bond down a massive 45 basis points, from 3.05% to 2.61%. That is just too much profit to sit on.

That is a world ending performance for bonds. Except that Armageddon, it is not. So the pros that got this one right are increasingly going to be sellers on rallies from here on.

Don?t forget that the Federal Reserve will probably continue to knock $10 billion off of its quantitative easing program every six weeks if the economic data continues to come in, as I expect. That could drop its monthly bond purchases from $85 billion a month in December to only $35 billion by June. This is not good for the (TLT). It?s nice to see all of those lunches at the Federal Reserve Bank of San Francisco with the new chairman, Janet Yellen, finally paying off.

If I am wrong on this one, it will be only by a couple of basis points, with the ten year possibly making it to the high 2.50%?s. The global synchronized economic recovery is still on schedule. The economic data and corporate earnings are just too good to see yields drop to 2.50% or lower.

Bull markets don?t die of old age, they die from recessions, and there is absolutely none on the horizon. The weakness in emerging markets is happening because some of their growth is moving back to the US. That is bad for them and great for us. I never liked their food anyway.

Markets also don?t peak at the middle of historic valuation range of 9-22. We are now at 14.5 if the $120/share earnings forecast for 2014 is good.

Profit margins are at all time highs, and rising (see chart below). The heart-rending volatility we have seen so far in 2014 is therefore technical in nature, and not fundamentally driven. It is just a matter of a few days or weeks until the fundamentals reassert themselves, as they always do.

Strip out the drag of government spending, and the private sector is growing at a positively meteoric 5.1% annual rate.

That could happen as early as Friday, when a blockbuster nonfarm payroll is expected to hit. The shocking 84,000 December number reported in January was a weather driven anomaly. Expect this week?s January figure to come in strong, as well as providing big upward revisions to the December report.

Which brings me to the iShares Barclays 20+ Year Treasury Bond Fund June, 2014 $106 put. Only a global synchronized recession would prevent the (TLT) from trading below $103.58, my breakeven point on an expiration basis, over the next five months. Those who can?t buy options can substitute the ProShares Ultra Short 20+ Treasury ETF (TBT) instead.

If the (TLT) makes it back to unchanged on the year at $101 by the June 20 expiration, this position will be up $5,418, or $5.41% for our notional $100,000 portfolio. If it makes it down to $101 sooner, we will make even more money, as there will still put some remaining time value in the put option.

That is up 108% from my initial cost. For that I am willing to take a few basis points of heat for a few days or weeks. It is an ideal buy and hold position, like, for example, you were just about to take a long trip to New Zealand and Australia.

Sounds like a no brainer to me!

Markets Chart of the Day 1-30-14

SPX 1-31-14

TLT 2-3-14

TBT 2-3-14

fat+lady+singsThe Fat Lady is Singing for the Bond Market

0 0 Mad Hedge Fund Trader https://madhedgefundtrader.com/wp-content/uploads/2019/05/cropped-mad-hedge-logo-transparent-192x192_f9578834168ba24df3eb53916a12c882.png Mad Hedge Fund Trader2014-02-04 01:05:212014-02-04 01:05:21Three Corrections for the Price of One
Mad Hedge Fund Trader

A few Thoughts on Trading Strategy

Newsletter

After one of the wildest rides in recent memory, the stock market has ground to a complete halt. So have virtually all other asset classes as well.

You can see this in the activity of my Trade Alert service as well. After sending out Alerts as fast as I could write them for the past three months, some three or four a day, the action has slowed to a snails pace. What gives?

I think that the sudden, universal optimism we saw break out all over in November and December ended up pulling performance out of 2014 back into 2013. Traders were picking up positions not only for the yearend rally, but the January one as well.

As a result, there is nothing for us to do in January. Our New Year asset reallocation rally happened last month. The net result has been one of the most boring starts to a new year in history, with trading confined to tortuous, frustrating low volume ranges.

What have been the best performing assets so far in 2014? Gold (GLD), gold miners (GDX), (ABX), and bonds (TLT), (TBT), the worst performing ones of 2013. Don?t get your hopes up. These are only dead cat bounces prompted by short covering with broader, longer term bear markets.

In the meantime, the stars of last year have become the dogs of this year, like consumer cyclicals and banks. Suddenly, it has become an upside-down world, with the good becoming bad, and the bad good. Don?t expect this to last. It never does.

It gets worse. What if we didn?t pull forward only in January and the end of last year, but February and March as well? We could be sitting back on our haunches for quite a long time. Sounds like a good time to catch up on those old back issues of Diary of a Mad Hedge Fund Trader that we didn?t have time to read because trading was too frenetic.

As for me, I am getting an early start on my tax returns this year so I can figure out how much my Obamacare is going to cost me. Thanks to my spectacular, once in a lifetime performance in 2013, Uncle Sam and I have quite a lot to talk about. What? You mean a $2,000 bottle of wine purchased in Portofino on the Italian Riviera (the seaside resort featured in The Wolf of Wall Street) is not deductible? If it is for Morgan Stanley, why not me?

Another reason for the sudden silence is that investors have suddenly become very cautious. We have just had a run for the ages. From my June 14 low I made a staggering 41.15% profit for my followers. My last 14 consecutive Trade Alerts have been profitable, as has every one so far in 2014. Those are serious numbers. While almost no one else matched these numbers, quite a few traders did well too.

Suddenly protecting performance has become far more important than catching that next marginal trade. When everyone else is in the same boat, markets go very quiet, until the boat tips over.

Things aren?t going to remain this dead forever. It reminds me of a witticism voiced by President Nixon?s chairman of the Council of Economic Advisors, Herbert Stein: ?If something cannot go on forever, it will stop.?

When the Trade Alert traffic dies down, I get barraged by daily complaints from readers that I?ve gotten lazy, I?ve gotten too rich to focus on this anymore, and that I ought to be doing more. Can you blame them? With an 85% success rate with my Alerts, who wouldn?t want more?

One of the reasons that my success rate is one of the highest in the industry is that I know when to quit trading. Some 45 years trading the markets has taught me one thing. If you chase a trade that?s not there it?s a perfect formula for losing money. There is no law stating that you always must have a position. That?s what brokers want you to do, a mug?s game at best.

My advice to you? Go out and spend some of the hard earned money you made last year from my Trade Alert Service. I understand there are great deals to be had on large screen HD TV?s at Best Buy. Unfortunately, my hometown San Francisco 49ers blew a playoff game in the last 22 seconds, depriving me from a trip to New York for Super Bowl XLVIII. But if you?re from Seattle or Denver, you definitely have something better to do for the week leading up to February 2.

Out With the Old?

INDU 1-23-14

XLY 1-23-14

And In With The New...

ABX 1-23-14

TLT 1-23-14

Football-49er-SeahawksThere Goes My Super Bowl Trip

https://www.madhedgefundtrader.com/wp-content/uploads/2014/01/Football-49er-Seahawks.jpg 400 388 Mad Hedge Fund Trader https://madhedgefundtrader.com/wp-content/uploads/2019/05/cropped-mad-hedge-logo-transparent-192x192_f9578834168ba24df3eb53916a12c882.png Mad Hedge Fund Trader2014-01-24 01:04:402014-01-24 01:04:40A few Thoughts on Trading Strategy
Page 100 of 103«‹9899100101102›»

Legal Disclaimer

There is a very high degree of risk involved in trading. Past results are not indicative of future returns. MadHedgeFundTrader.com and all individuals affiliated with this site assume no responsibilities for your trading and investment results. The indicators, strategies, columns, articles and all other features are for educational purposes only and should not be construed as investment advice. Information for futures trading observations are obtained from sources believed to be reliable, but we do not warrant its completeness or accuracy, or warrant any results from the use of the information. Your use of the trading observations is entirely at your own risk and it is your sole responsibility to evaluate the accuracy, completeness and usefulness of the information. You must assess the risk of any trade with your broker and make your own independent decisions regarding any securities mentioned herein. Affiliates of MadHedgeFundTrader.com may have a position or effect transactions in the securities described herein (or options thereon) and/or otherwise employ trading strategies that may be consistent or inconsistent with the provided strategies.

Copyright © 2026. Mad Hedge Fund Trader. All Rights Reserved. support@madhedgefundtrader.com
Scroll to top