On Friday, five serious hedge fund managers separately called me out of the blue and all had the same thing to say. They had never seen the market so negative before in the wake of the worst quarter in seven years. Therefore, it had to be a “BUY”.
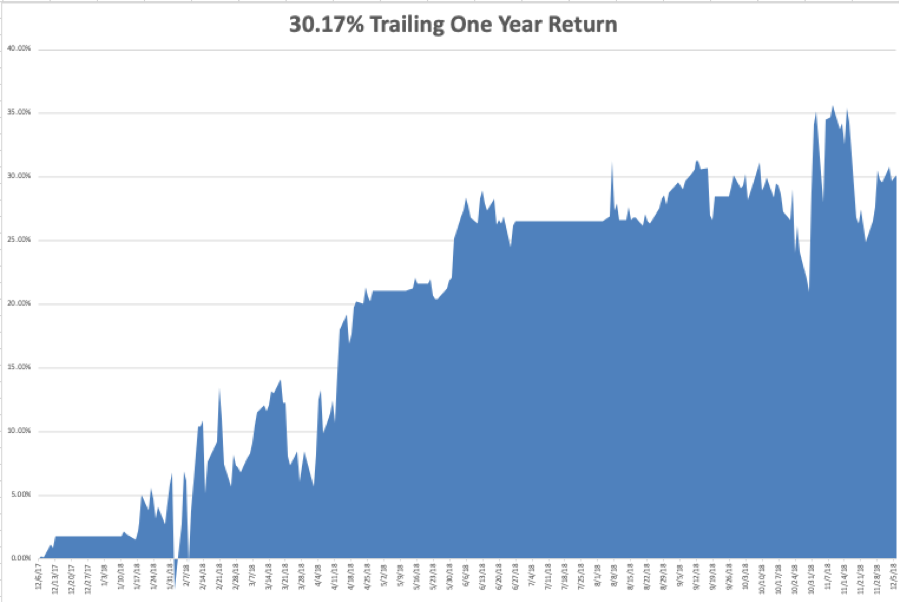
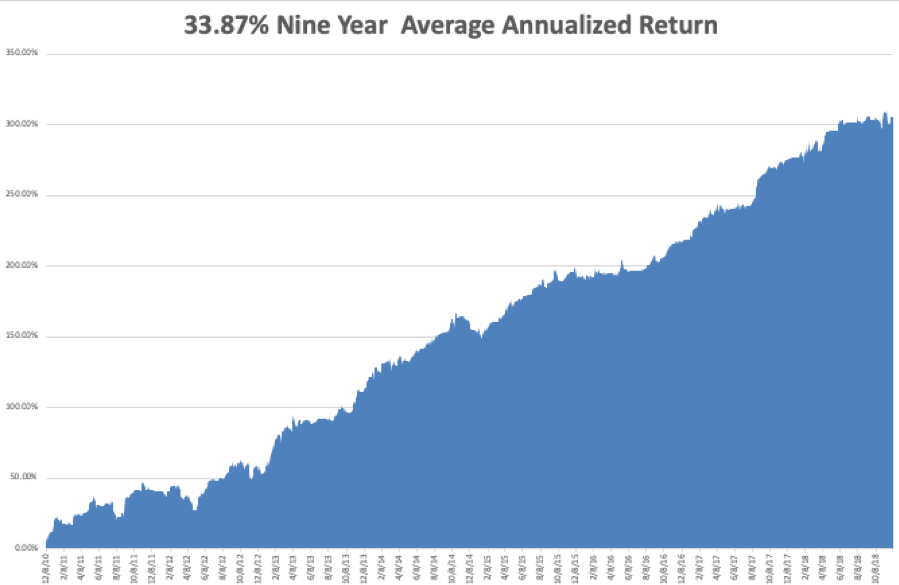
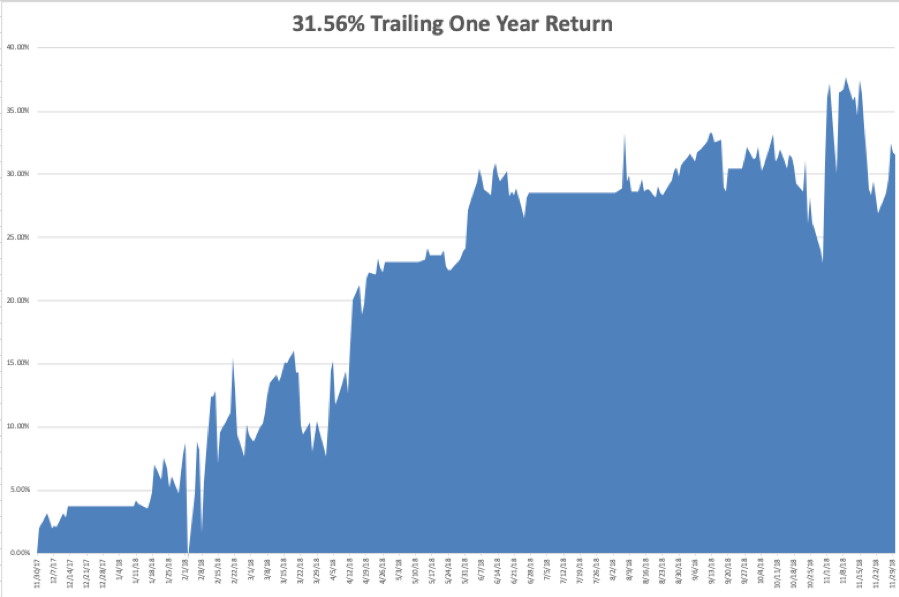
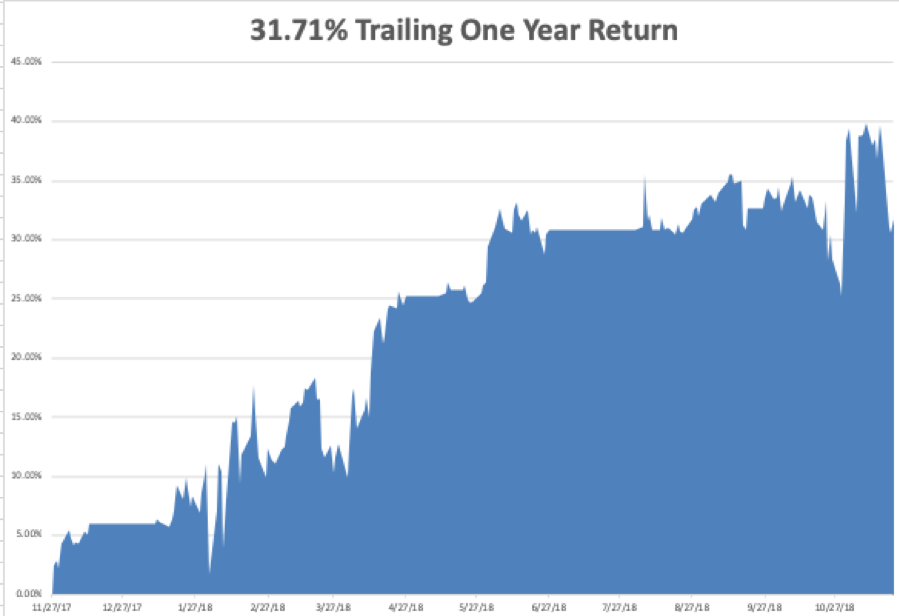
I, on the other hand, am a little more cautious. I have four 10% positions left that expire on Friday, in four trading days, and on that day I am going 100% into cash. At that point, I will be up 3.5% for the month of December, up 31.34% on the year, and will have generated positive return for one of the worst quarters in market history.
I’m therefore going to call it a win and head for the High Sierras for a well-earned Christmas vacation. After that, I am going to wait for the market to tell me what to do. If it collapses, I’ll buy it. If it rockets, I’ll sell short. And I’ll tell you why.
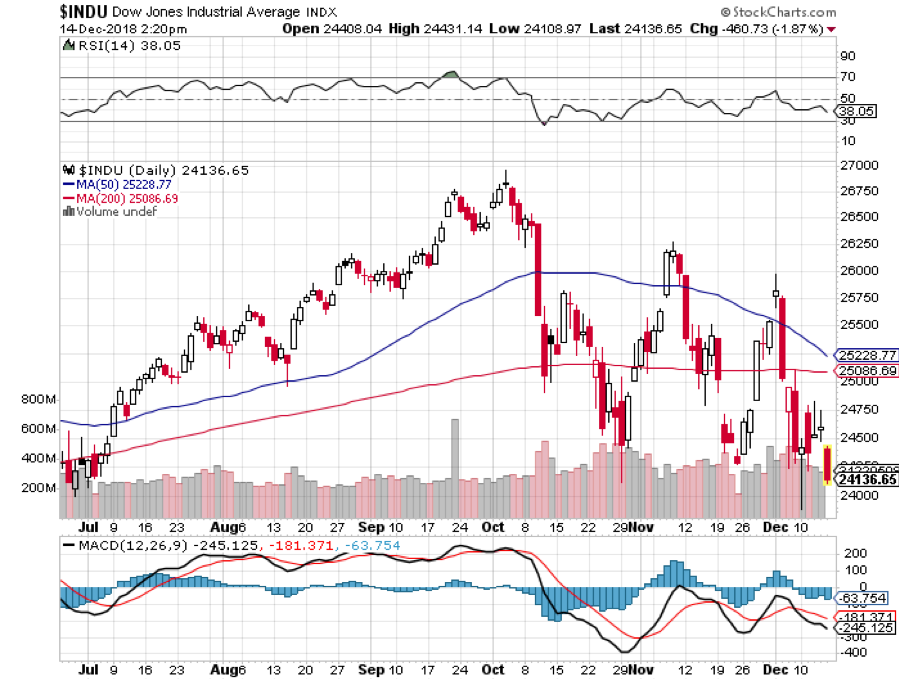
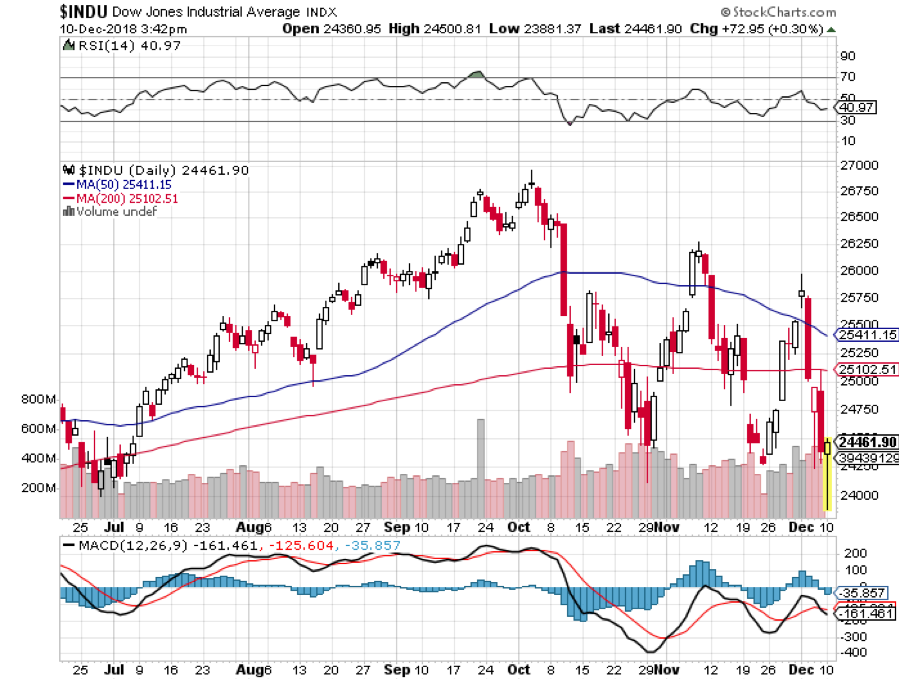
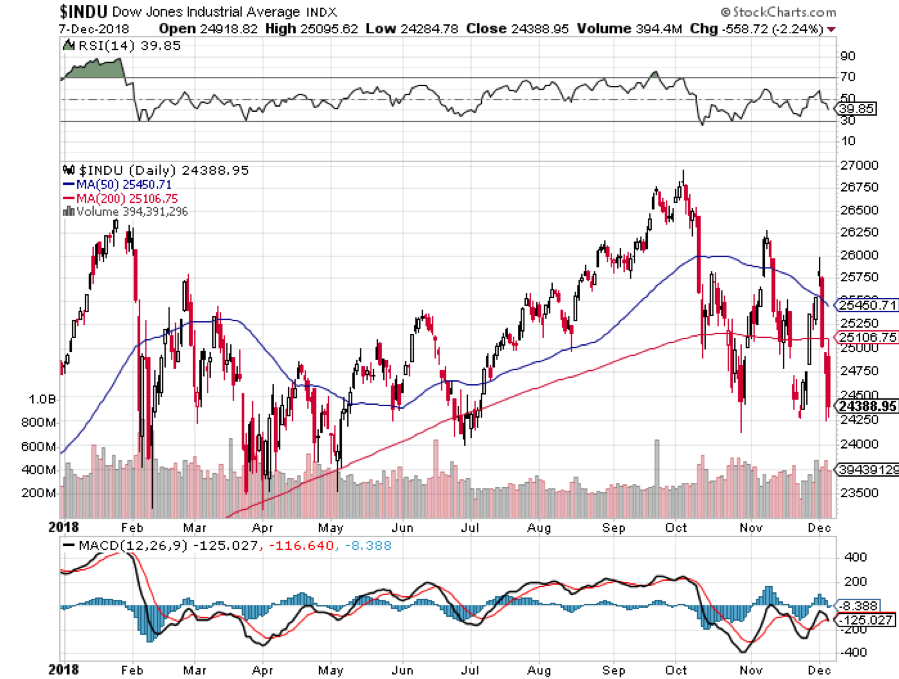
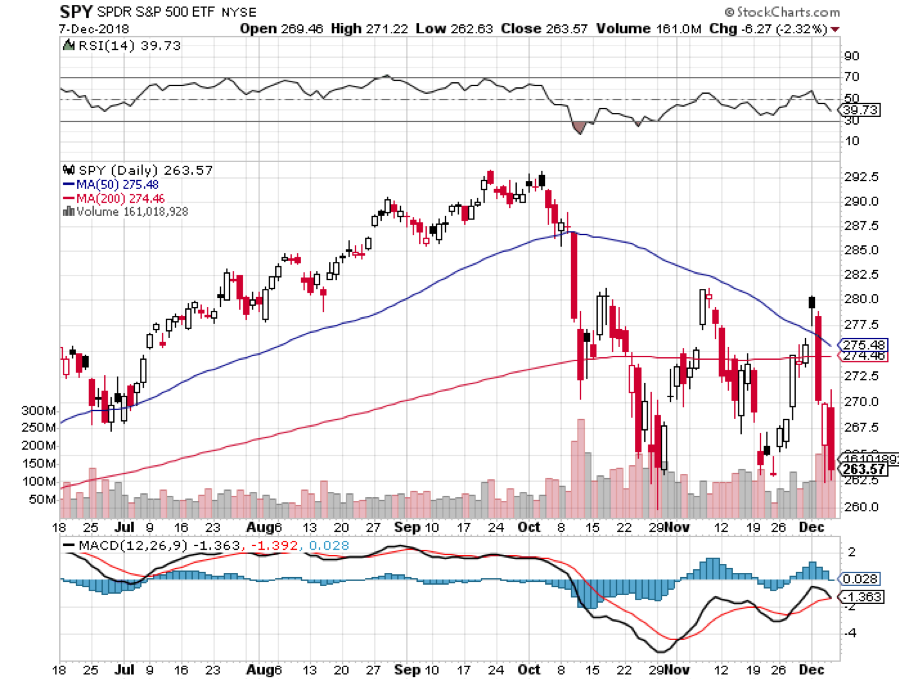
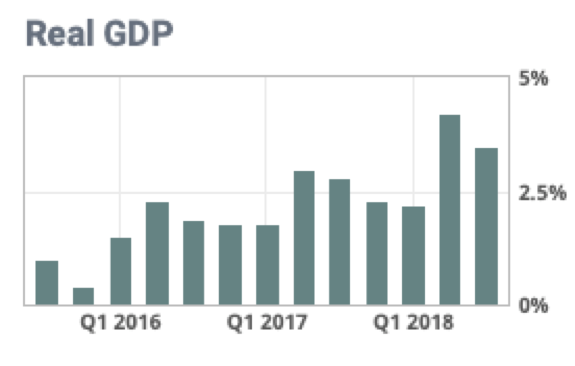
These are not the trading conditions you would expect when the economy is humming along at a 2.8% annual rate, unemployment is running at a half-century low, and earnings are growing a 26% year on year. You can’t find a parking spot in a shopping mall anywhere.
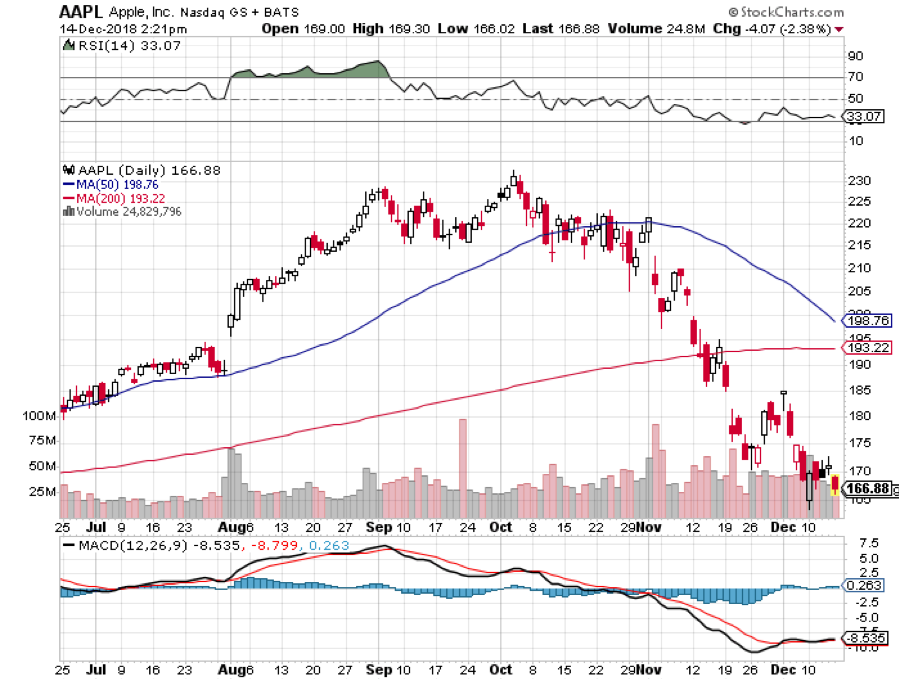
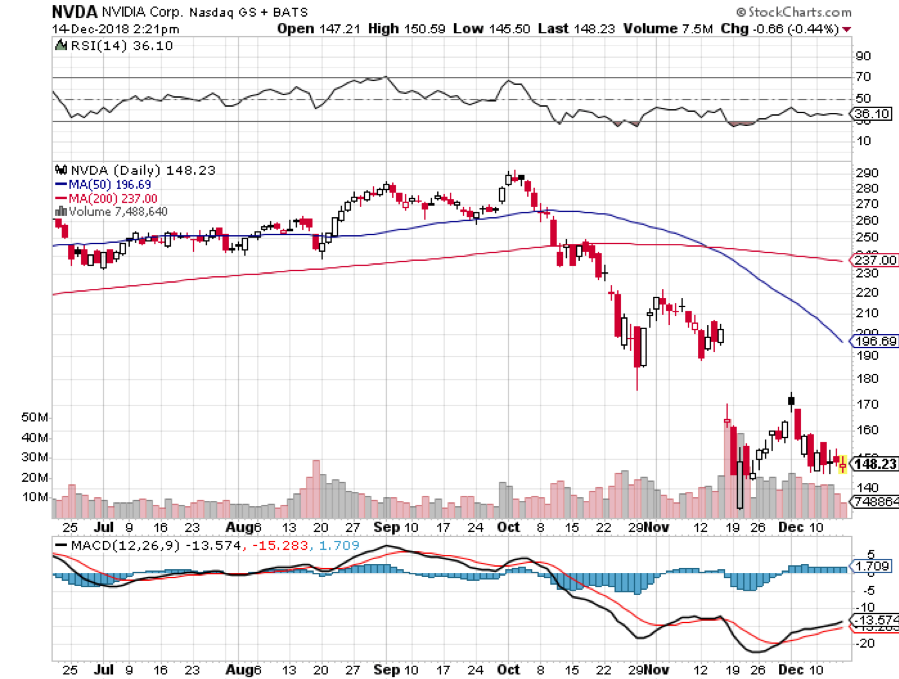
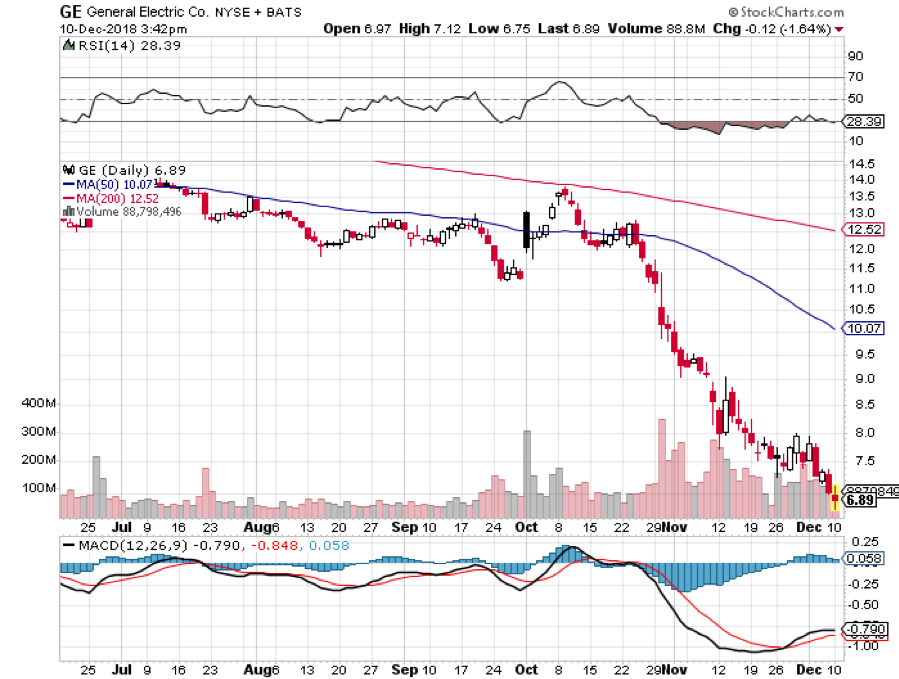
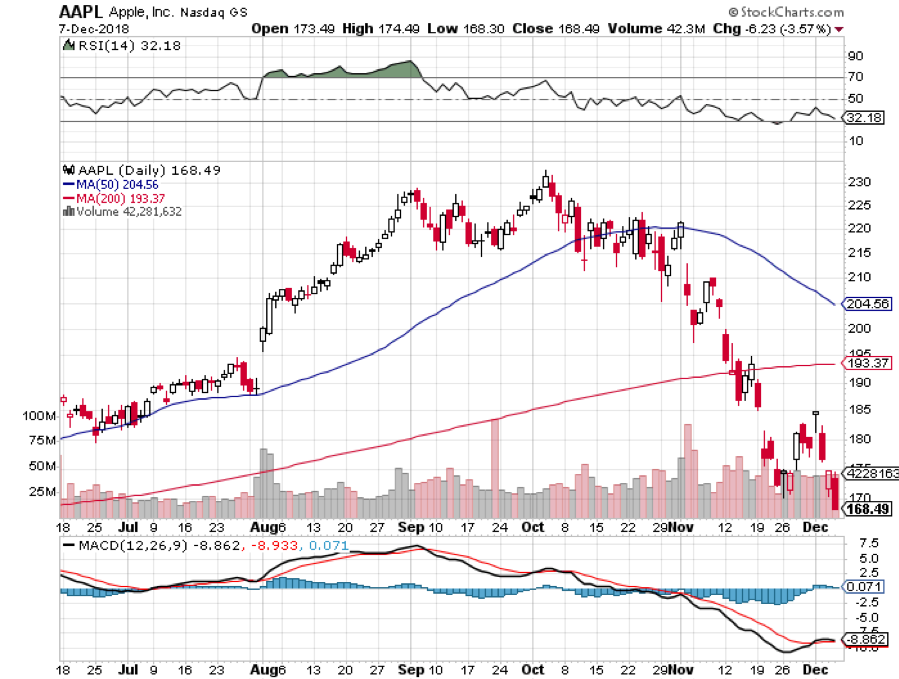
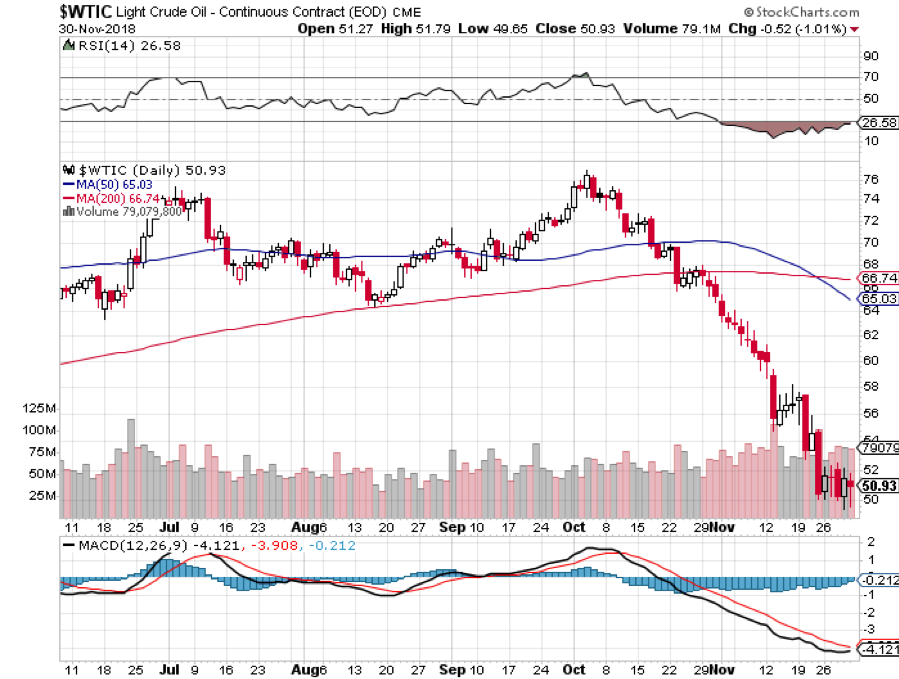
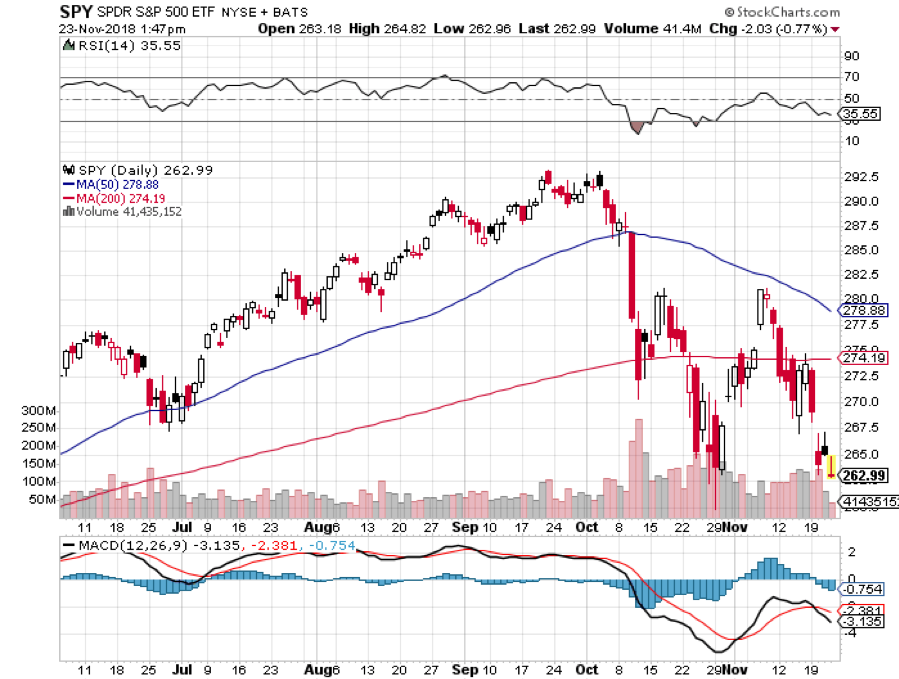
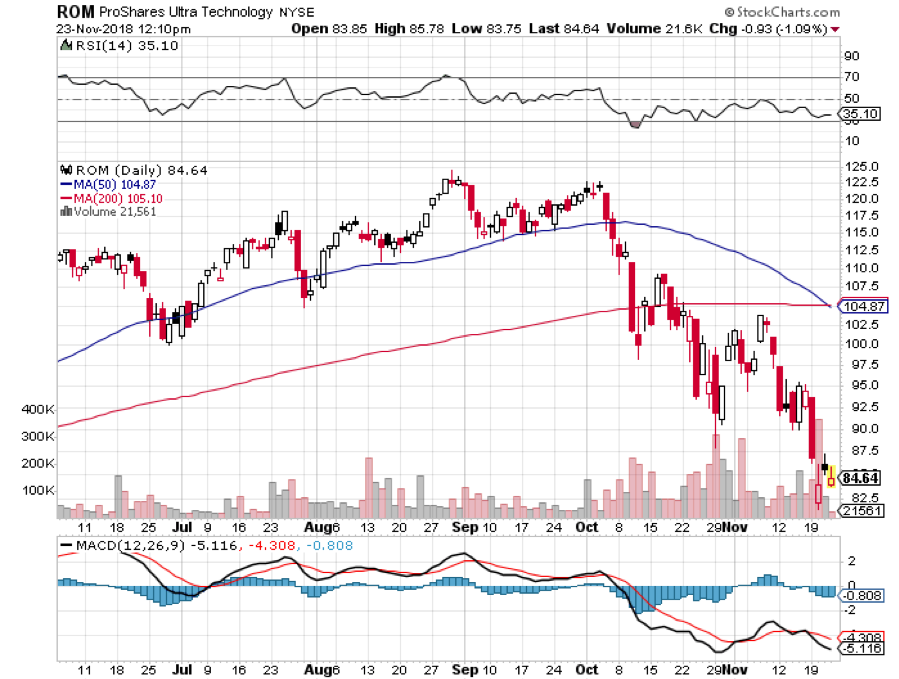
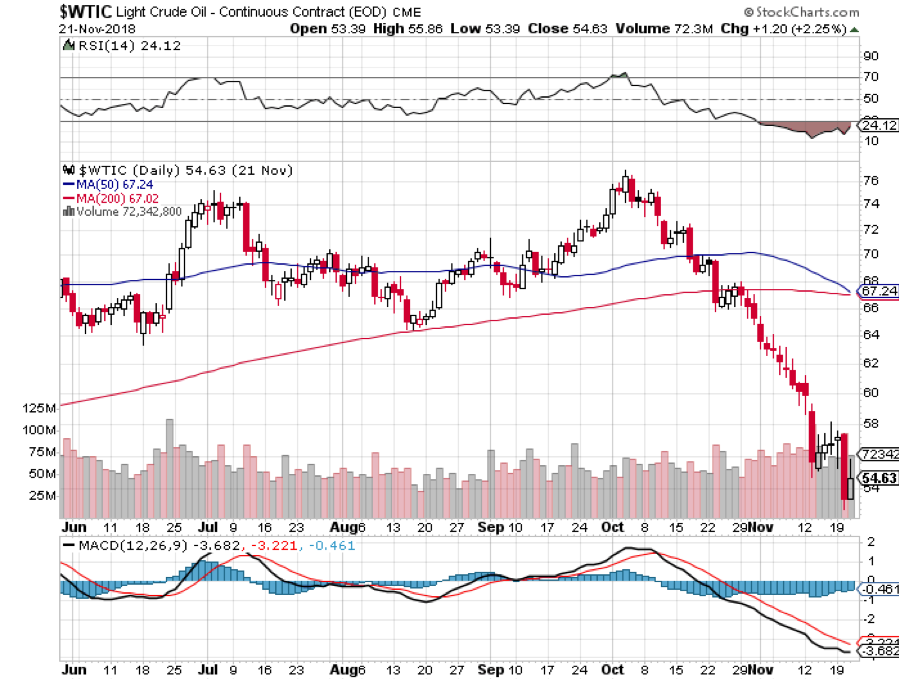
However, the lead stocks like Apple (AAPL), Amazon (AMZN), and Netflix (NFLX) have plunged by 30%-60%. Price earnings multiples dropped by a stunning 27.5% from 20X to 14.5X in a mere ten weeks. Half of the S&P 500 (SPY) is in a bear market, although the index itself isn’t there yet. I would rather be buying markets on their way up than to try and catch a falling knife.
There is only one catalyst for that apparent yawning contradiction: The President of the United States.
Trump has created a global trade war solely on his own authority. Only he can end it. As a result, asset classes of every description are beset with uncertainty, confusion, and doubt about the future. Analysts are shaving 2019 growth forecasts as fast as they can, businesses are postponing capital spending plans, and investors are running for the sidelines in droves. Business confidence is falling like a rock
To paraphrase a saying they used to teach you in Marine Corps flight school, “It’s better to be in cash wishing you were fully invested than to be fully invested wishing you were in cash.”
The Chinese have absolutely no interest in caving into Trump’s wishes. They read the New York Times, see the midterm election result and the opinion polls, and are willing to bet that they can get a much better deal from a future president in two years.
I have been dealing personally with both Trump and the Chinese government for four decades. The Middle Kingdom measures history in Millenia. The president lives from tweet to tweet. The Chinese government can take pain by simply ordering its people to take it. We have elections every two years with immediate consequences.
The best we can hope for is that the president folds, declares victory, and then retreats from his personal war. This can happen at any time, or it may not happen at all. No one has an advantage in predicting what will happen with any certainty. Not even the president knows what he is going to do from minute to minute.
It is the possibility of trade peace at any time that has kept me out of the short side of the stock market in this severe downturn. That robs a real hedge fund manager of half his potential income. Trade peace could be worth an instant rally of 10% in the stock market. Even a lesser move, like the firing of trade advisor Peter Navarro, would accomplish the same.
The market was long overdue for a correction like the one we have just had. Investors were getting overconfident, cocky, and excessively leveraged. In October, we really needed the tide to go out to see who was swimming without a swimsuit. But if the tide goes out too far, we will all appear naked.
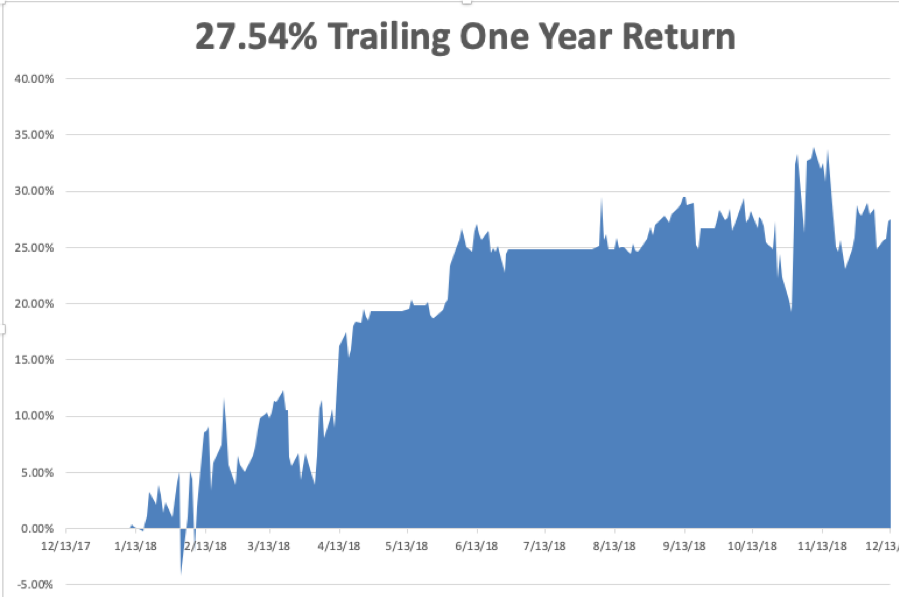
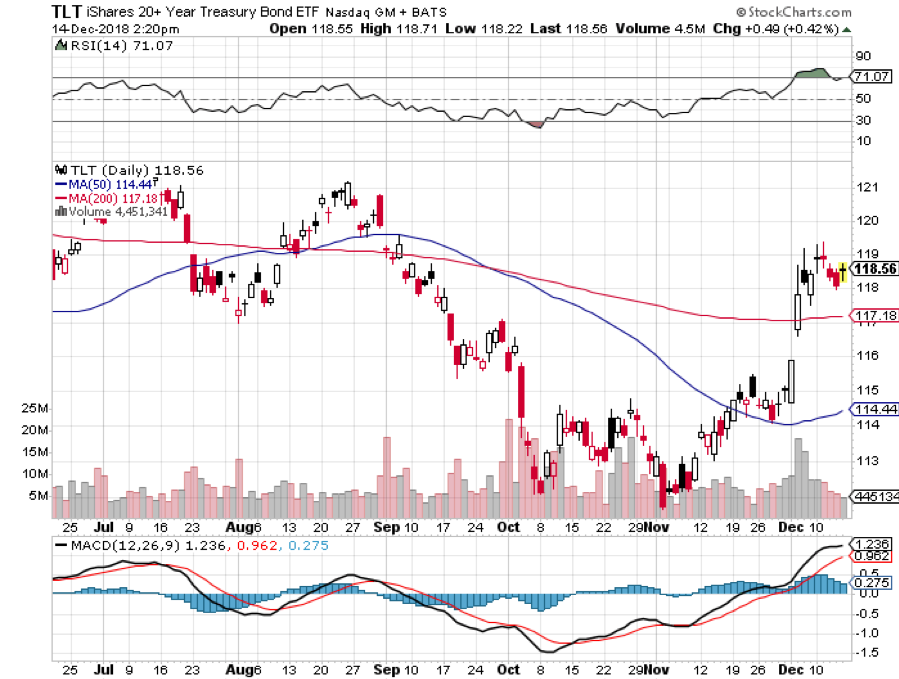
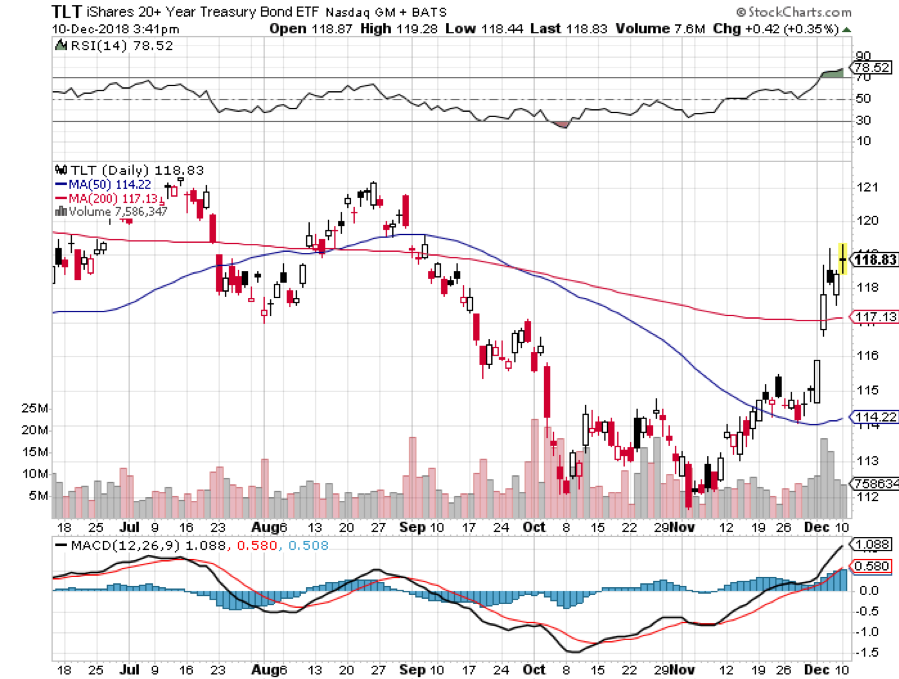
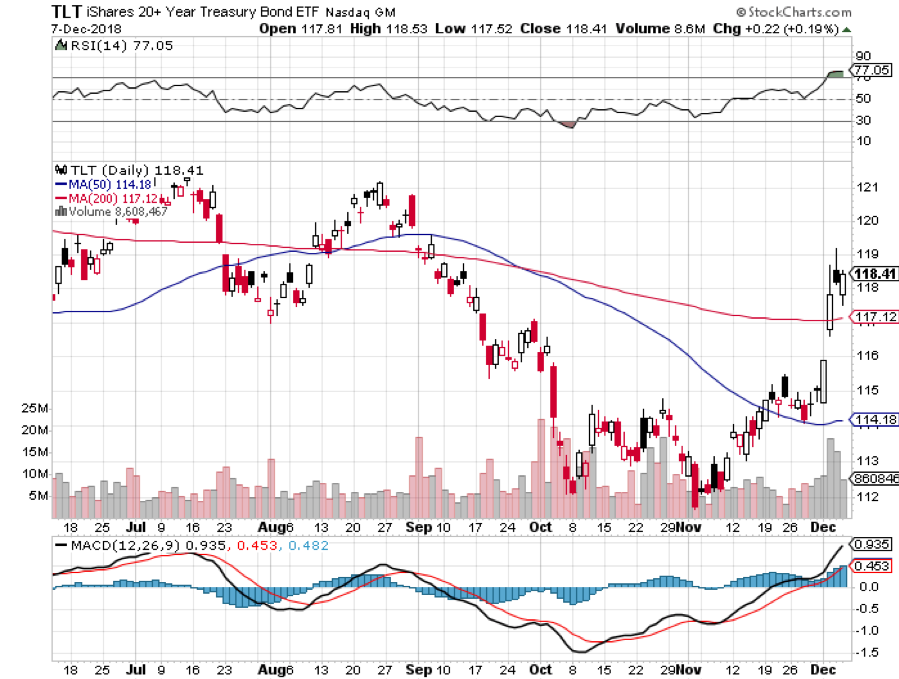
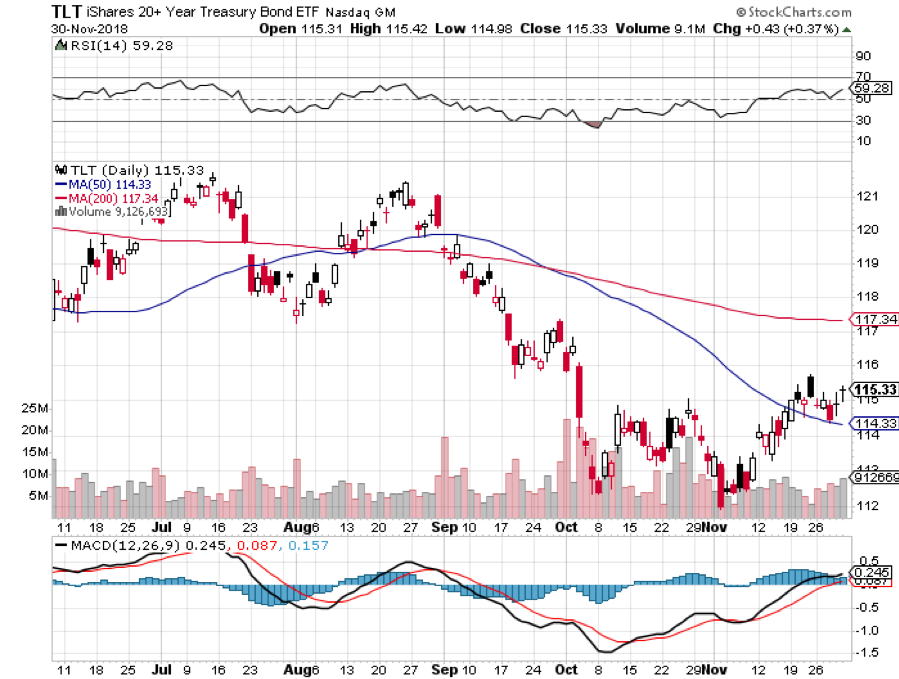
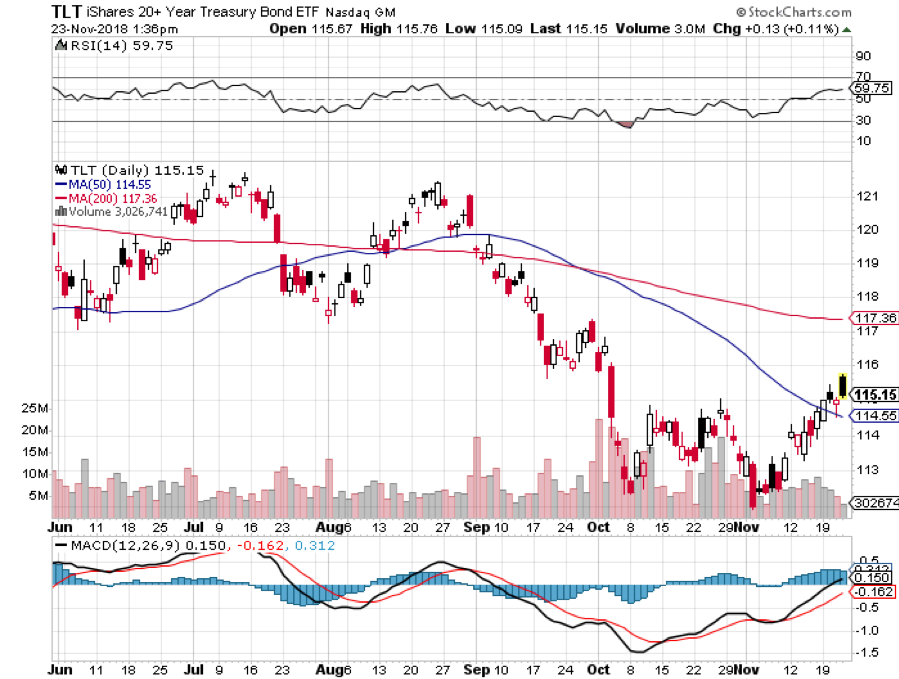
Thanks to some very artful trading, my year to date return recovered to +27.54% boosting my trailing one-year return back up to 27.54%. I covered an aggressive short position in the bond market (TLT) for a welcome 14.4% profit. I also took profits with an instant winner in PayPal (PYPL). On the debit side, I stopped out of an Apple call spread for a minimal loss.
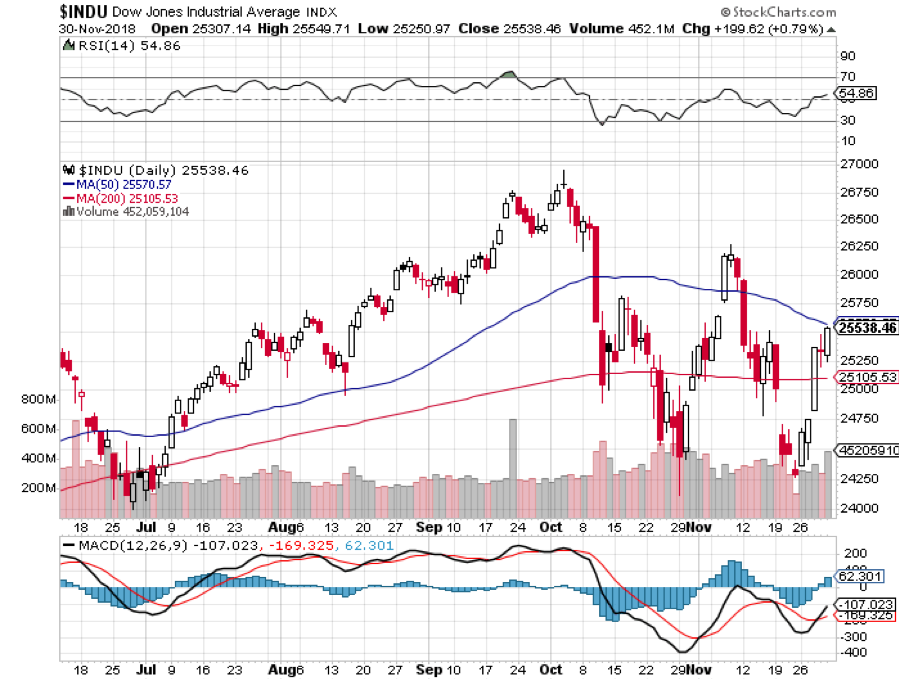
December is showing a very modest loss at -0.26%. The market has become virtually untradeable now, with tweets and China rumors roiling markets for 500 points at a pop. And this is against a Dow Average that is down a miserable -2.8% so far in 2018. I should have listened to my mother when she wanted me to become a doctor.
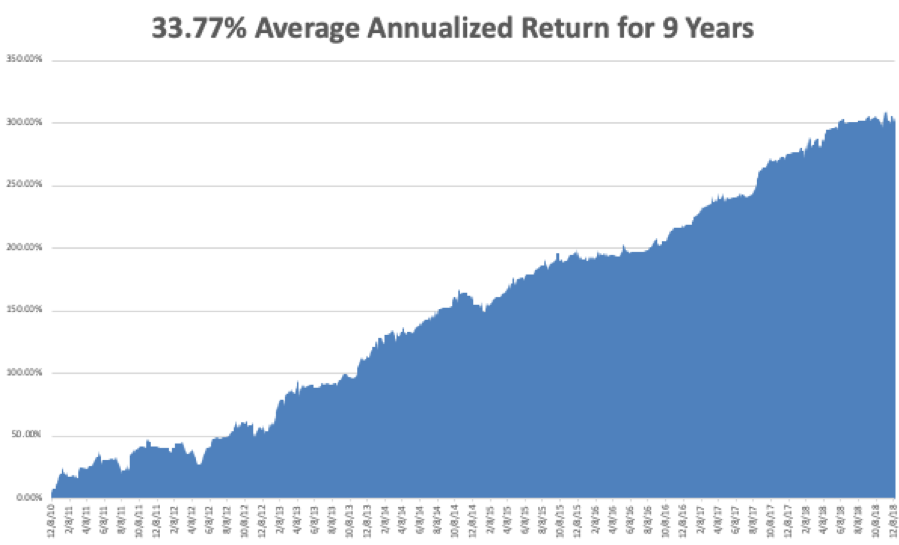
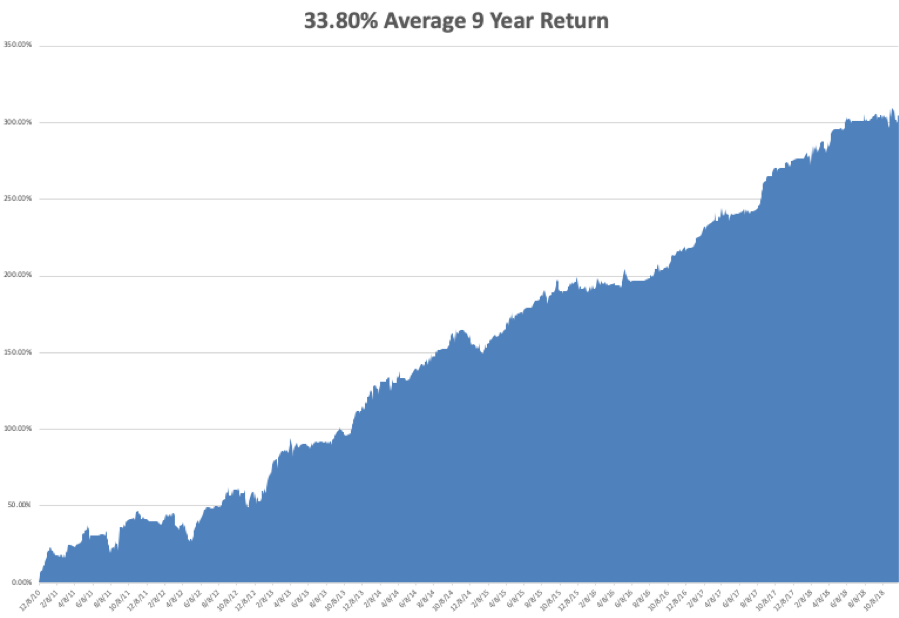
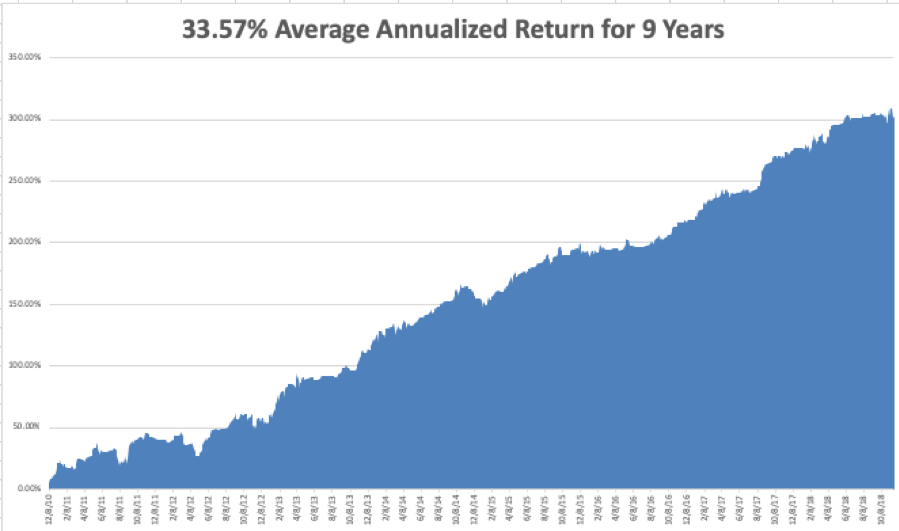
My nine-year return nudged up to +304.01. The average annualized return revived to +33.77.
The upcoming week is all about housing data, with the big focus on the Fed’s interest rate hike on Wednesday.
Monday, December 17 at 10:00 AM EST, the November Homebuilders Index is out.
On Tuesday, December 18 at 8:30 AM, November Housing Starts are published.
On Wednesday, December 19 at 10:00 AM EST, November Existing Home Sales are released.
At 10:30 AM EST the Energy Information Administration announces oil inventory figures with its Petroleum Status Report.
At 2:00 PM the Federal Reserve Open Market Committee announces a 25 basis point rise in interest rates, taking the overnight rate to 2.25% to 2.50%. An important press conference with governor Jay Powell follows.
Thursday, December 20 at 8:30 AM EST, we get Weekly Jobless Claims.
On Friday, December 21, at 8:30 AM EST, we learn the latest revision to Q3 GDP which now stands at 2.8%.
The Baker-Hughes Rig Count follows at 1:00 PM.
As for me, I’ll be battling snow storms driving up to Lake Tahoe where I’ll be camping out for the next two weeks. Mistletoe, eggnog, and endless games of Monopoly and Scrabble await me.
Good luck and good trading!
John Thomas
CEO & Publisher
The Diary of a Mad Hedge Fund Trader